
Whole-number place value lesson
Enter a multi-digit integer and follow each digit through ones, tens, hundreds and larger places. Empty unused columns distinguish absent digits from written zeroes.
Explore this examplePlace Value Chart Printable — Free Chart Maker
Turn a whole number or decimal into a labeled chart and a real A4 or Letter PDF.
Start with up to 150 free credits|No credit card required
Get up to 250 free credits on day one when you join through an invite.
Place Value Chart Printable — Free Chart Maker— templates & examples
Updated
Free scientific tools
Turn a whole number or decimal into a labeled chart and a real A4 or Letter PDF.
A place value chart assigns each digit to a decimal position, from whole-number places to fractional places. SciFig creates a printable chart from your written number, preserving zero digits and providing blank practice output. Enter an integer or decimal, choose filled or blank cells and select A4 or Letter. Outputs include a printable PDF, figure files and a project that restores the original written number.
Keep each written digit, compare whole and fractional places and prepare a real printable page.
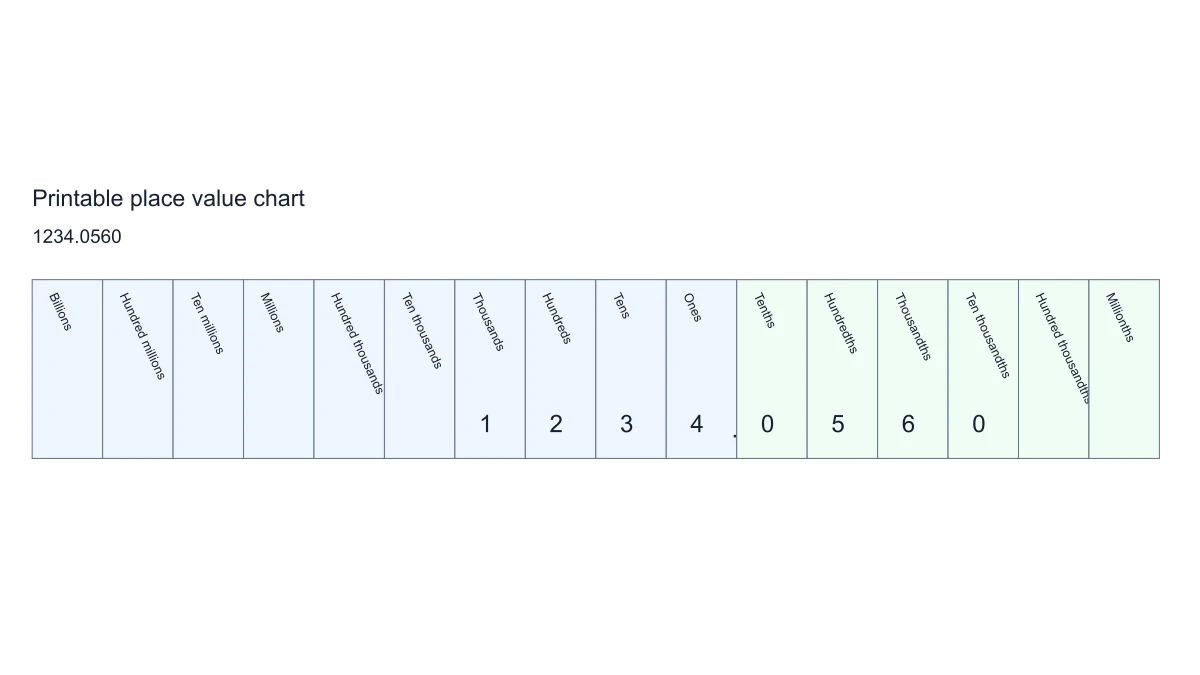
The chart reads the written number as text rather than converting it into a floating-point value. In 1234.0560, the zero in the tenths column and the final zero in the ten-thousandths column remain visible. Leading zeroes also retain their written places within the supported number length.
The table spans billions through millionths, with whole-number and fractional columns grouped visually. Place names label each column. Enter up to ten integer digits and six fractional digits, then use the same table to explain how a digit’s position changes its value. The decimal place value chart keeps tenths through millionths aligned with the digits entered.
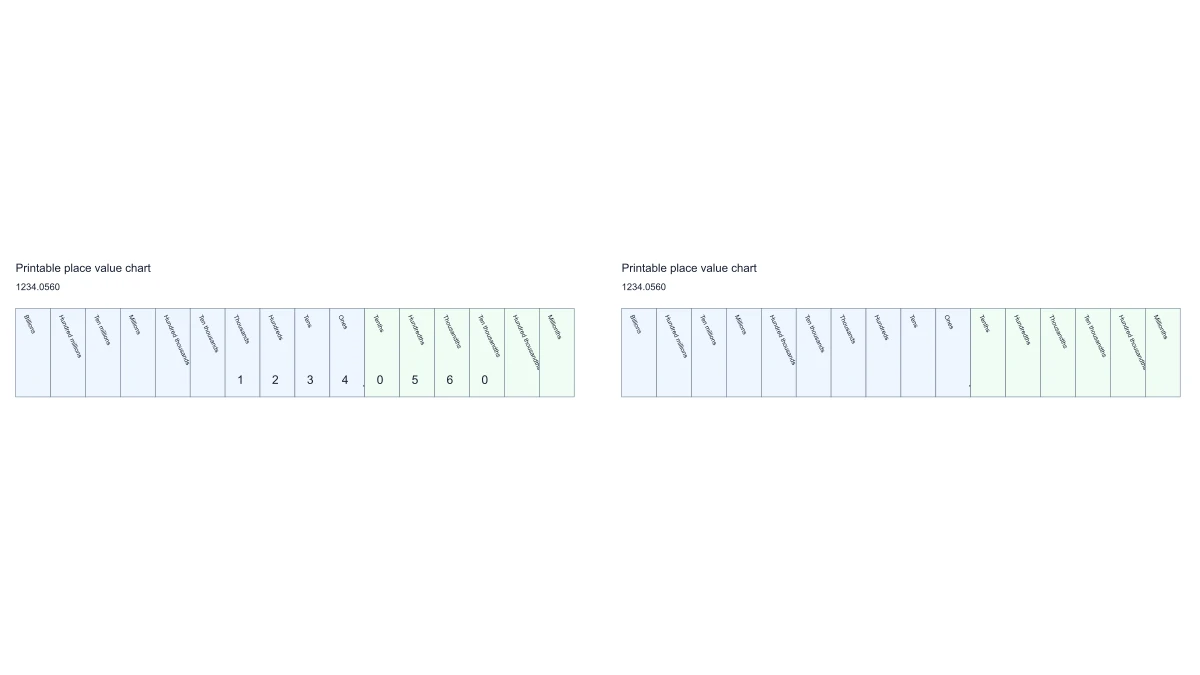
Switch from the filled chart to a blank chart while retaining its column structure and place names. The blank version leaves the digit cells empty. Load the example again when you want to demonstrate a complete number, or save different numbers as separate JSON projects.
Choose A4 or Letter and download an actual landscape PDF with page margins. The chart is fitted to the selected paper rather than exported as an unconfigured screenshot. SVG and PNG are also available for slides, and CSV provides the exponent and digit data.
Enter the written number, choose filled or blank cells and select a paper size for the PDF.
Type an integer or decimal using a dot as the decimal separator. Keep any zeroes you want to explain; the chart maps the written digits rather than a rounded numeric conversion.
Use the filled chart for an example and the blank chart for practice. Column names remain in place when the digit cells are empty.
Choose A4 or Letter for the printable PDF. The landscape page includes margins and fits the current chart within the selected paper.
Download PDF, SVG, PNG or the exponent-and-digit CSV. Save JSON to restore the original written number, display mode and paper setting.
Use a shared decimal column structure for worked numbers, blank practice and presentation figures.
Enter a multi-digit integer and follow each digit through ones, tens, hundreds and larger places. Empty unused columns distinguish absent digits from written zeroes.
Explore this example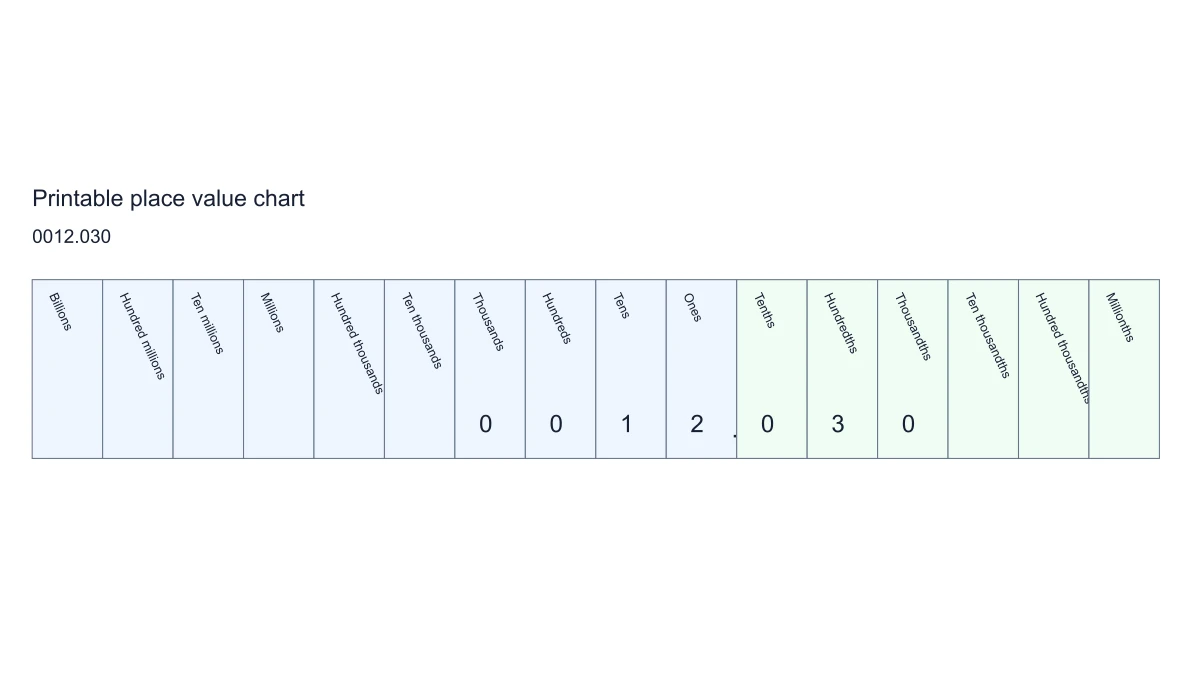
Use a decimal such as 1234.0560 to compare tenths, hundredths and thousandths. Keep the interior and final zeroes when discussing the written representation.
Explore this example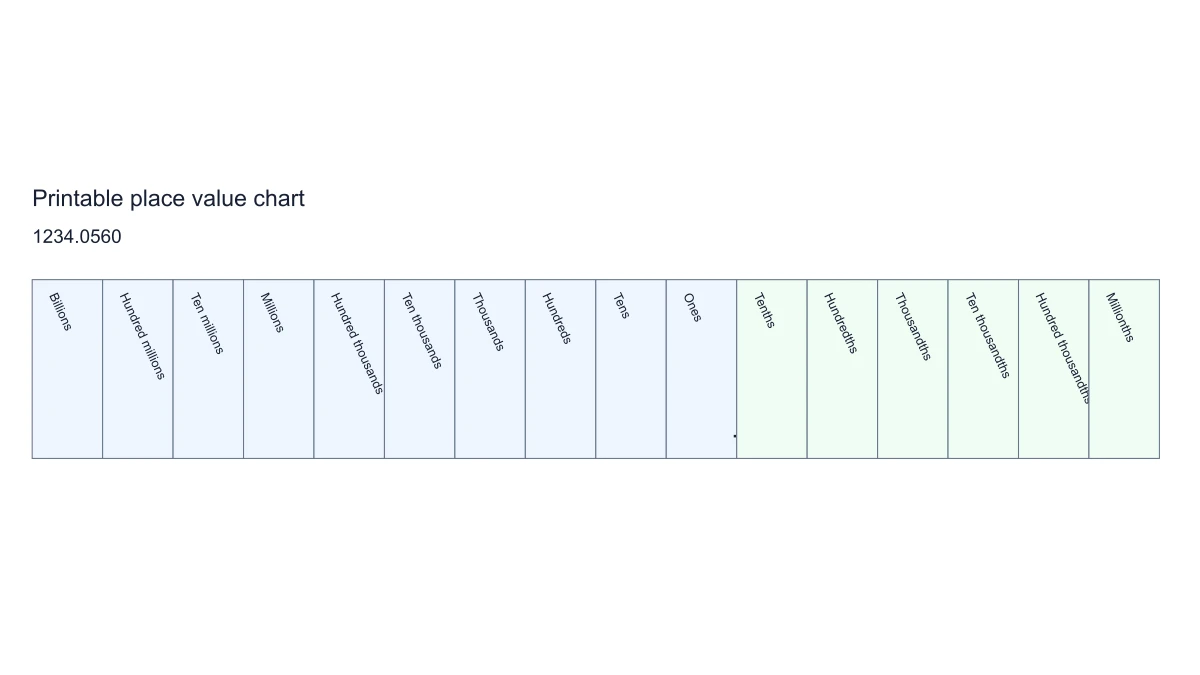
Choose the blank mode, select A4 or Letter and download the PDF. The page has a defined paper size and margins for printing.
Explore this example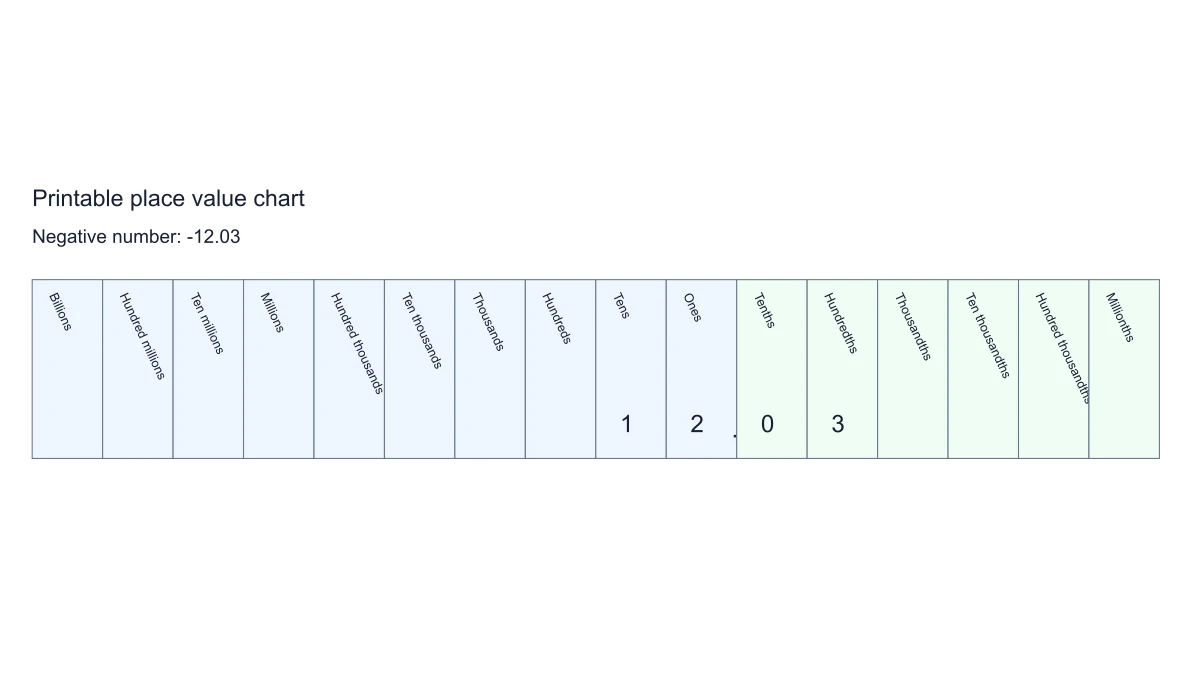
Export the filled chart for explanation, then create a blank chart with the same column names. Save the source number to return to the example.
Explore this exampleUse localized place names to connect number notation with the course language. The base-ten column structure stays the same.
Explore this exampleDownload SVG for a vector figure or PNG for a slide. Use the CSV when you want the position and digit values as a simple table.
Explore this exampleI made this place value chart printable on A4 using the written number 1234.0560. The zero in the tenths column and the final zero both remain. The PDF uses a landscape paper page with margins, so the chart is a defined printable document rather than an unconfigured screen capture.
SciFig · A4 decimal example
Figure preparation · SciFig
Free tools
A tool for every scientific figure
150 focused generators for the scientific figure you need — each opens in the right workspace with a matching example.
Illustrations, structures and concept diagrams
83 tools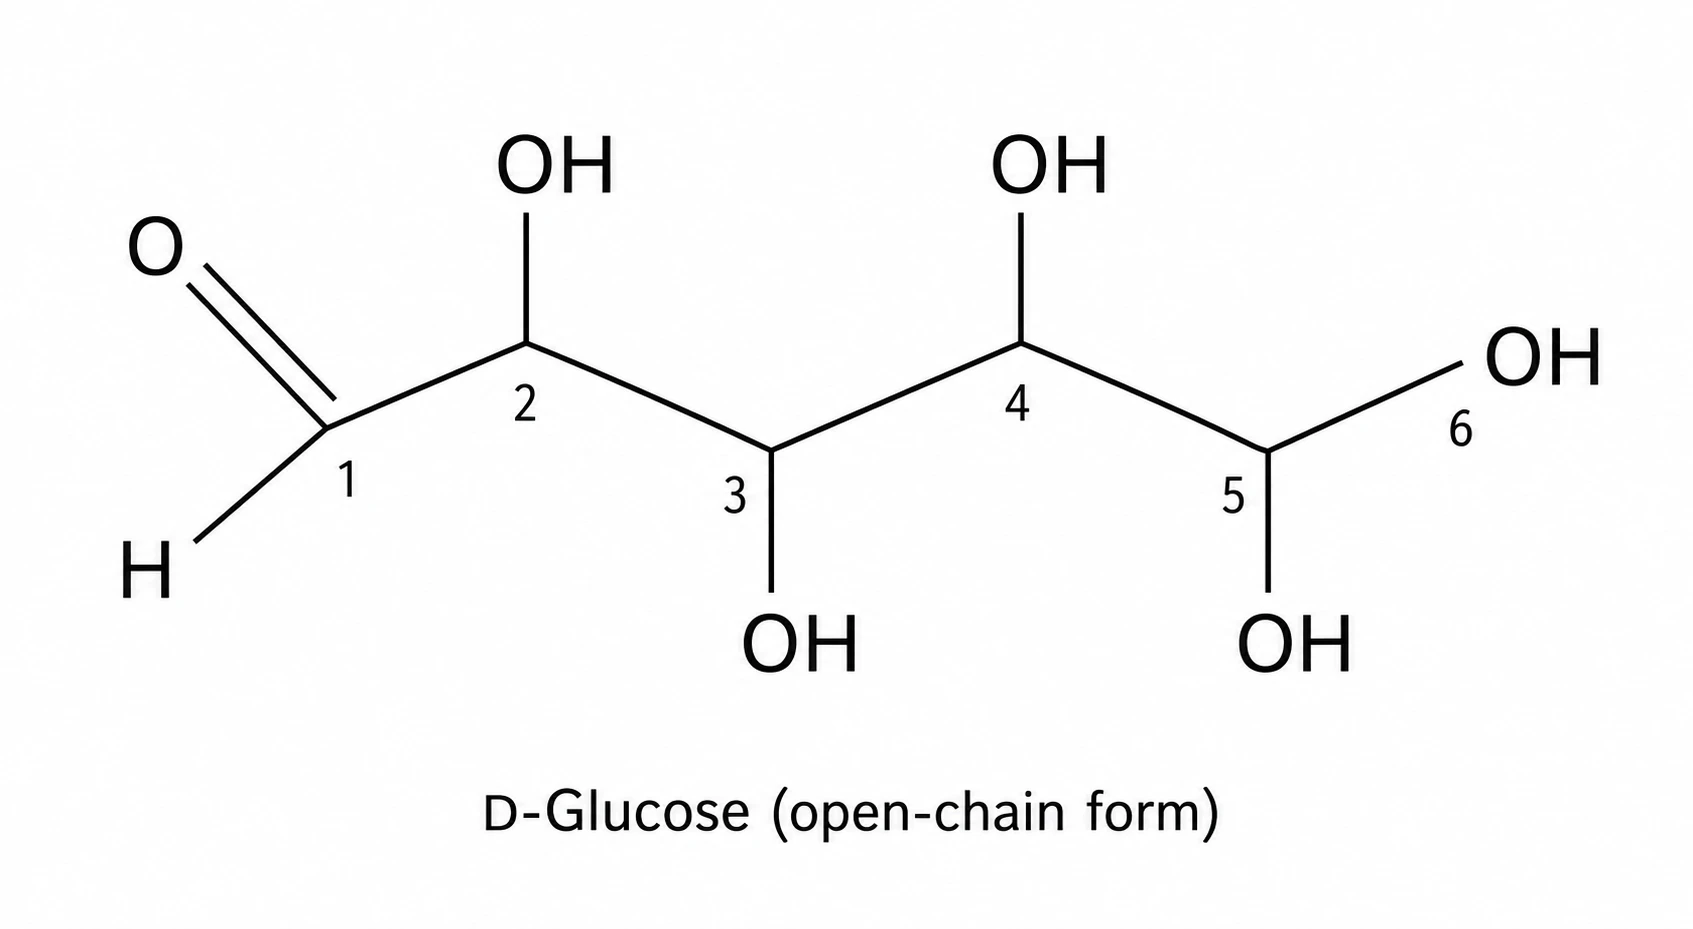 Chemistry Structure Generator
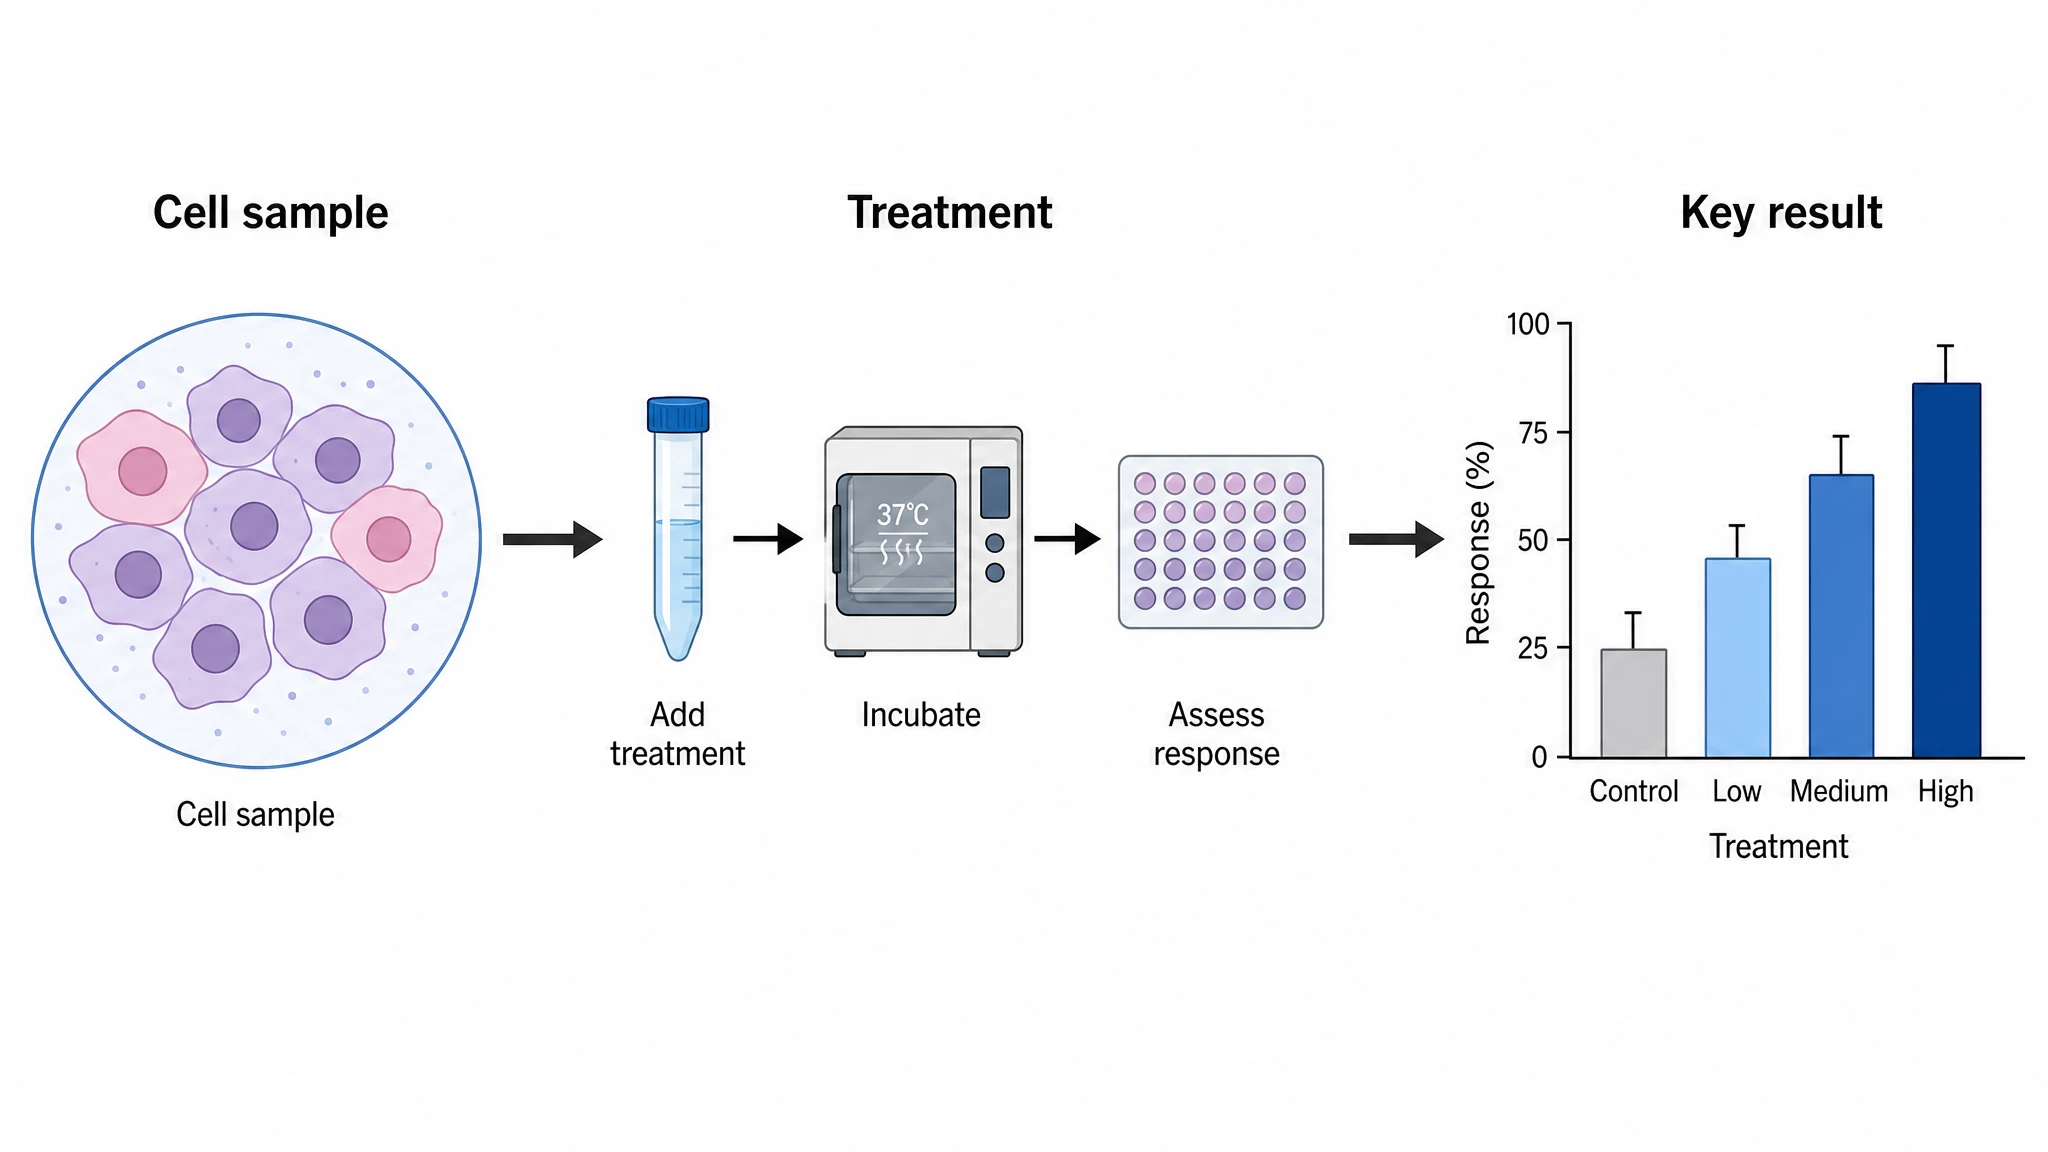 Graphical Abstract Maker
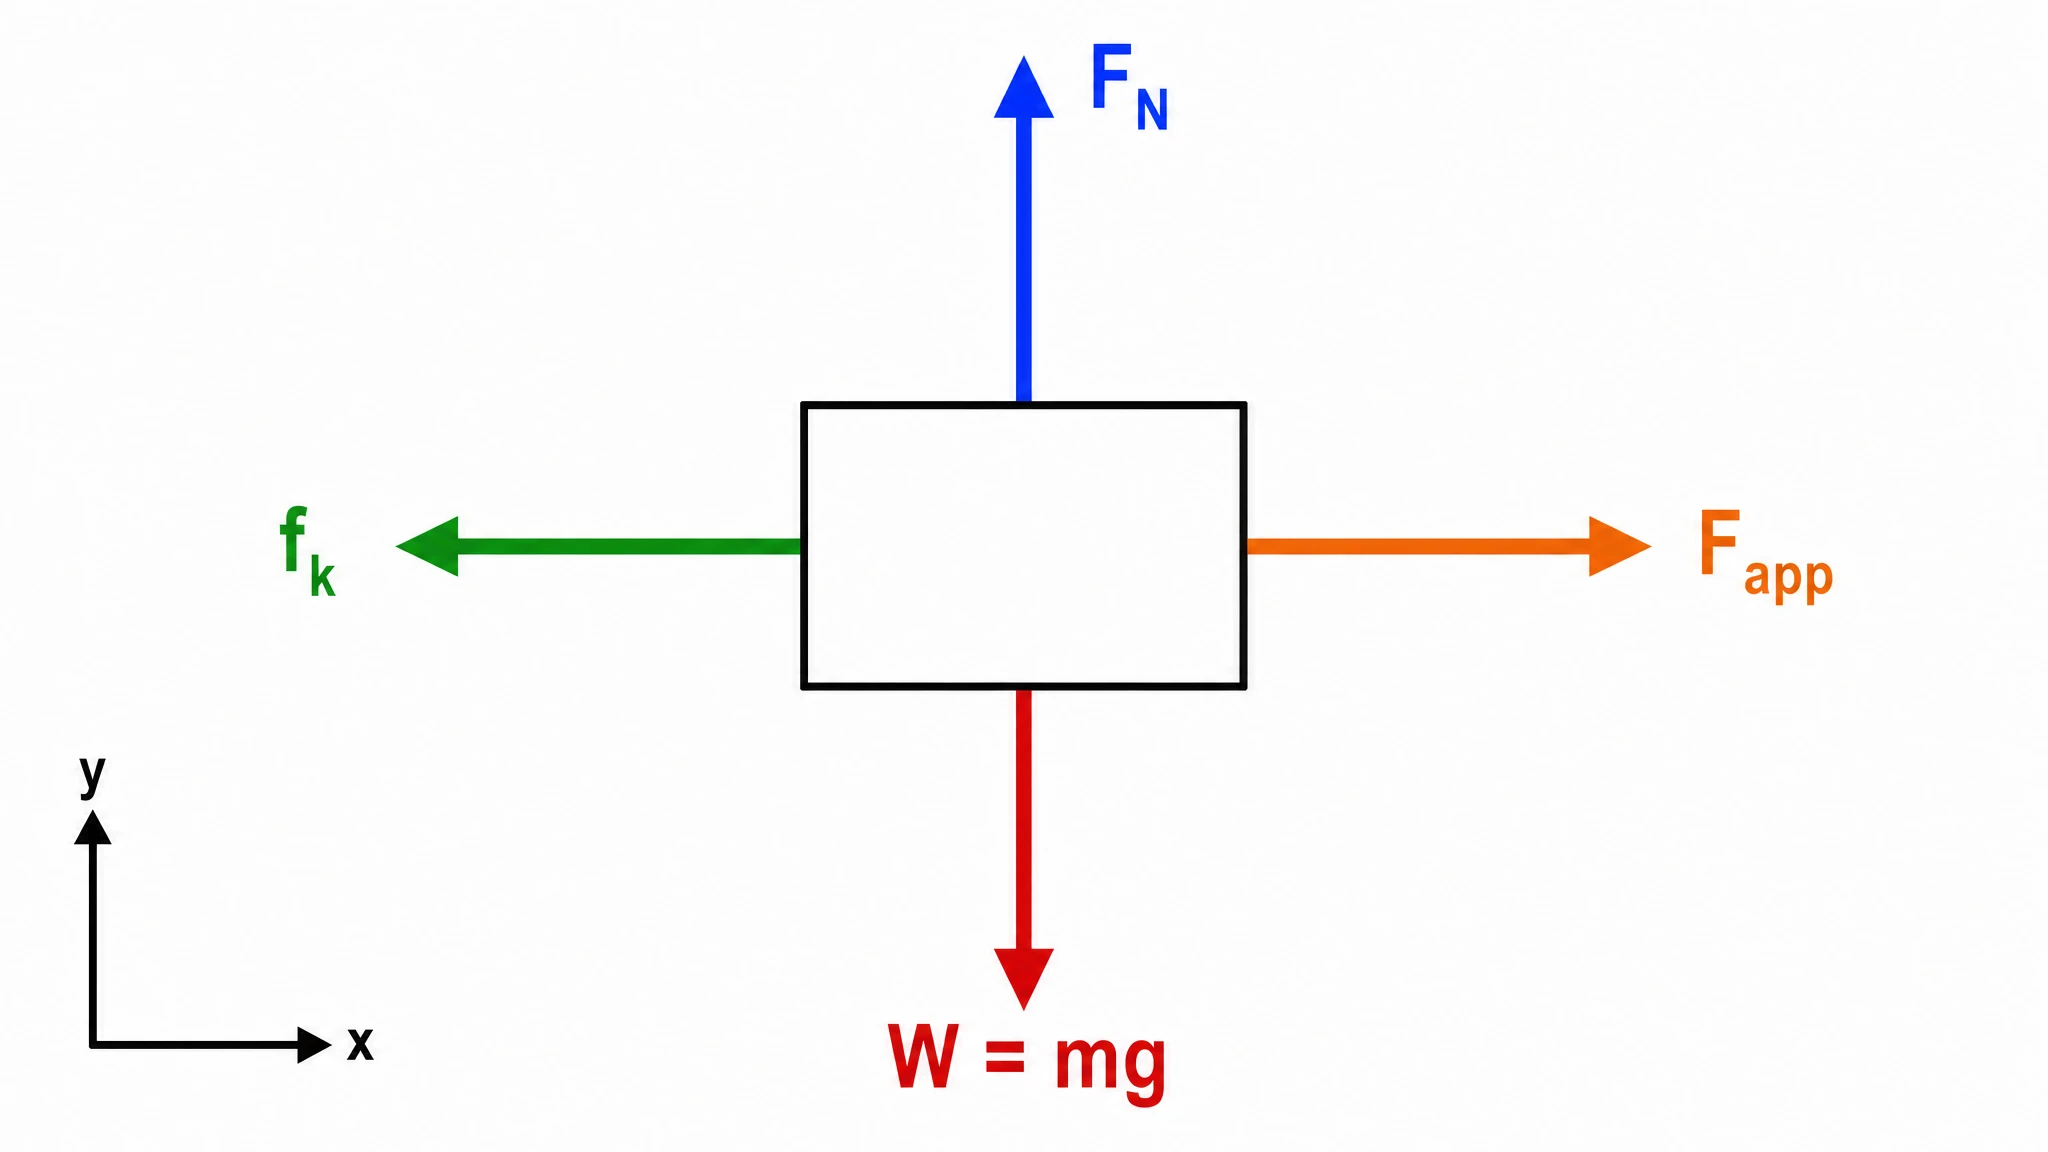 Free Body Diagram Generator
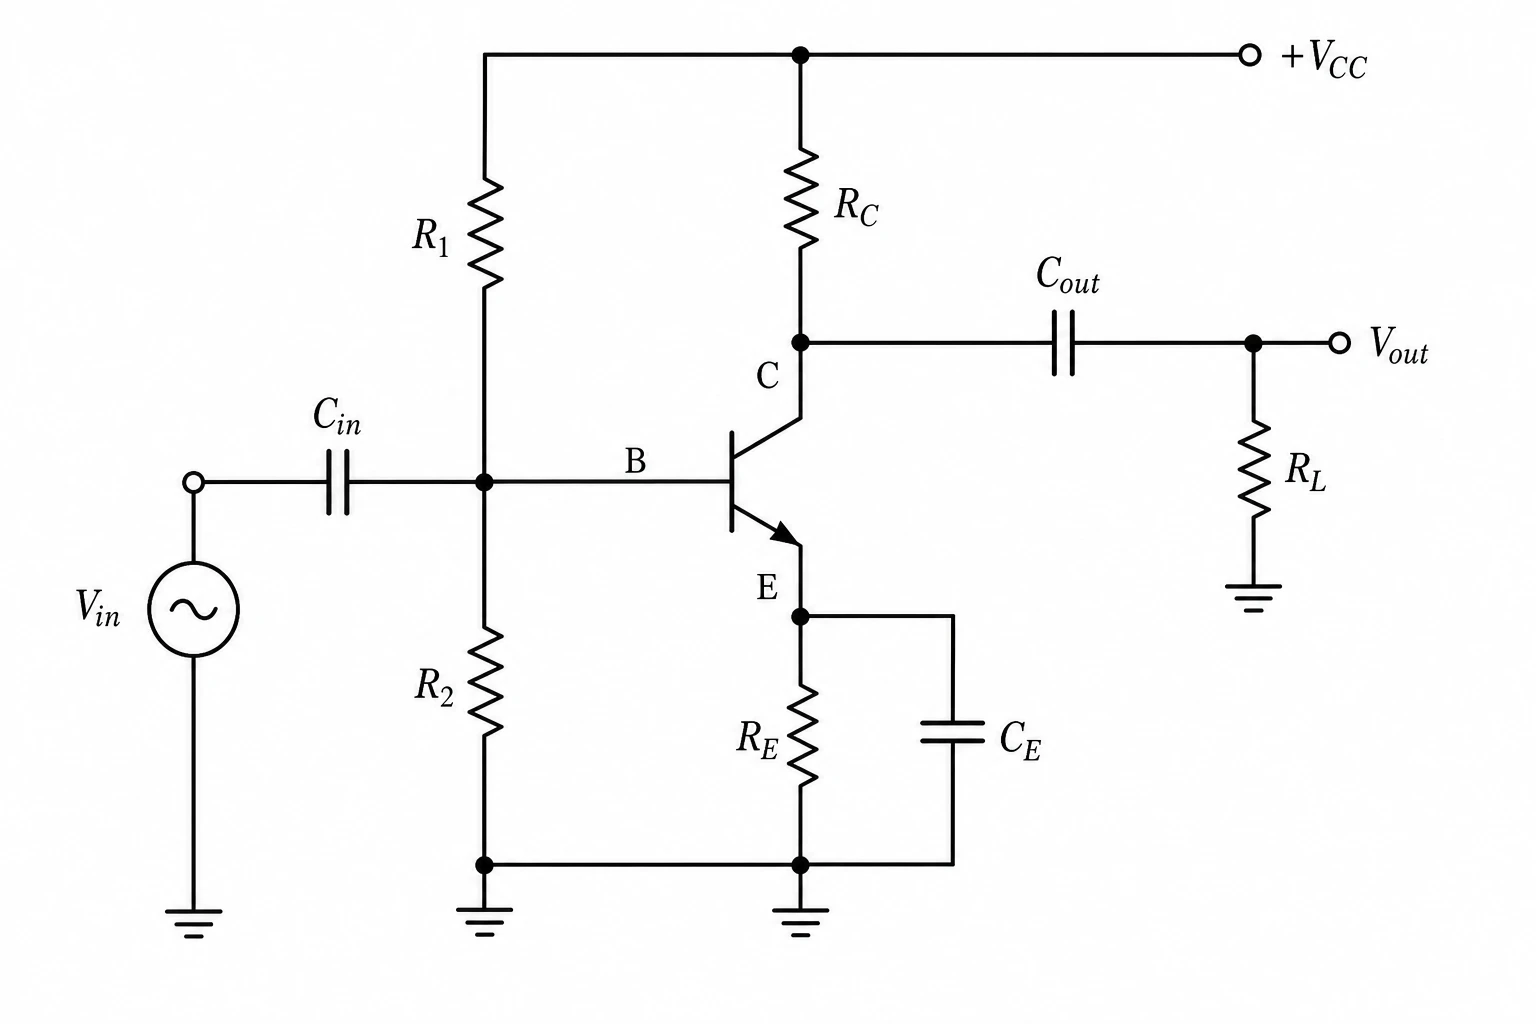 Circuit Diagram Maker
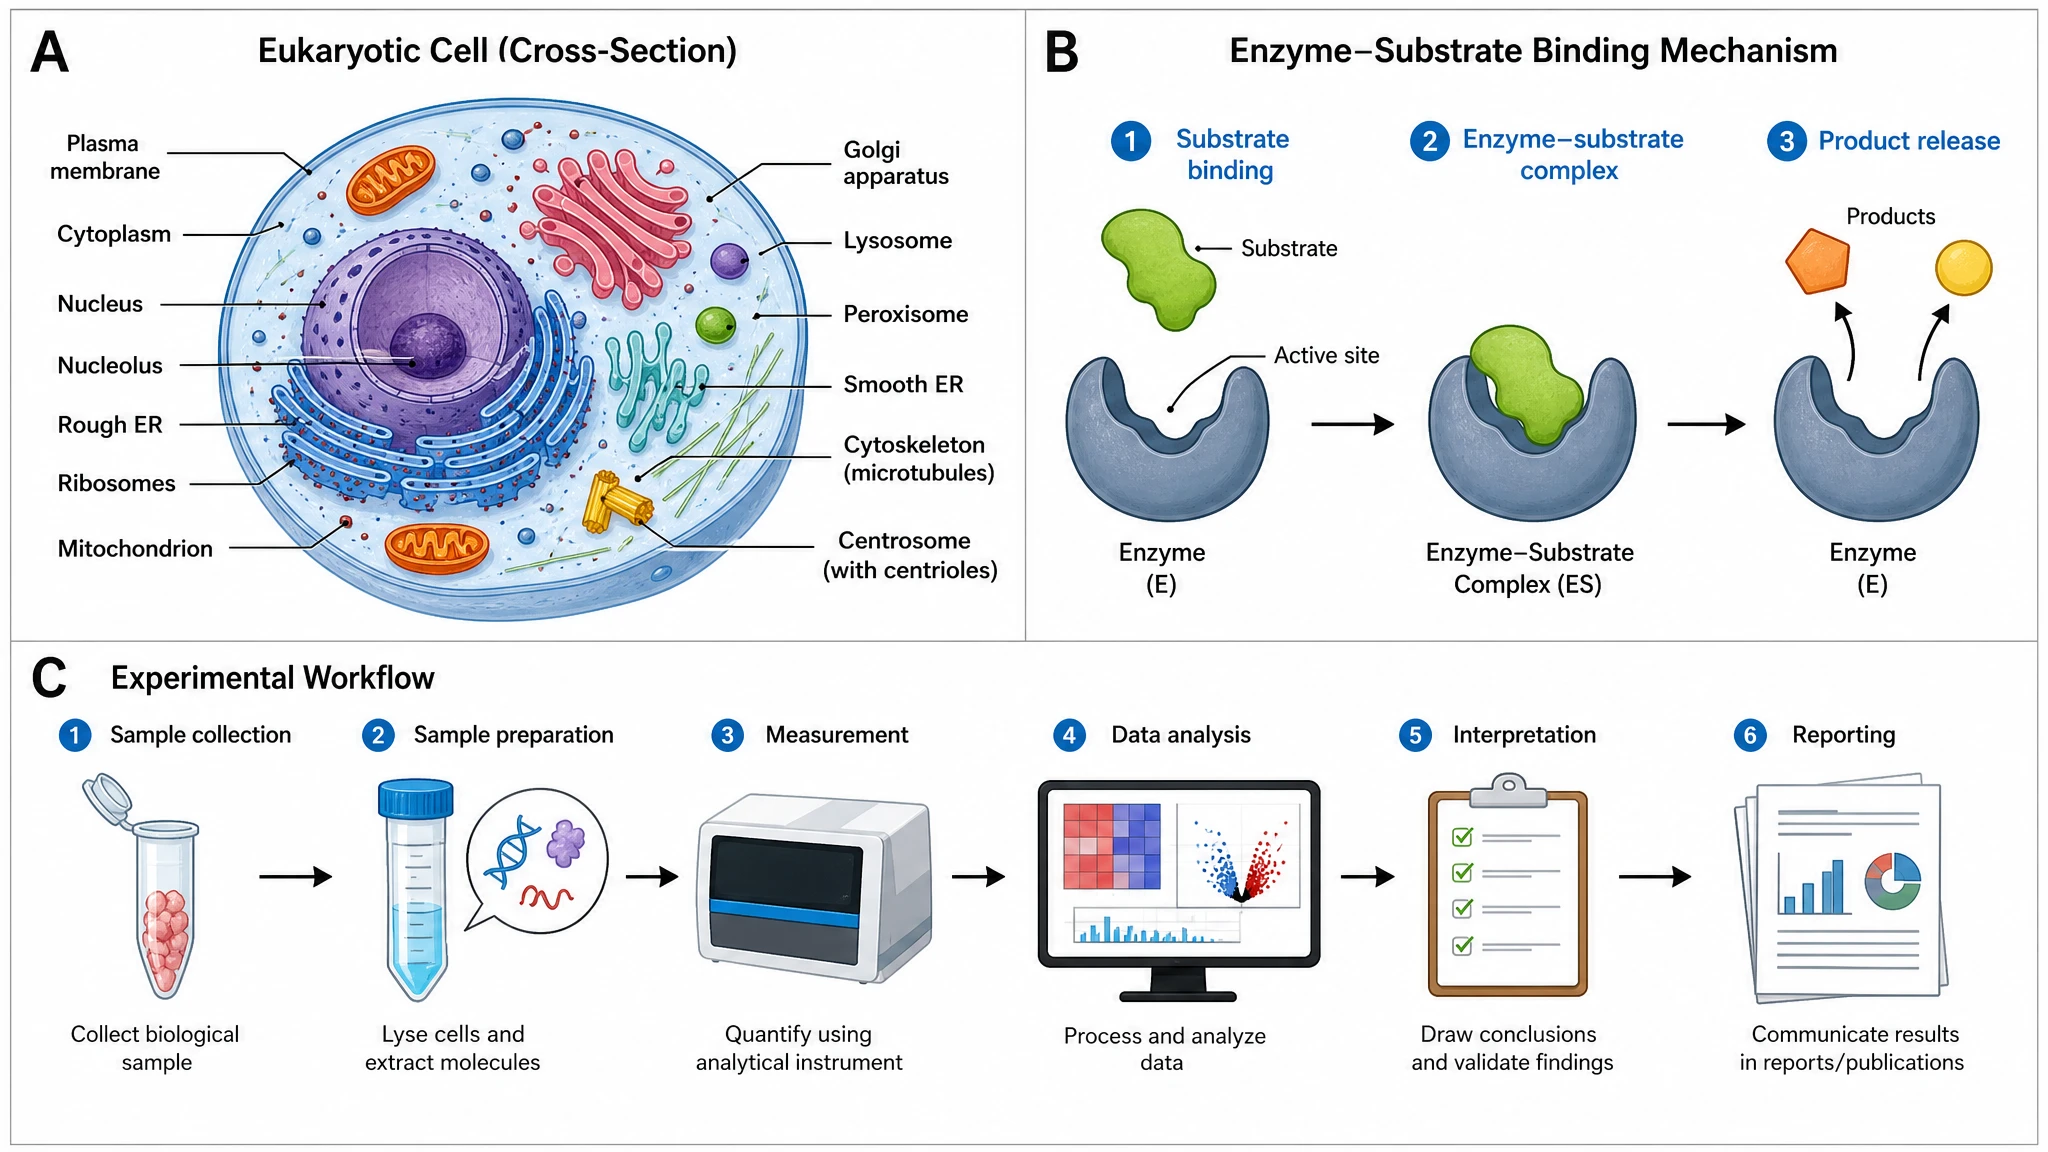 AI Scientific Image Generator
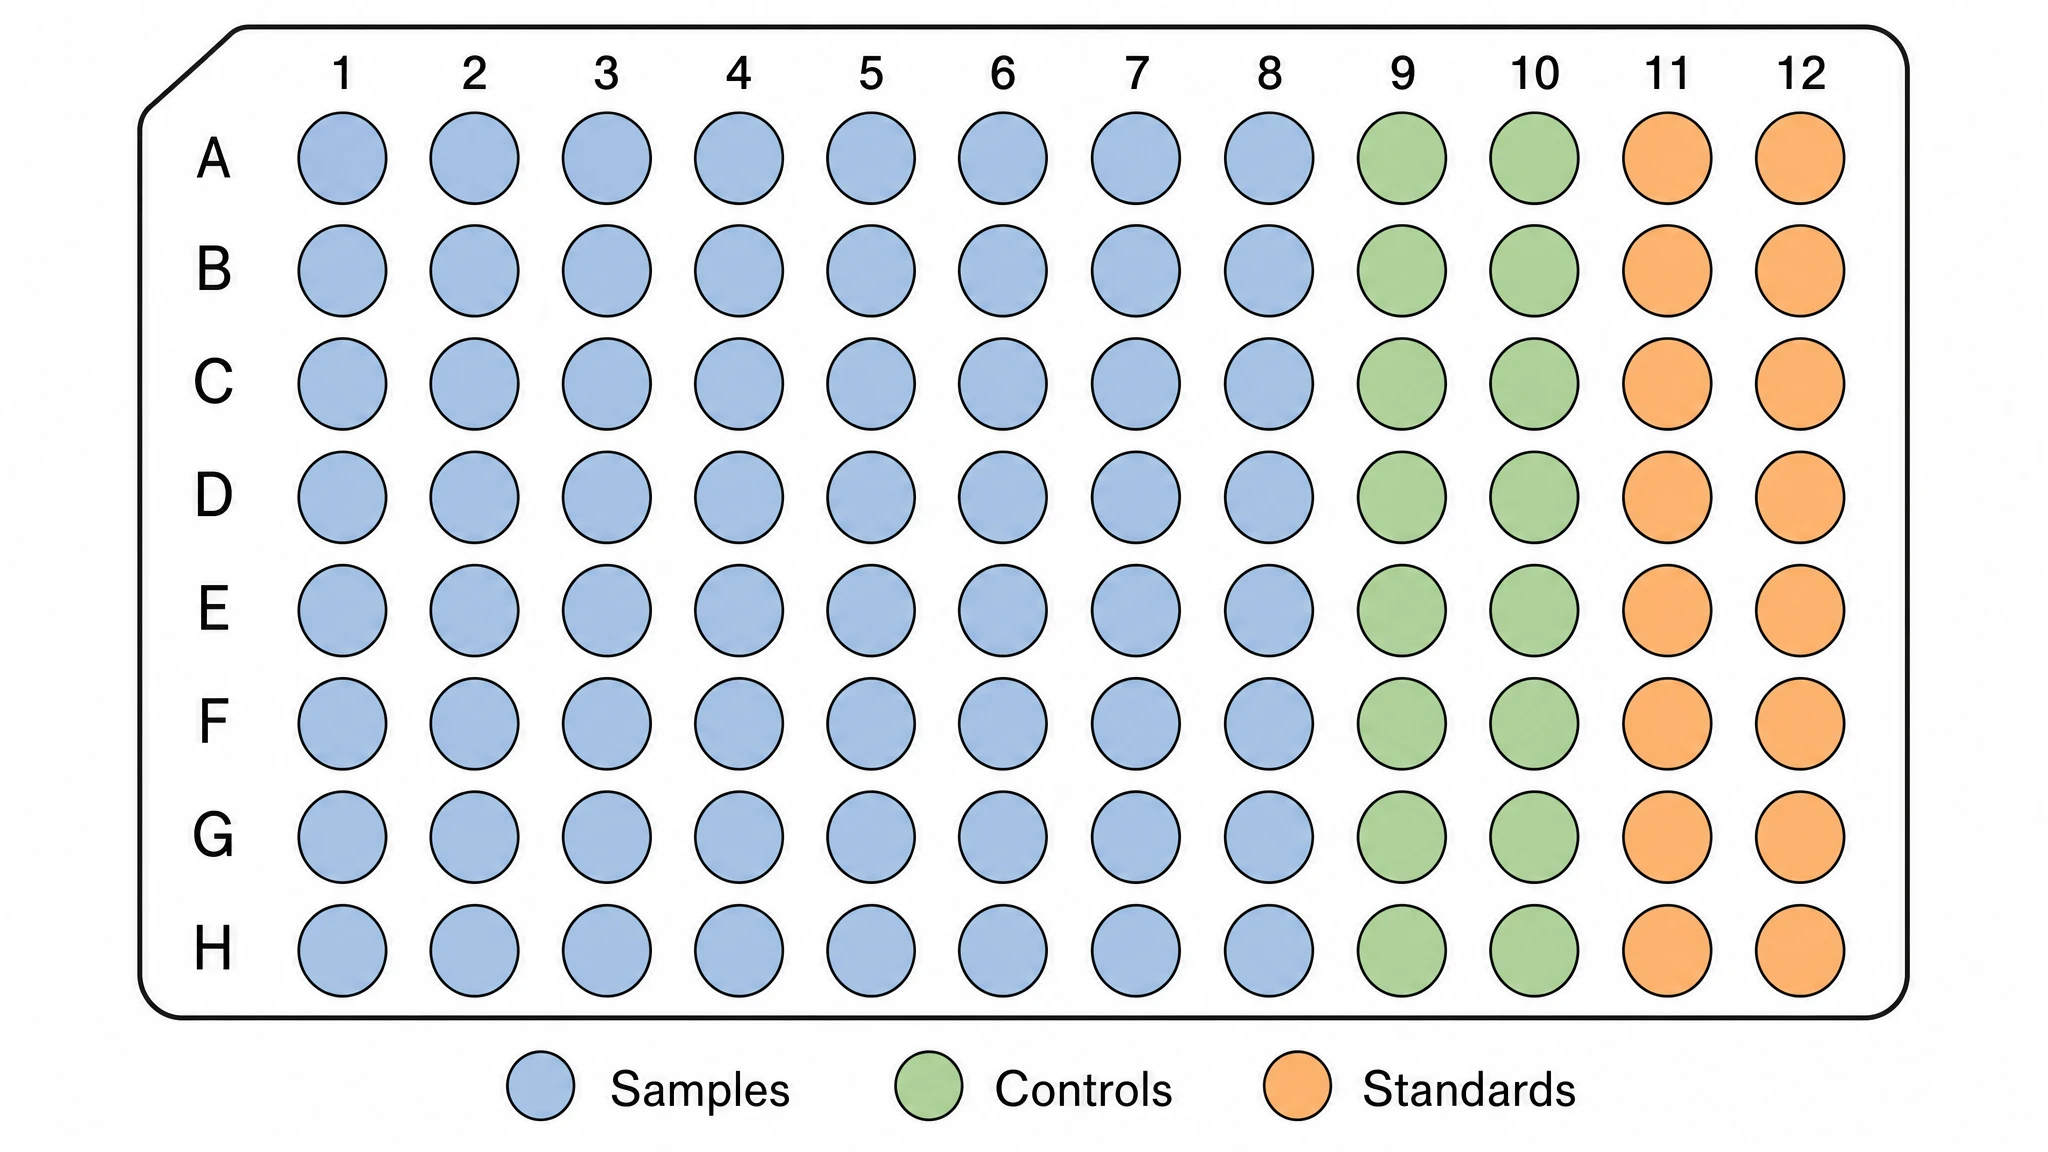 Editable 96-Well Plate
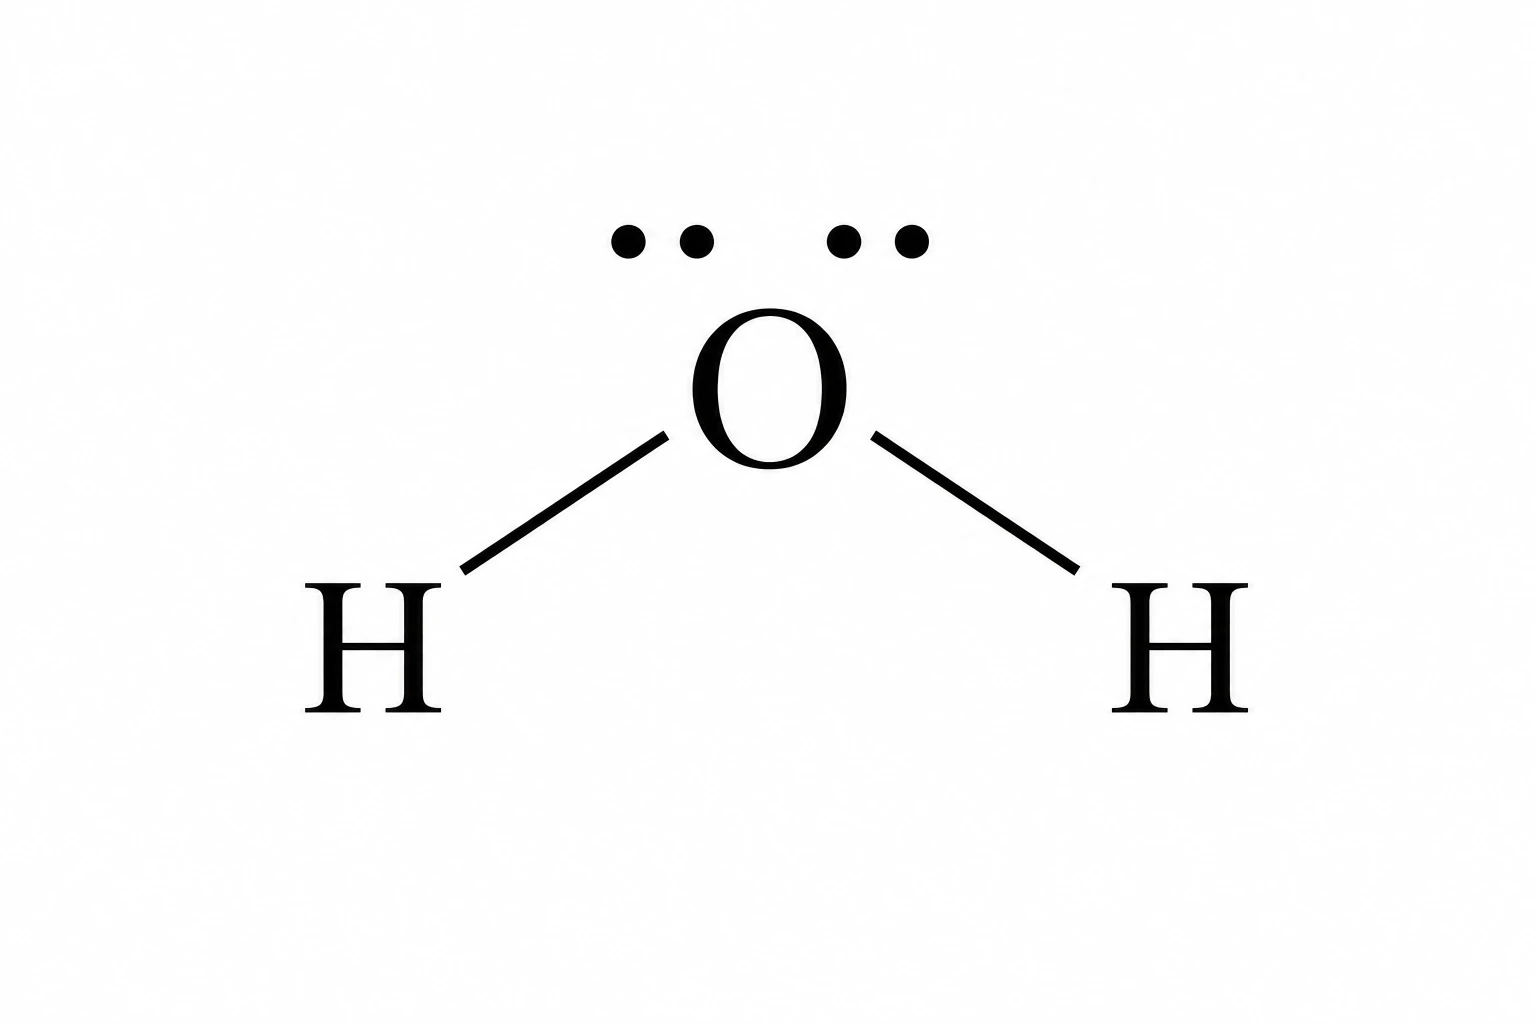 Lewis Dot Structure Generator
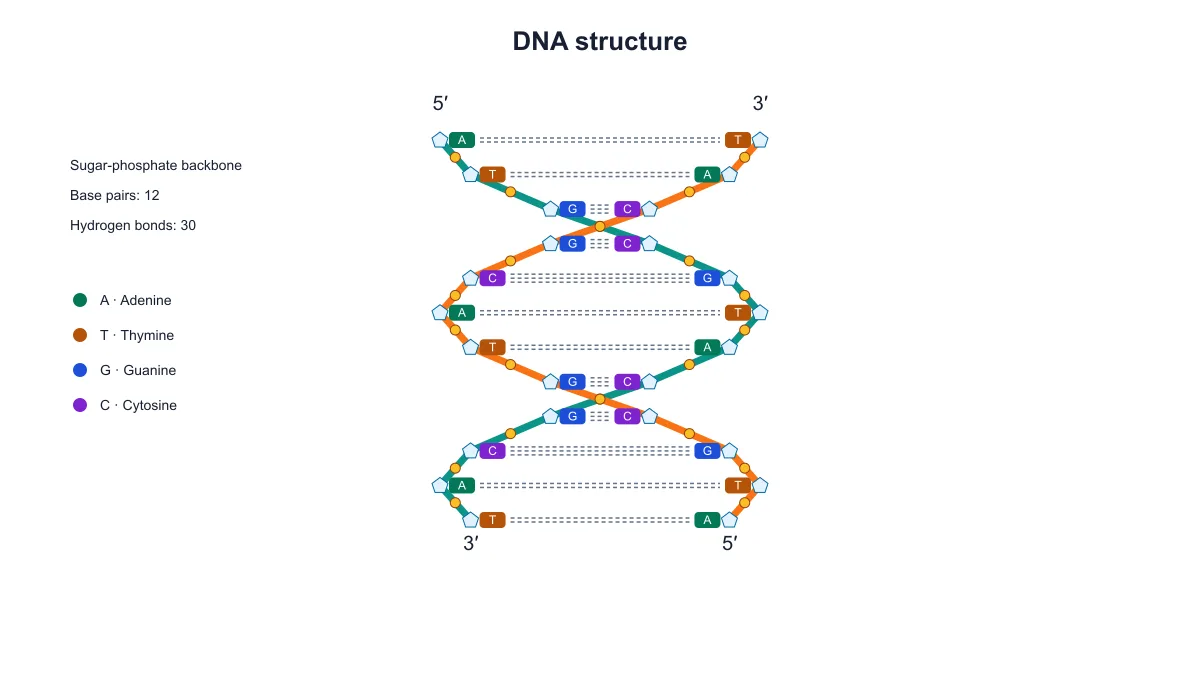 DNA Structure Diagram Generator
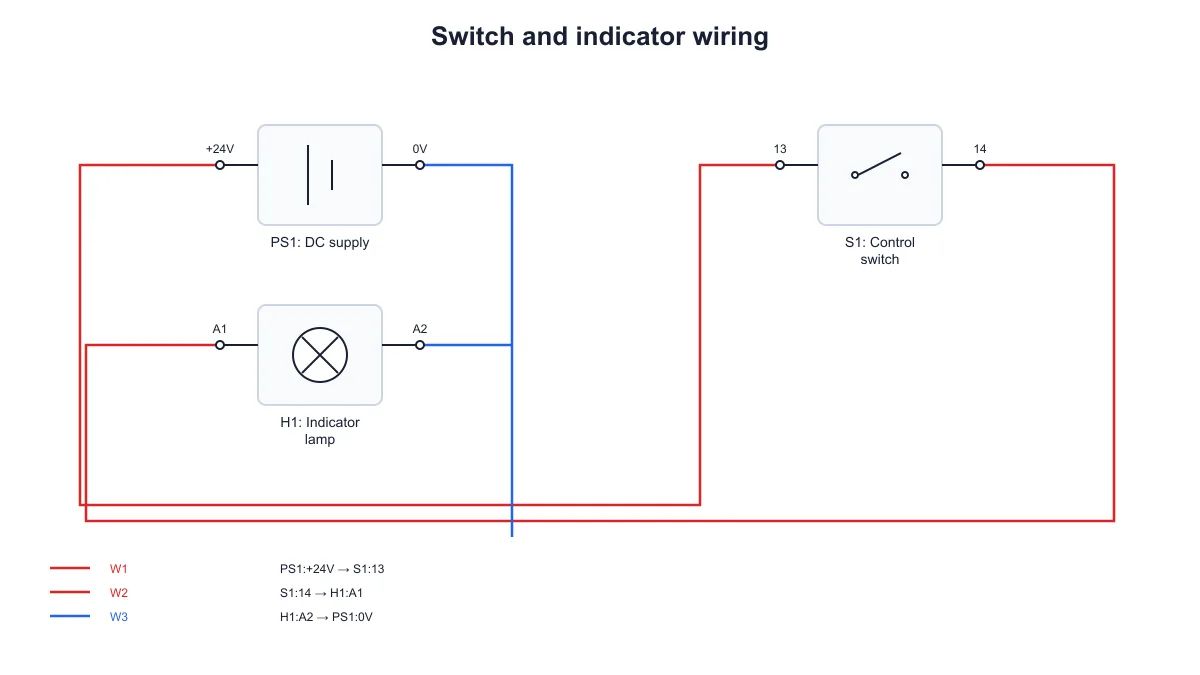 Wiring Diagram Maker
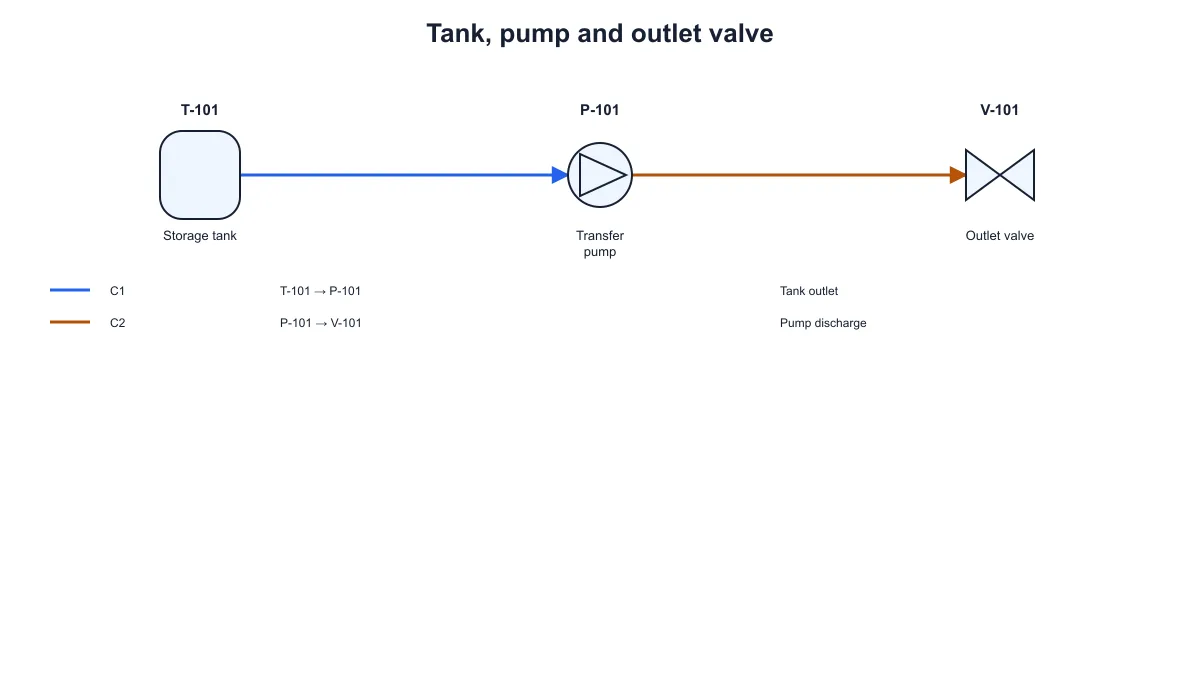 P&ID Diagram Generator
 Scientific Poster Generator
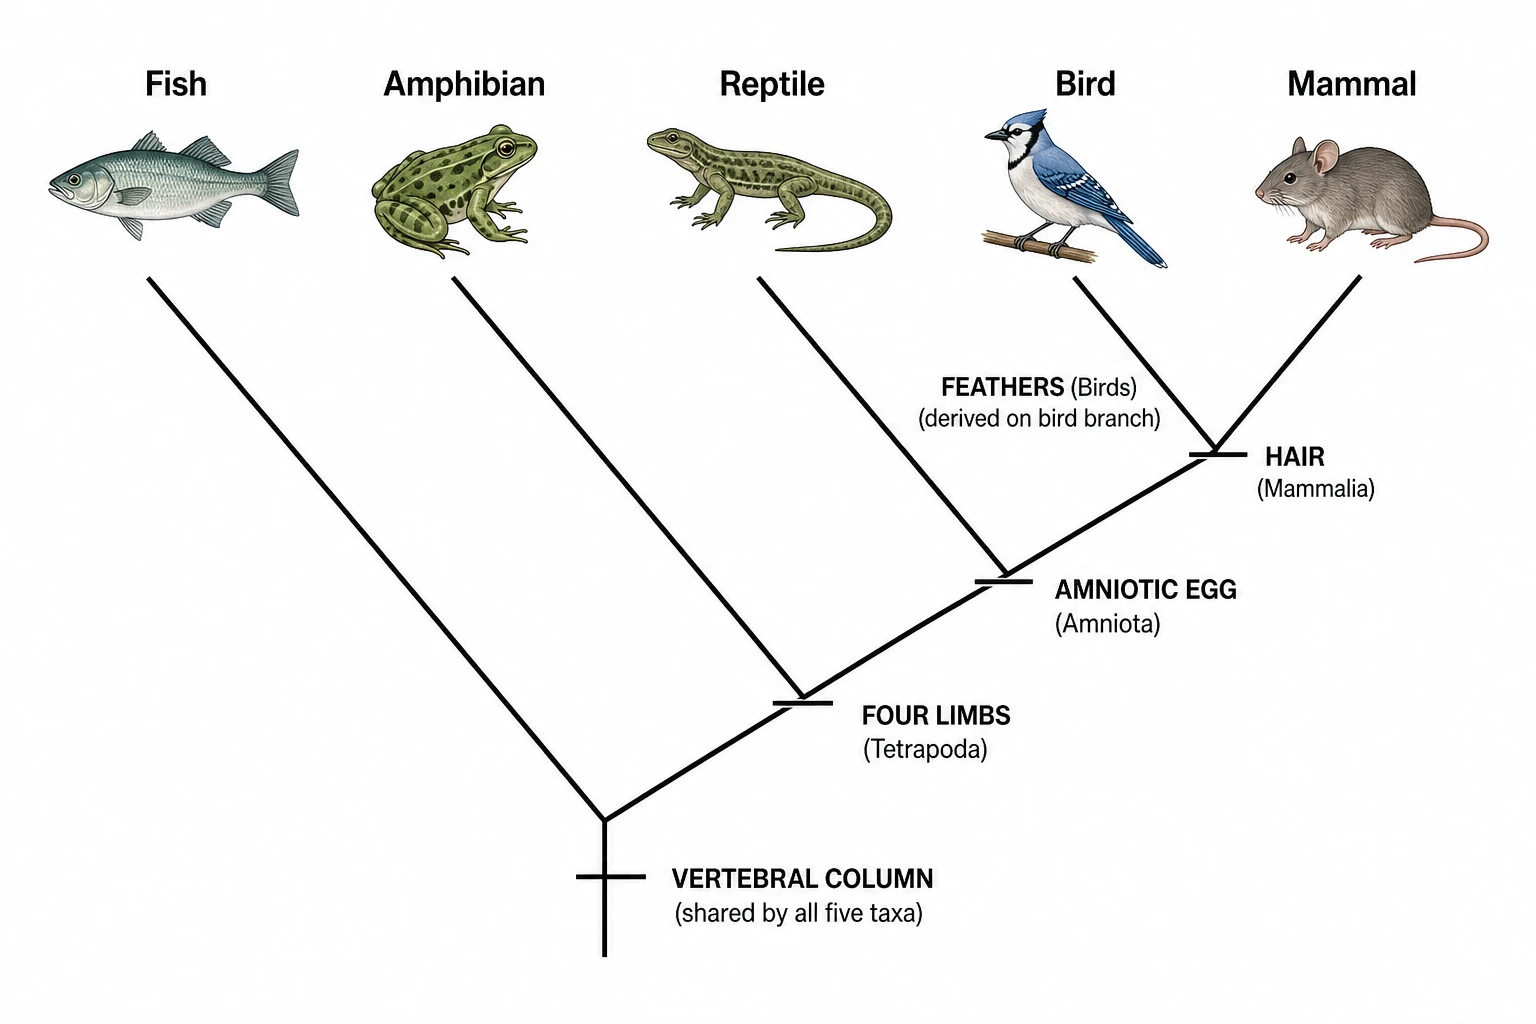 Cladogram Maker
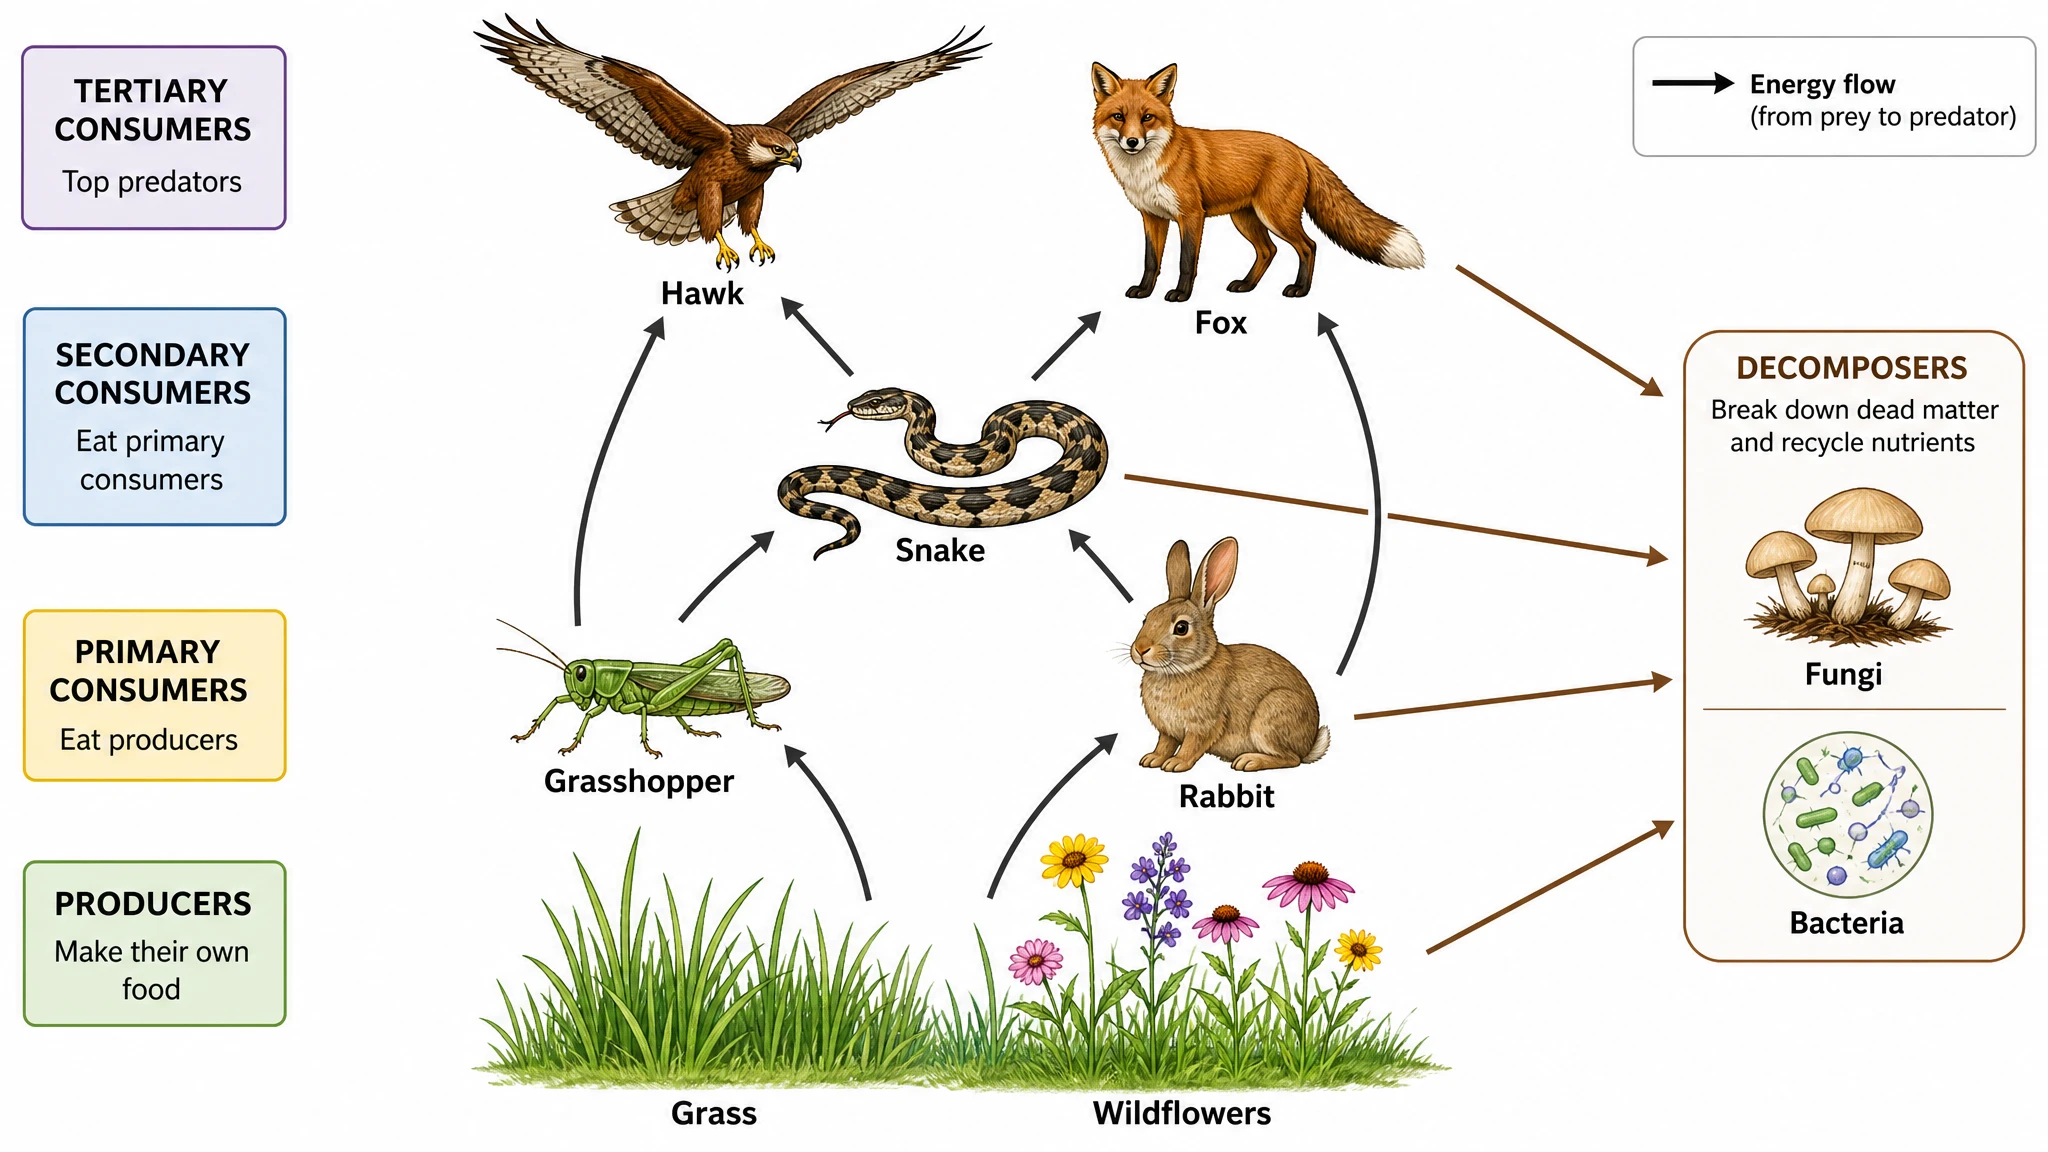 Food Web Maker
 Medical Illustration Generator
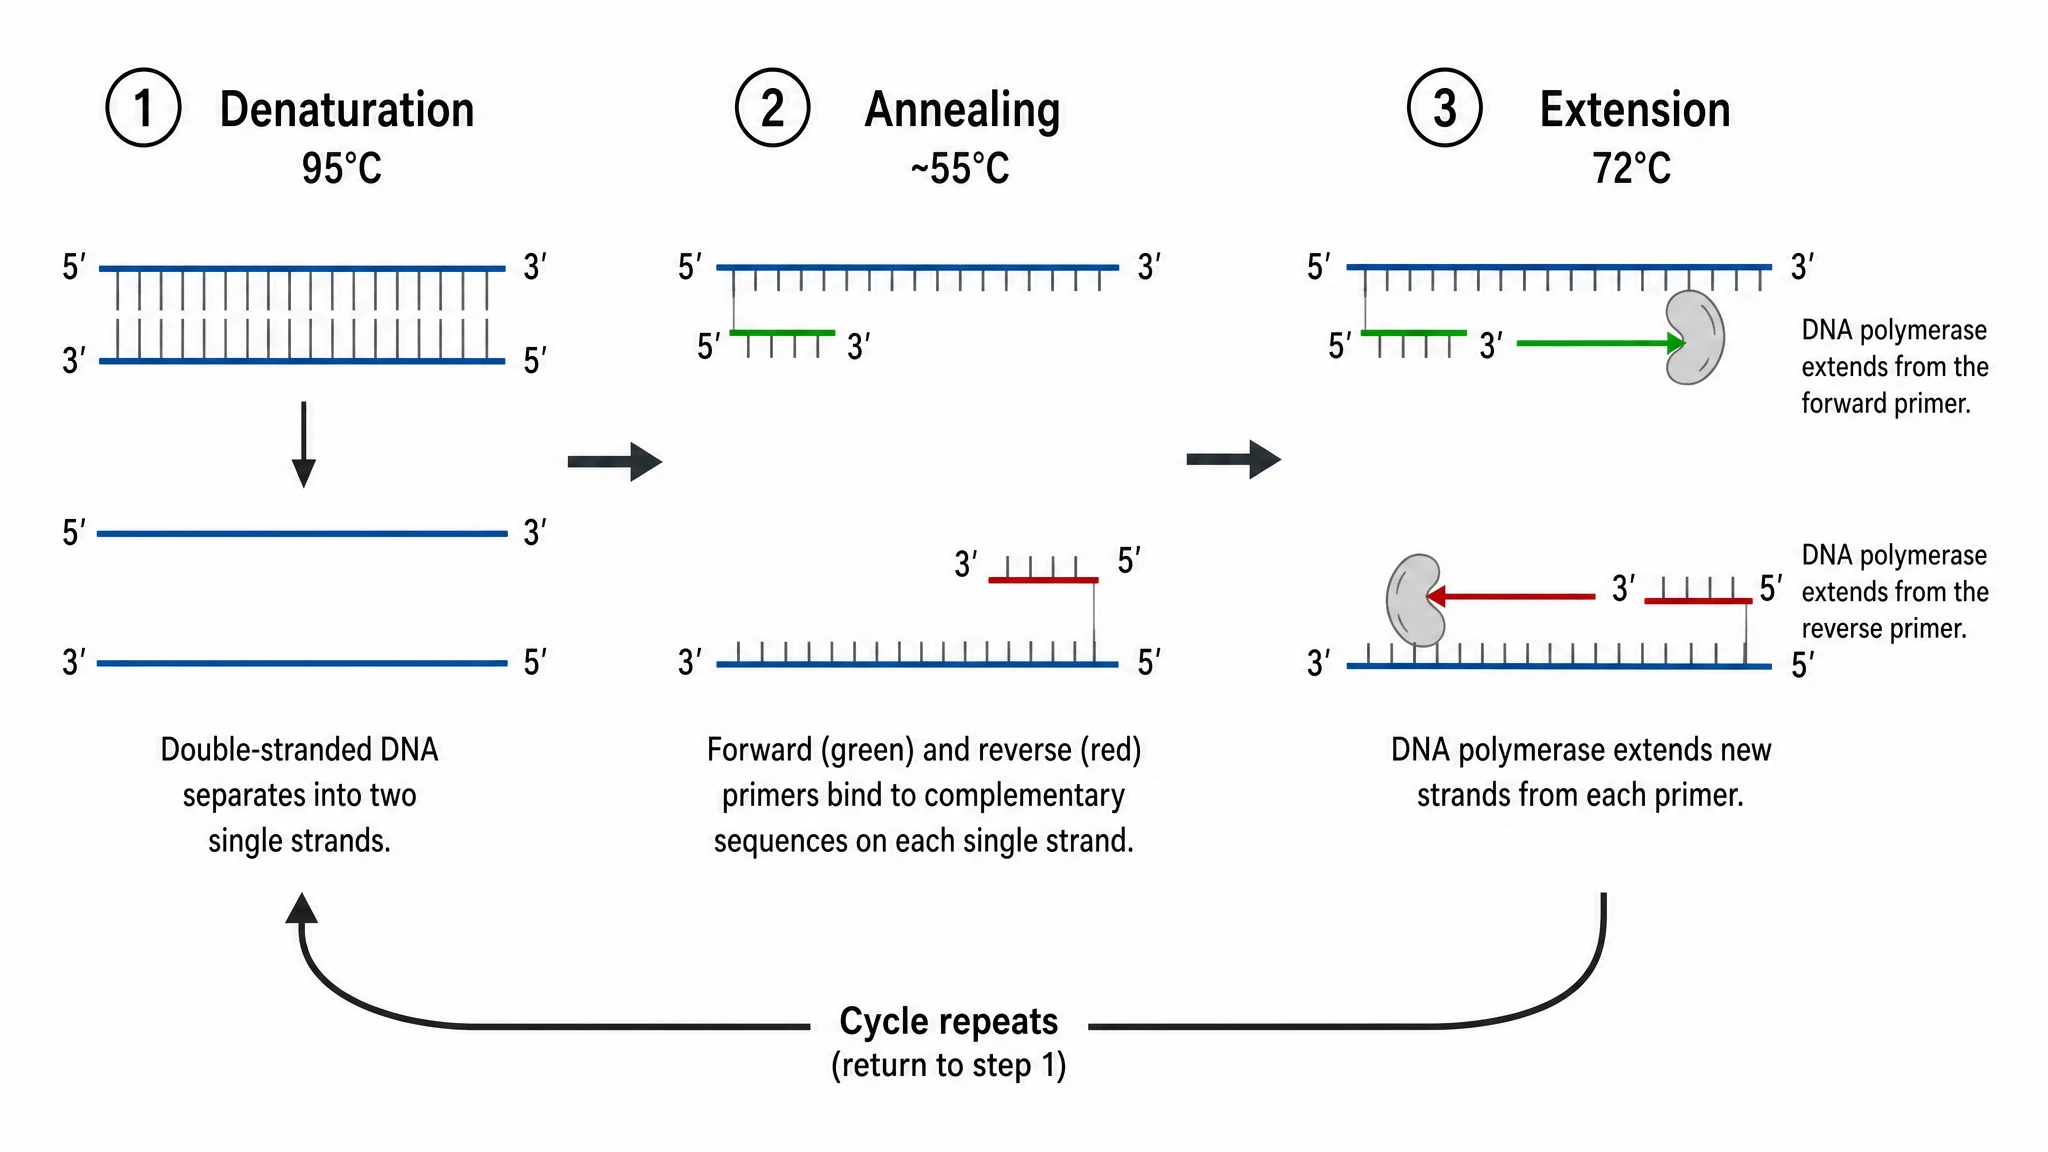 PCR Diagram Generator
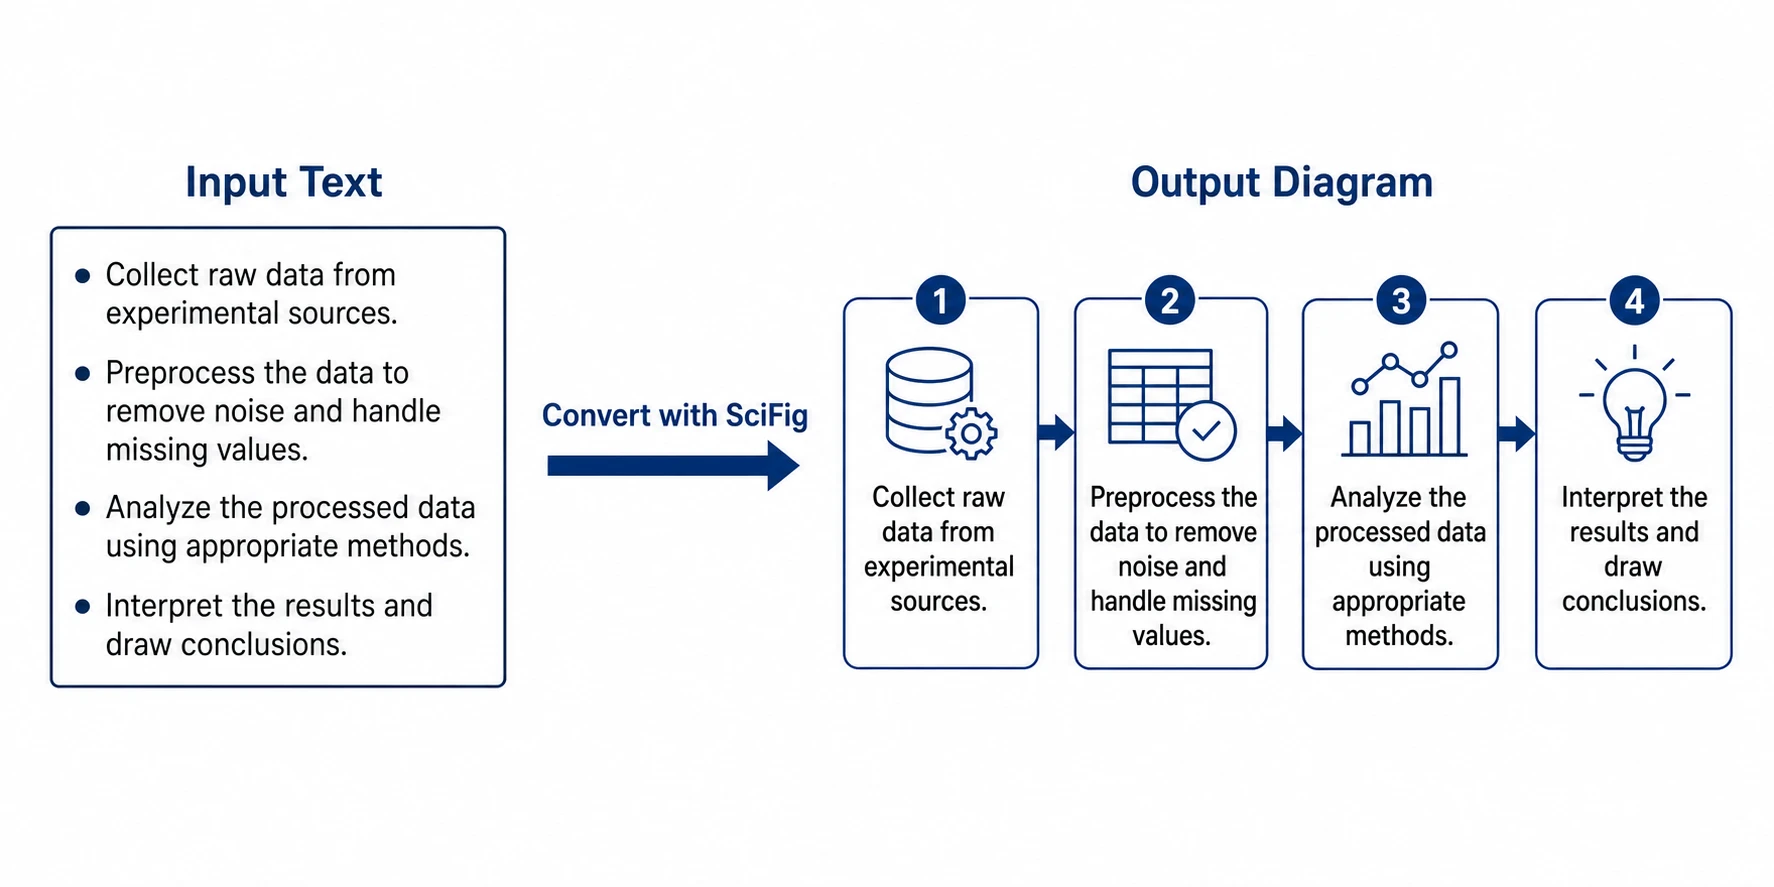 PPT Text to Visual Converter
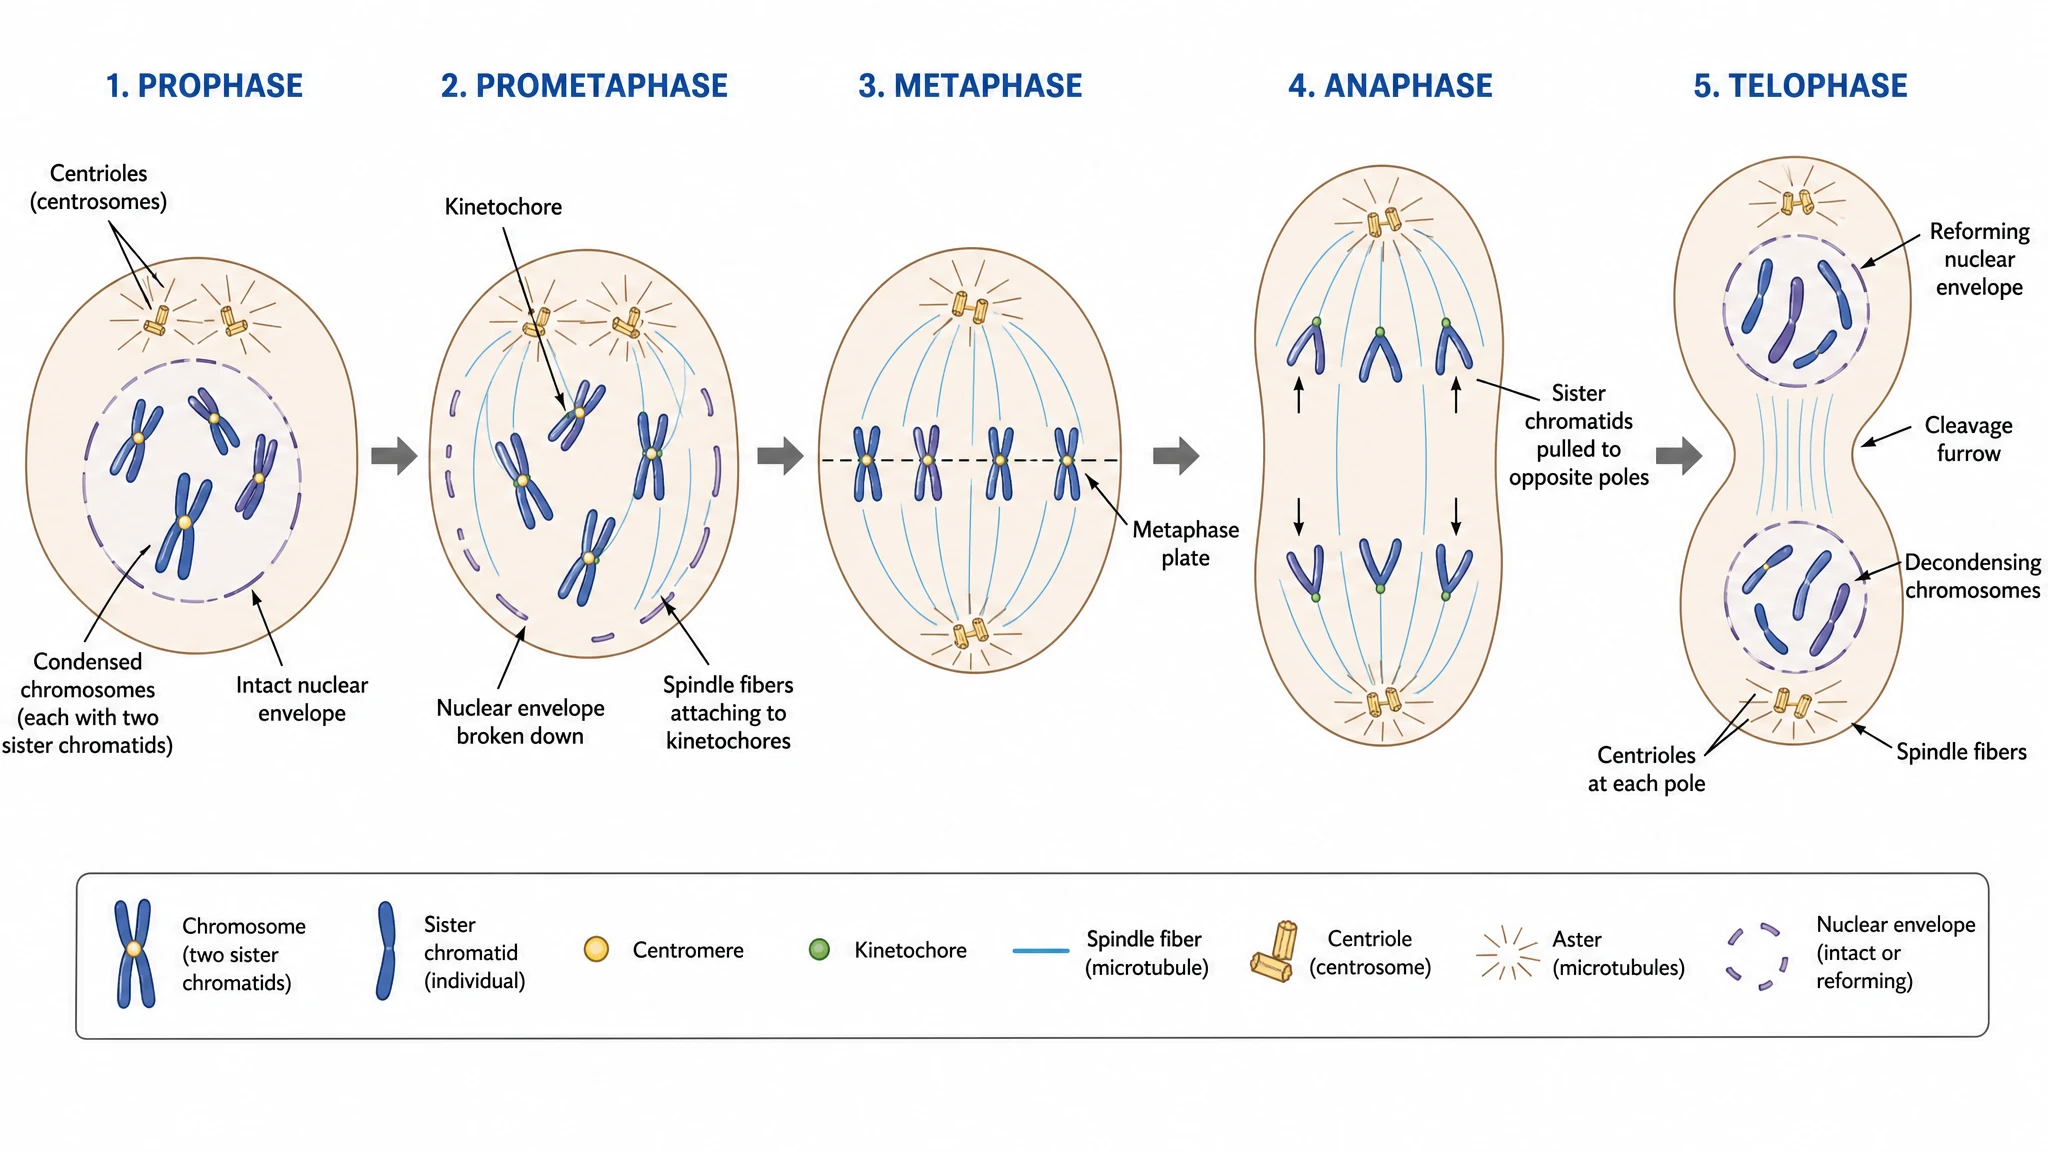 Mitosis Diagram Generator
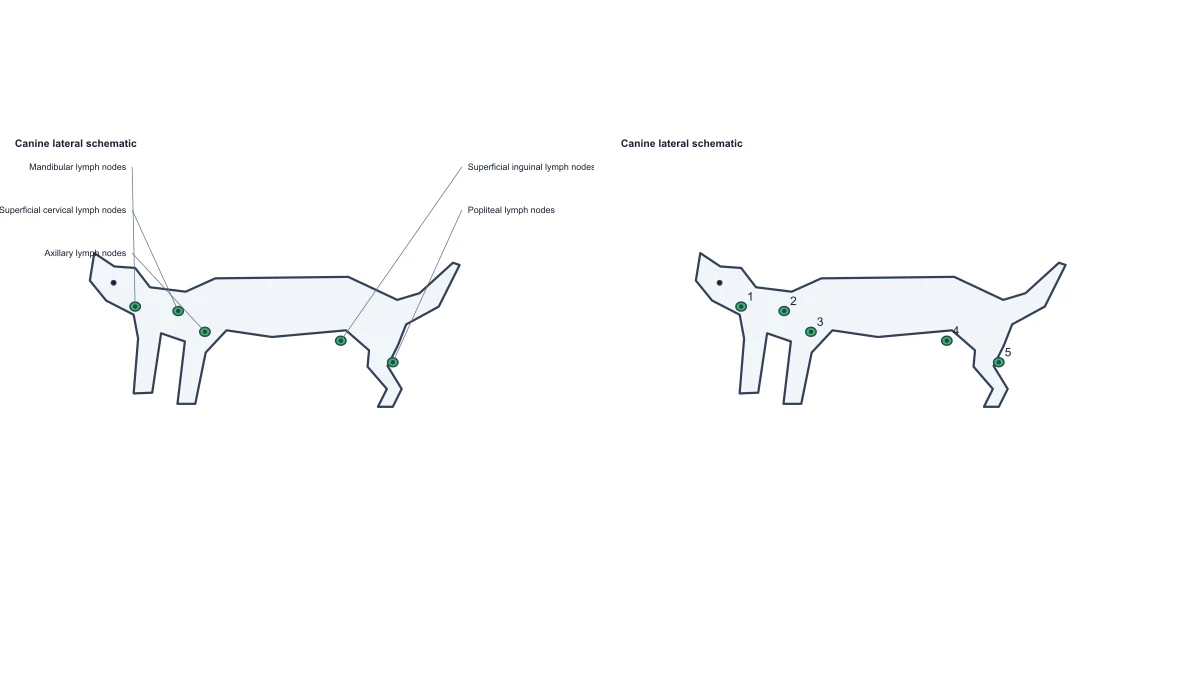 Dog Lymph Nodes Diagram — Free Label Editor
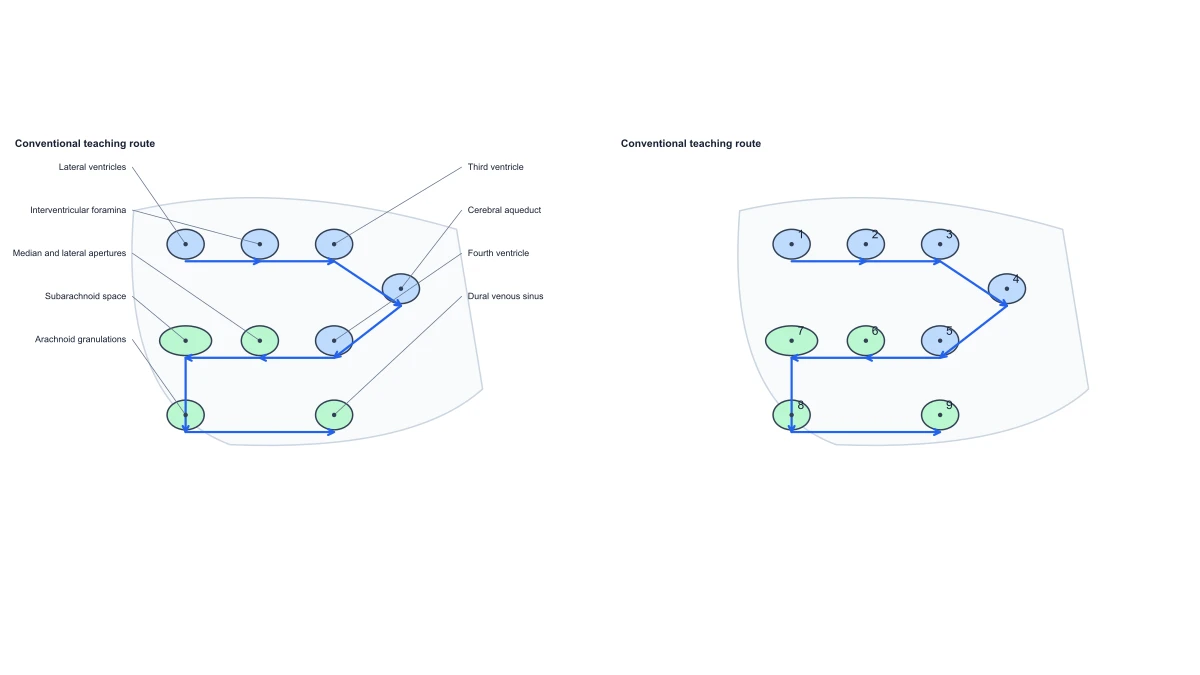 Flow of Cerebrospinal Fluid — Free Diagram Editor
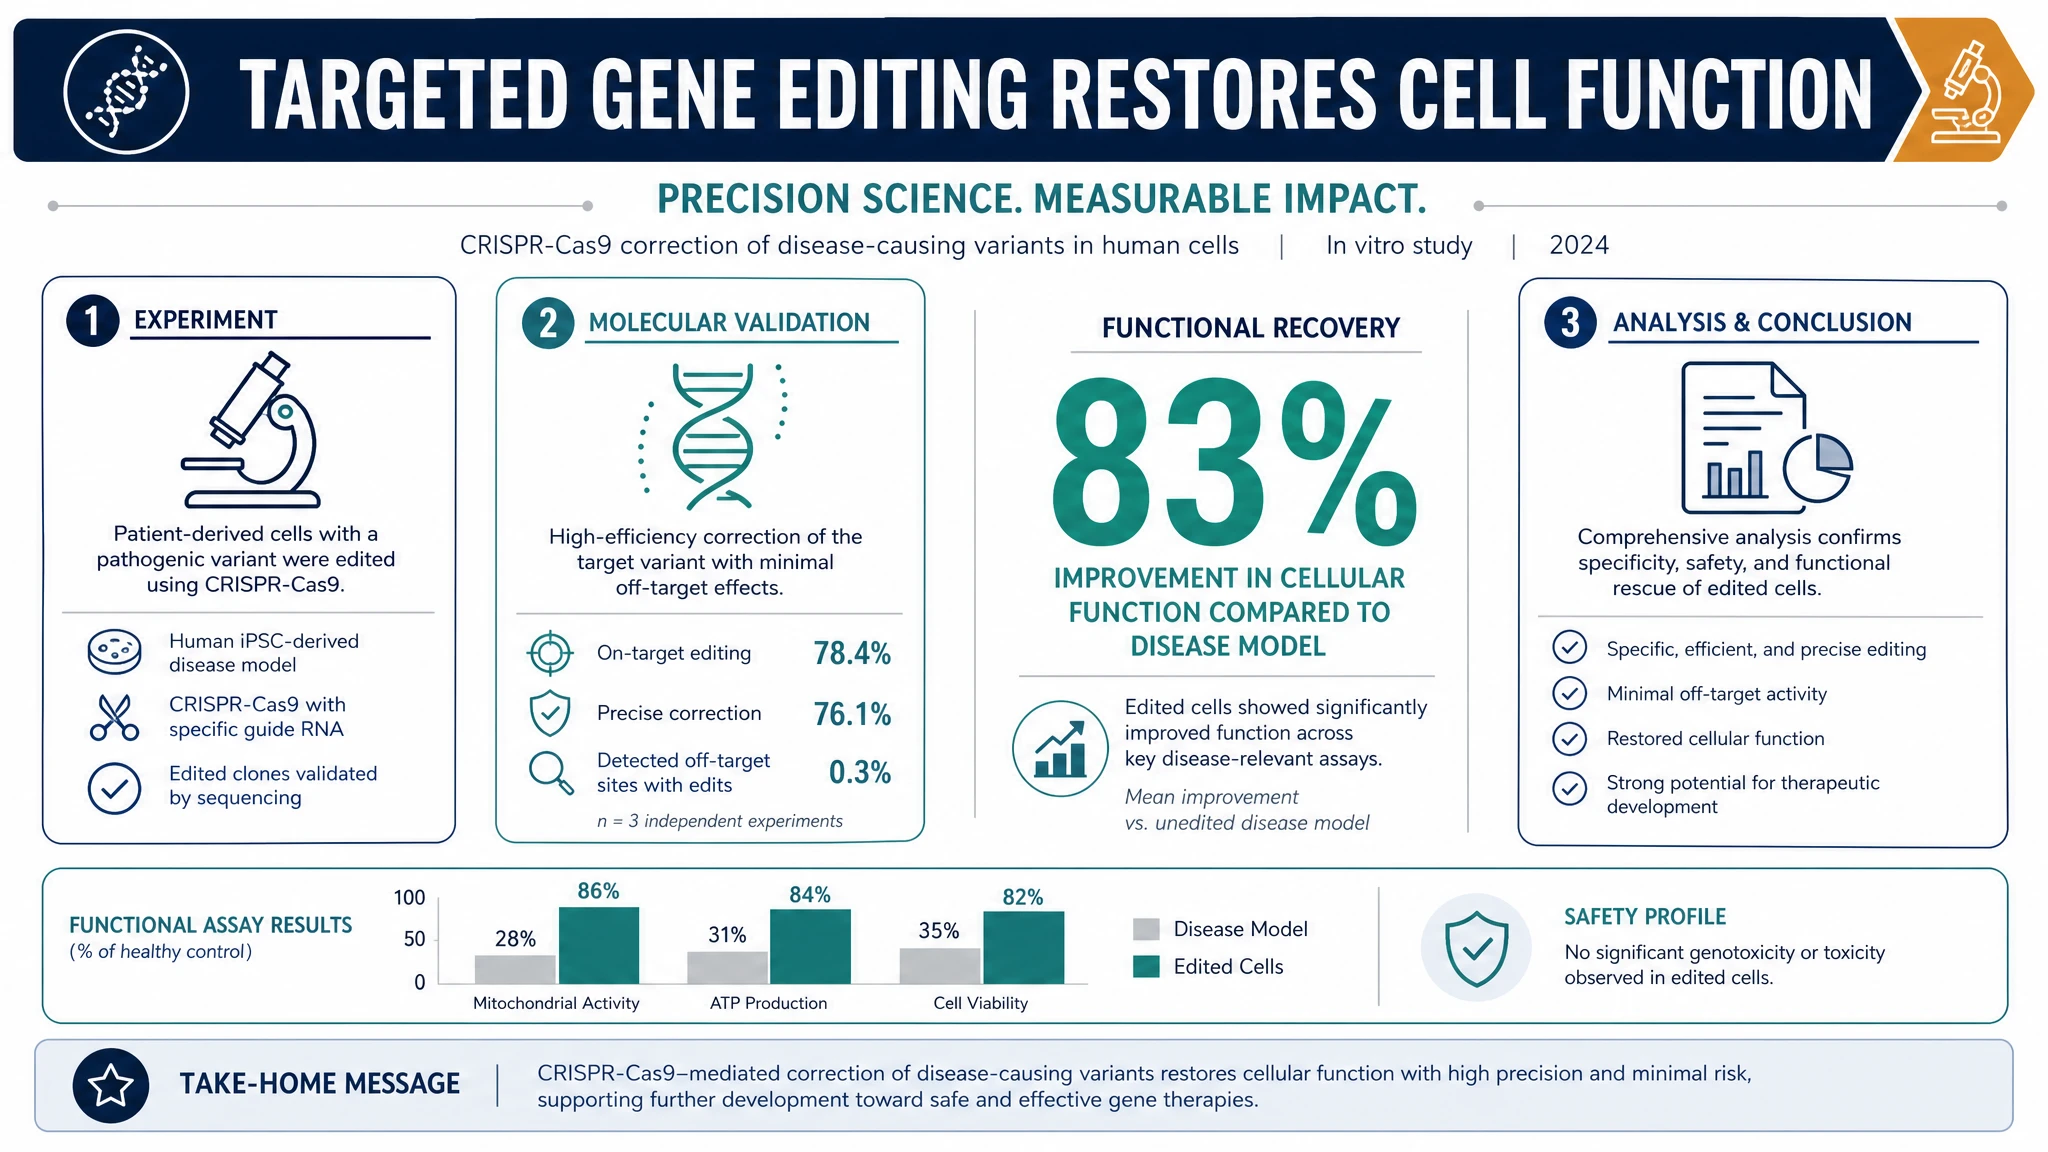 AI Infographic Generator
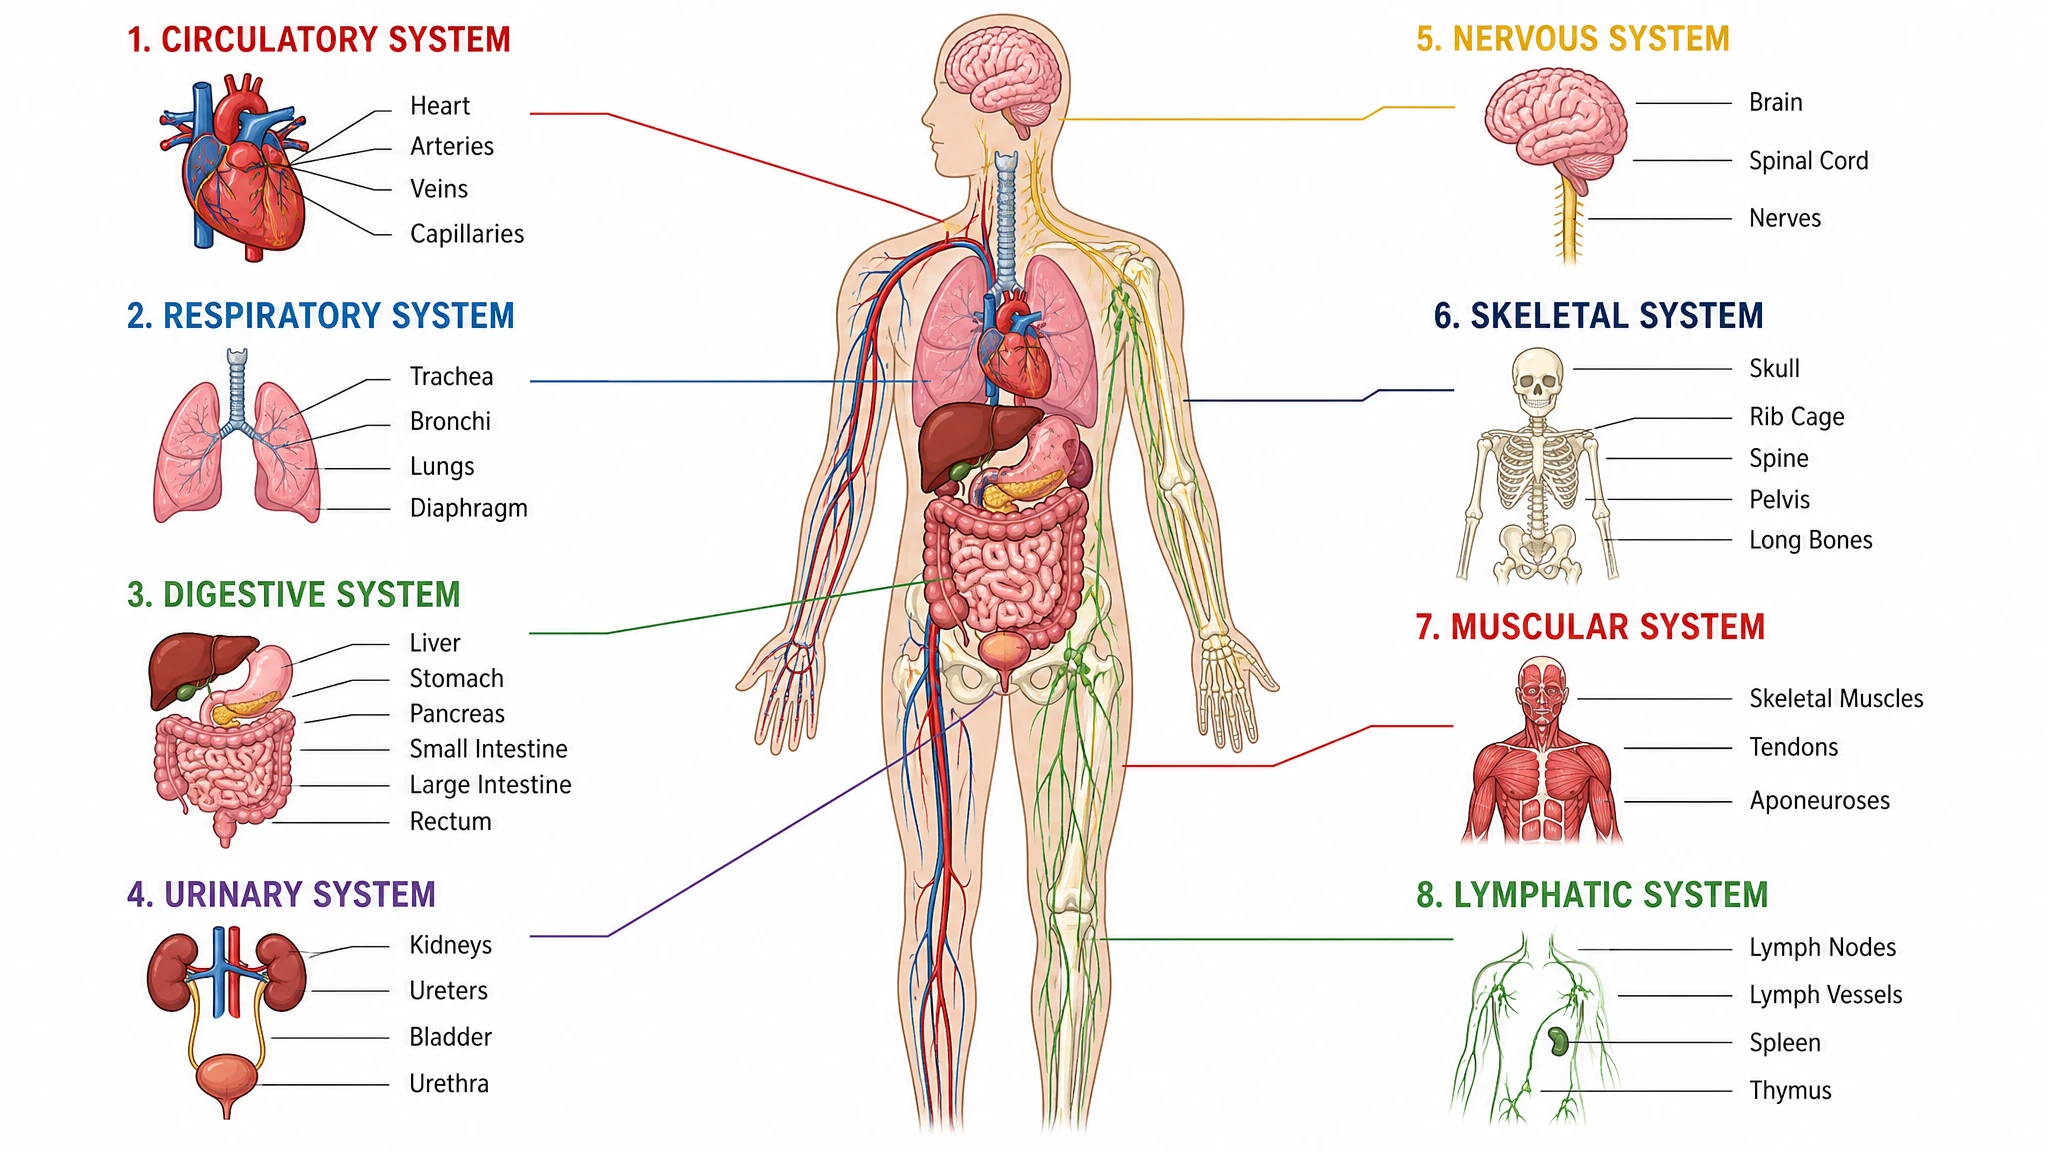 Anatomical Drawing Generator
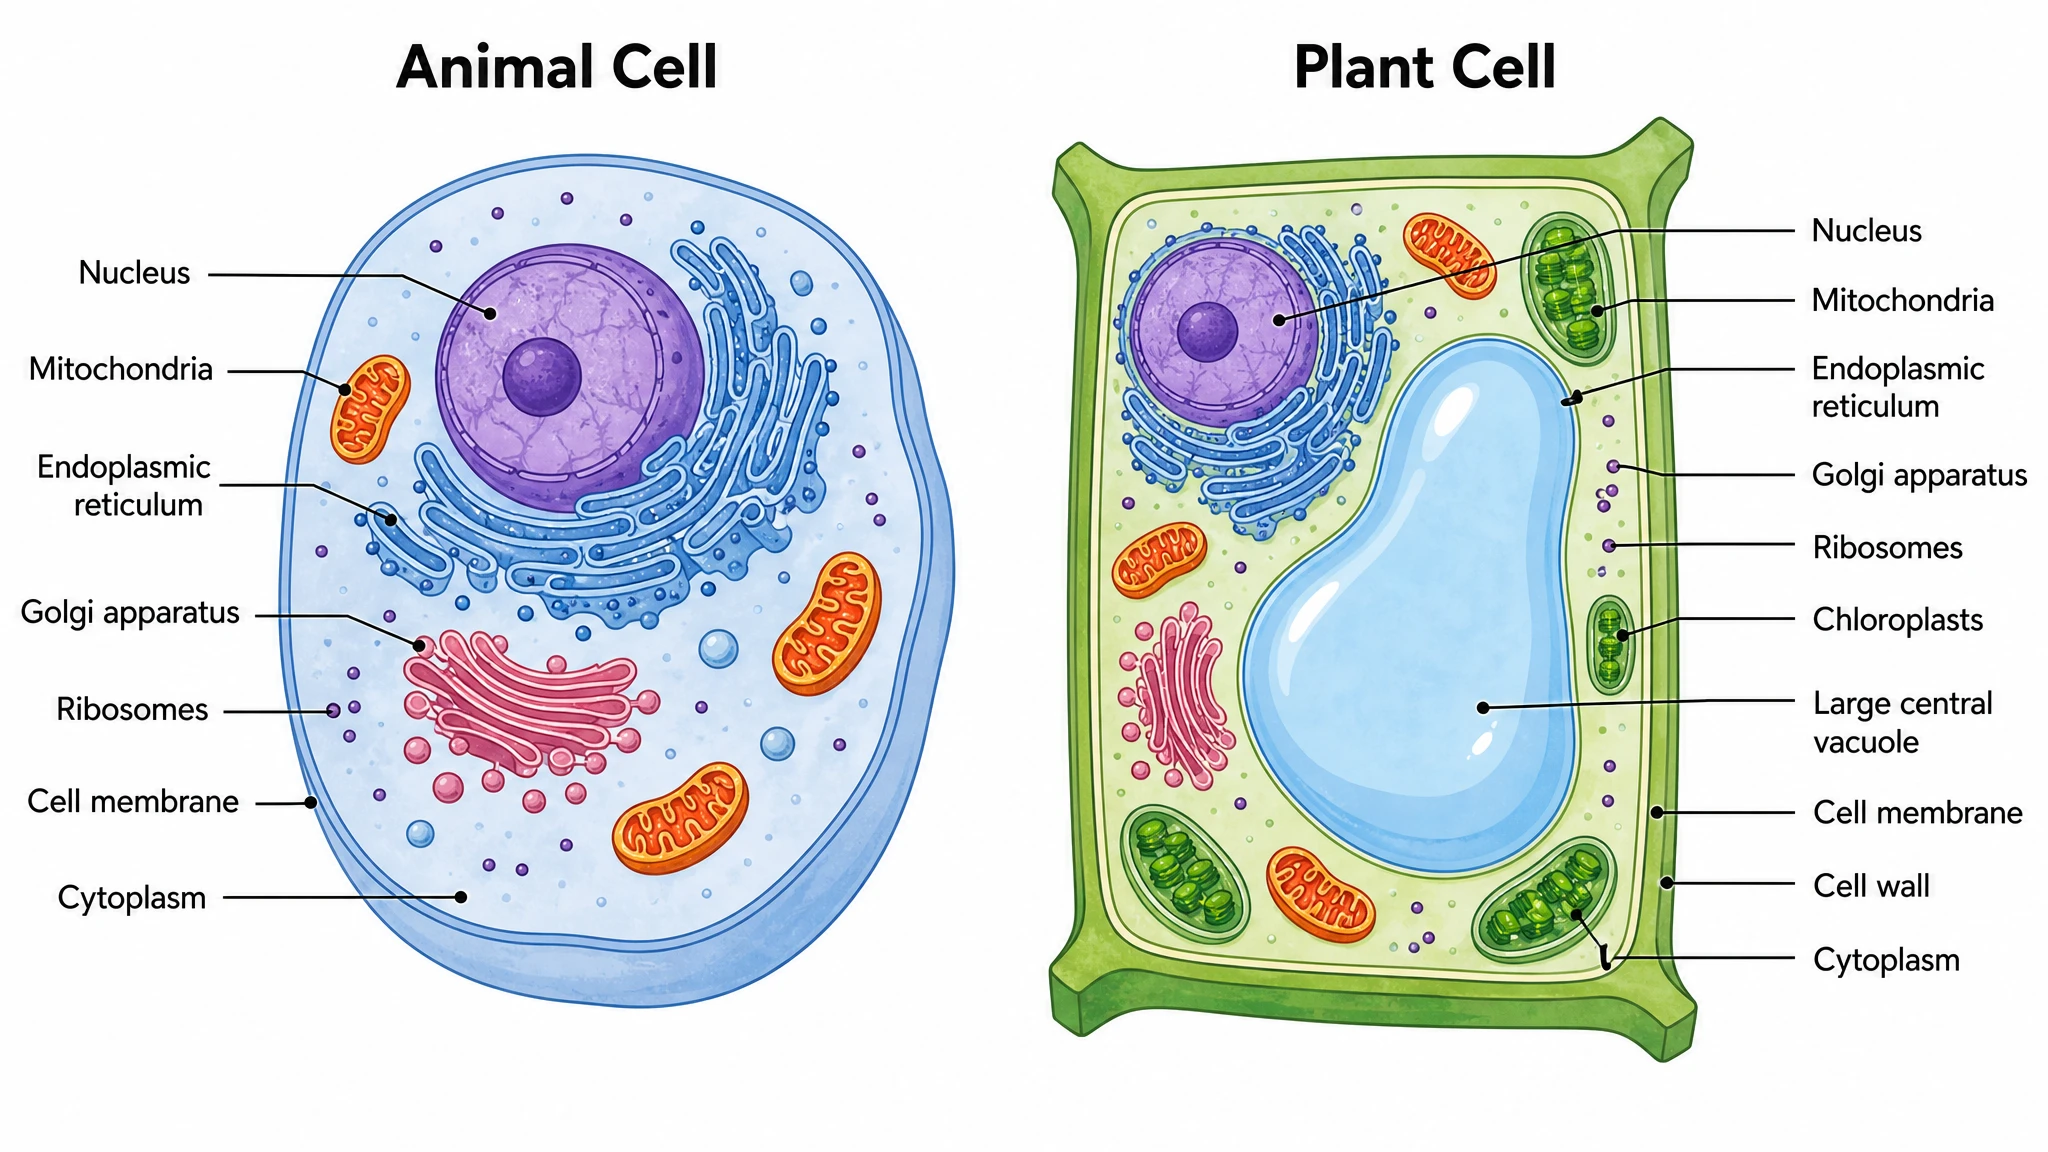 Animal and Plant Cell Comparison
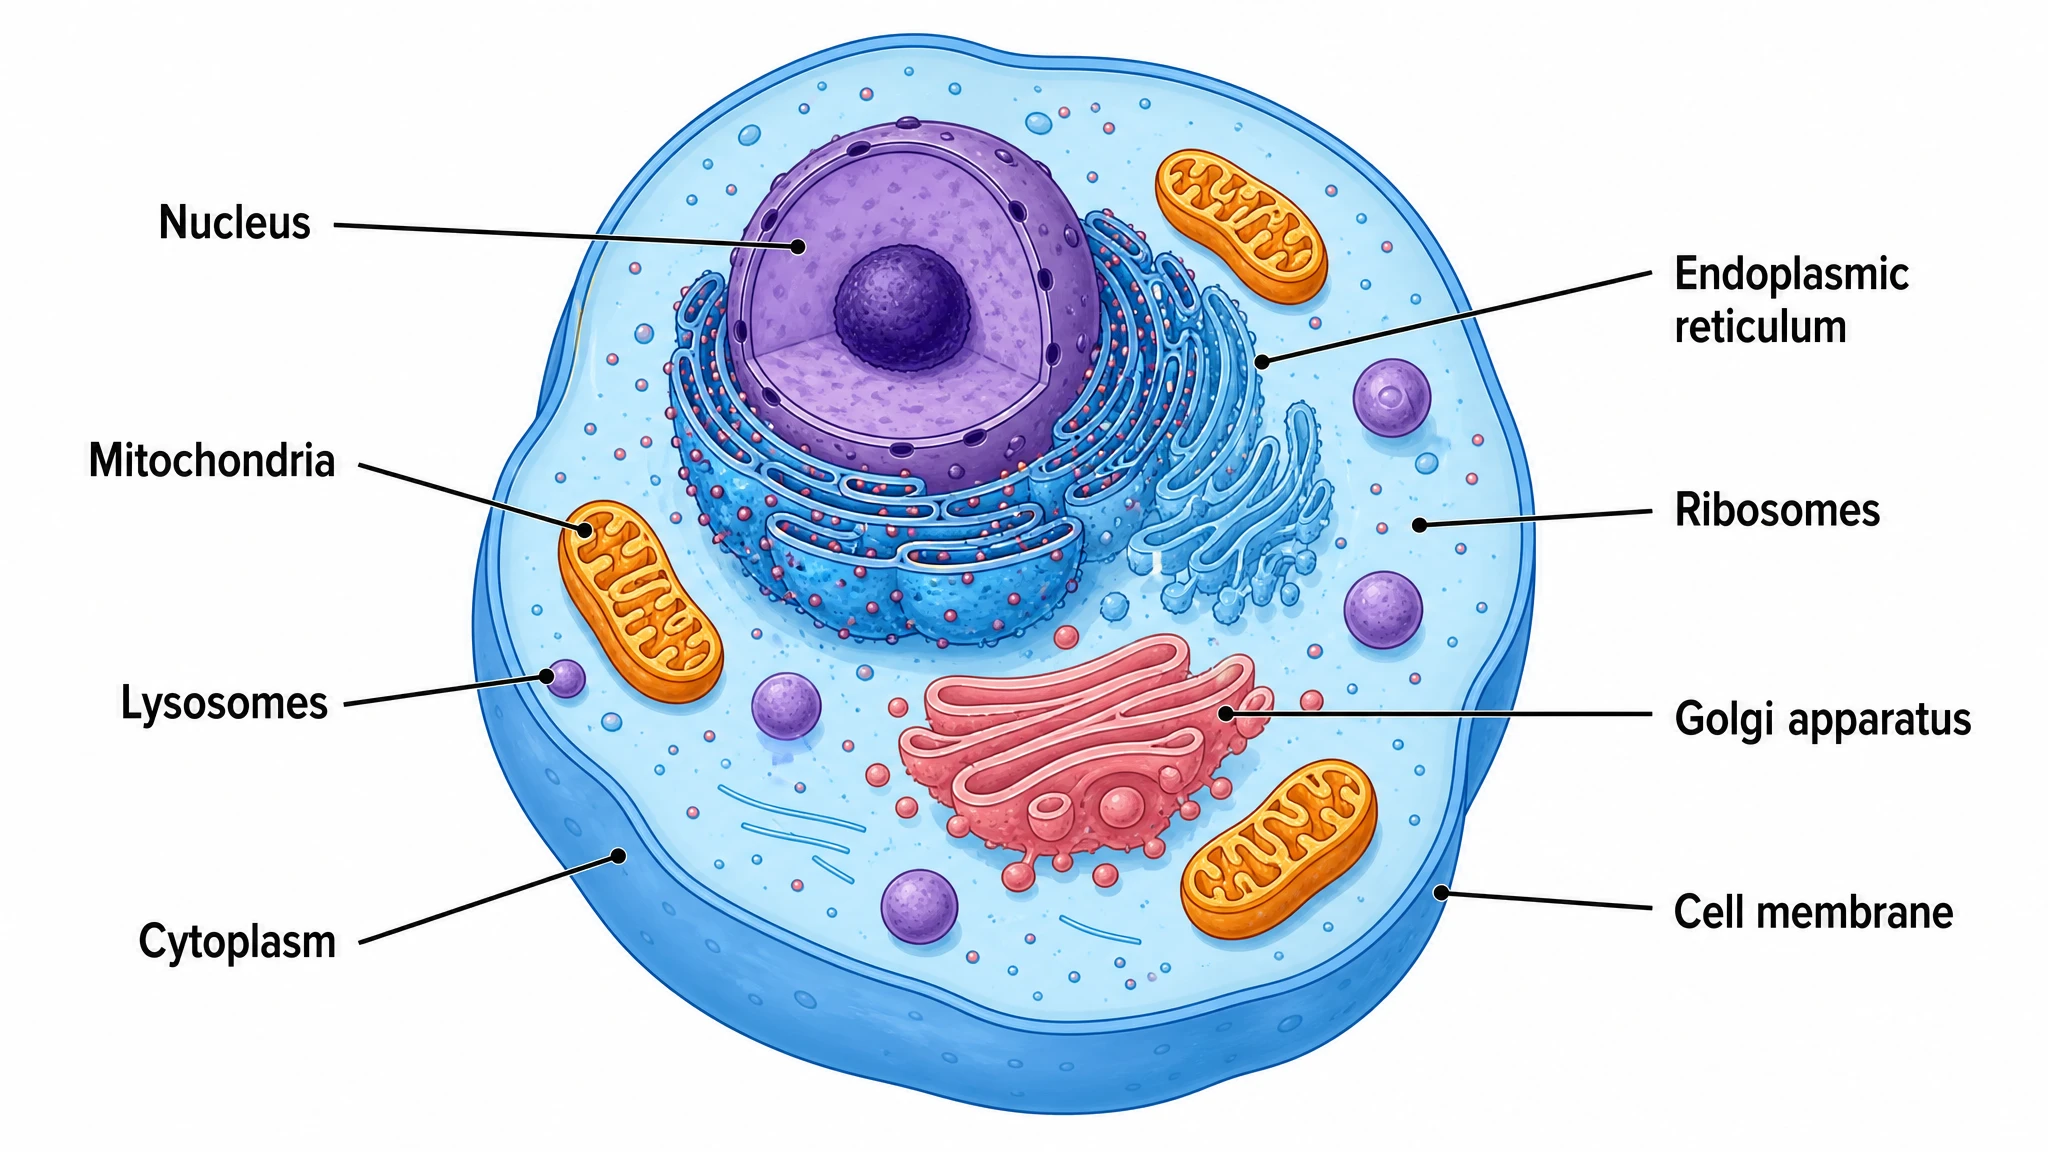 Animal Cell Diagram Generator
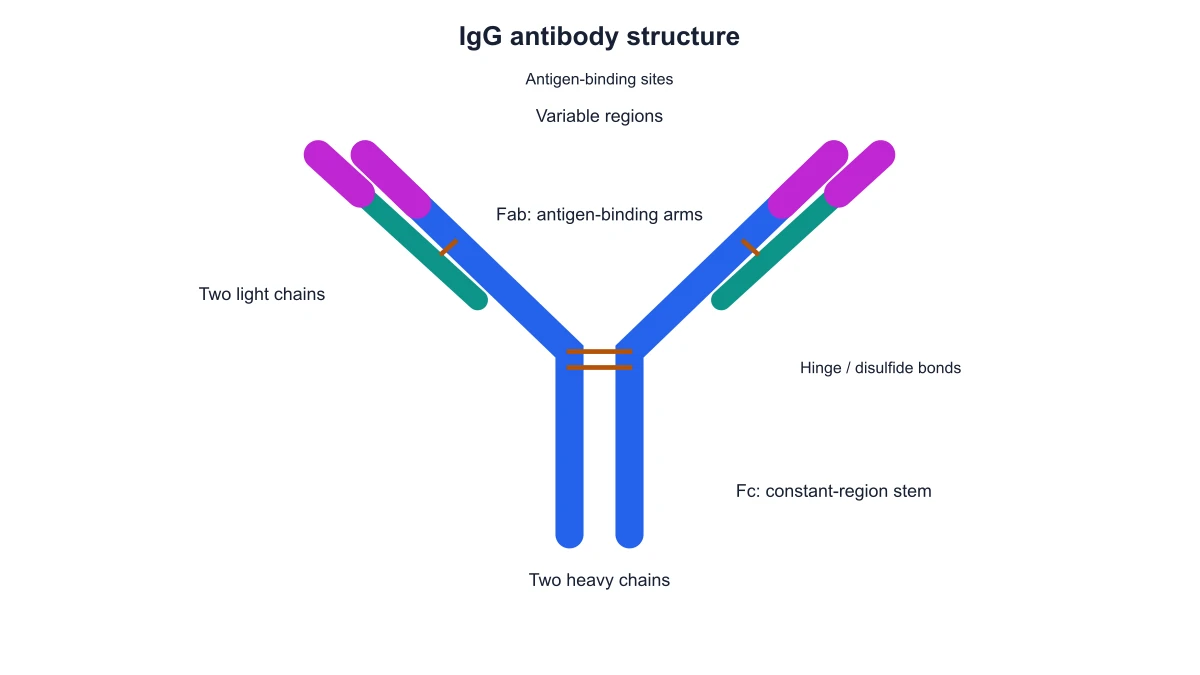 Antibody Structure Diagram Generator
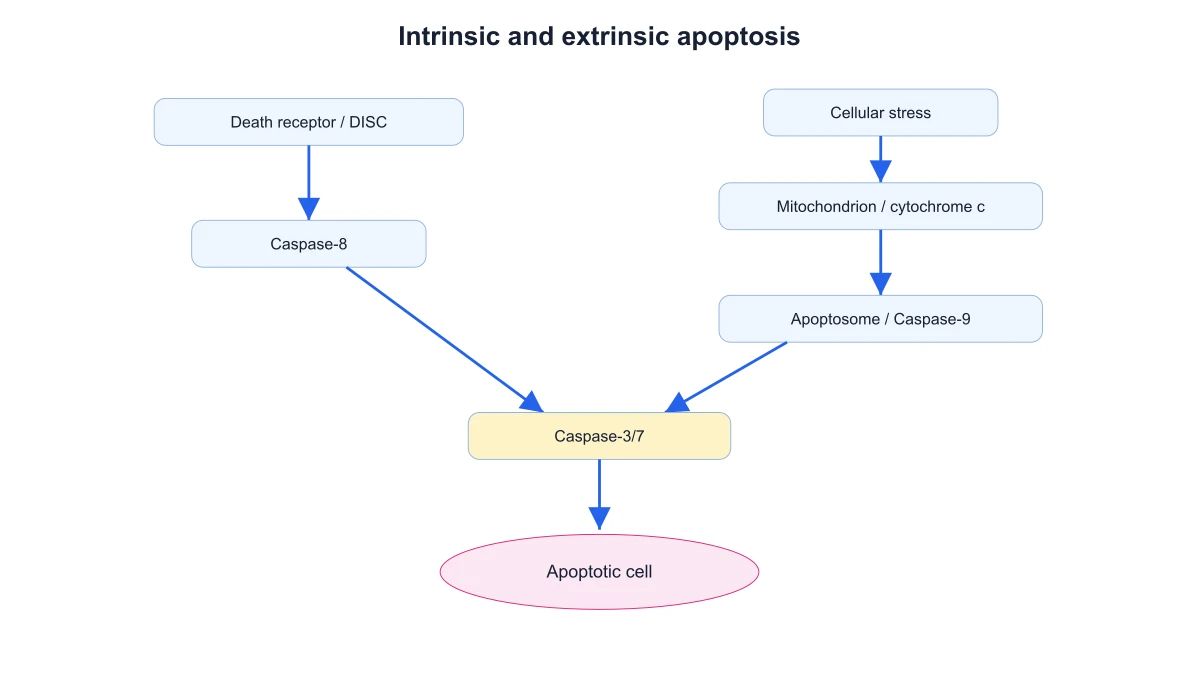 Apoptosis Diagram Generator
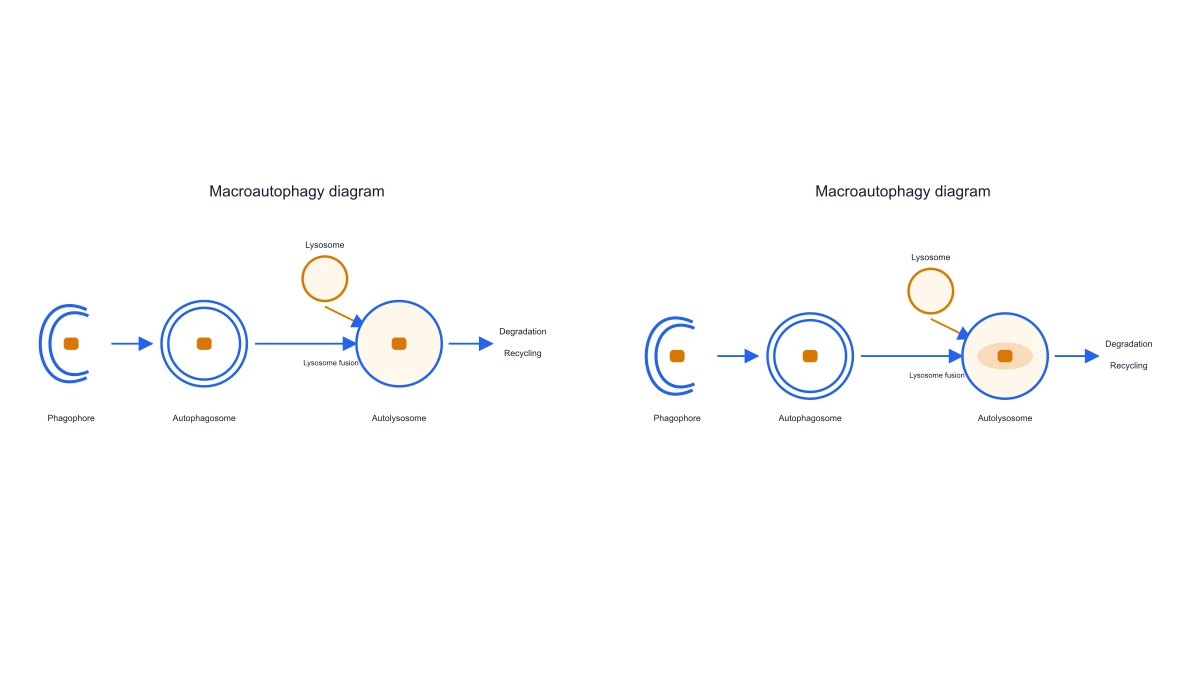 Autophagy Diagram Generator
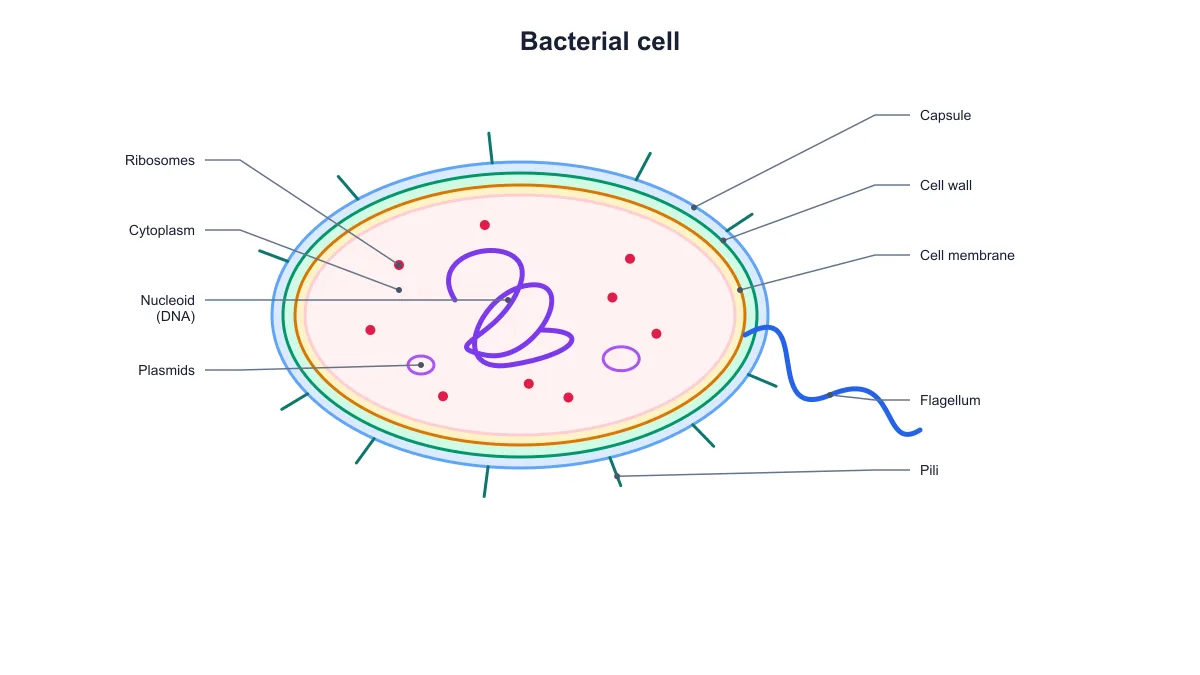 Bacteria Diagram Generator
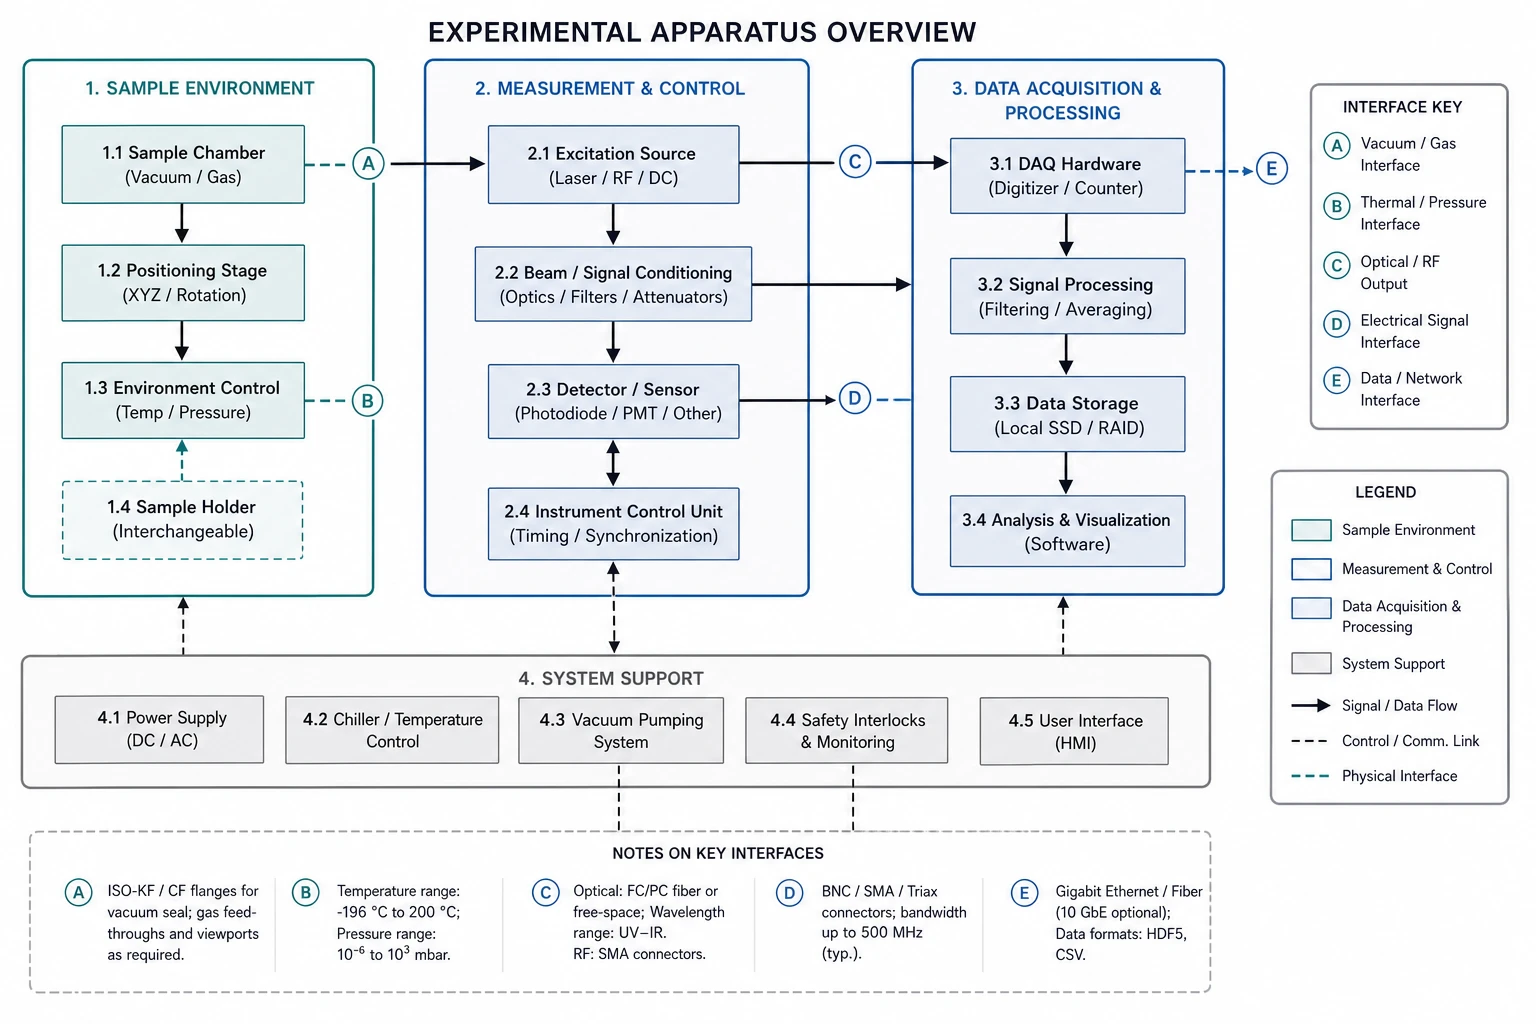 Blueprint Maker
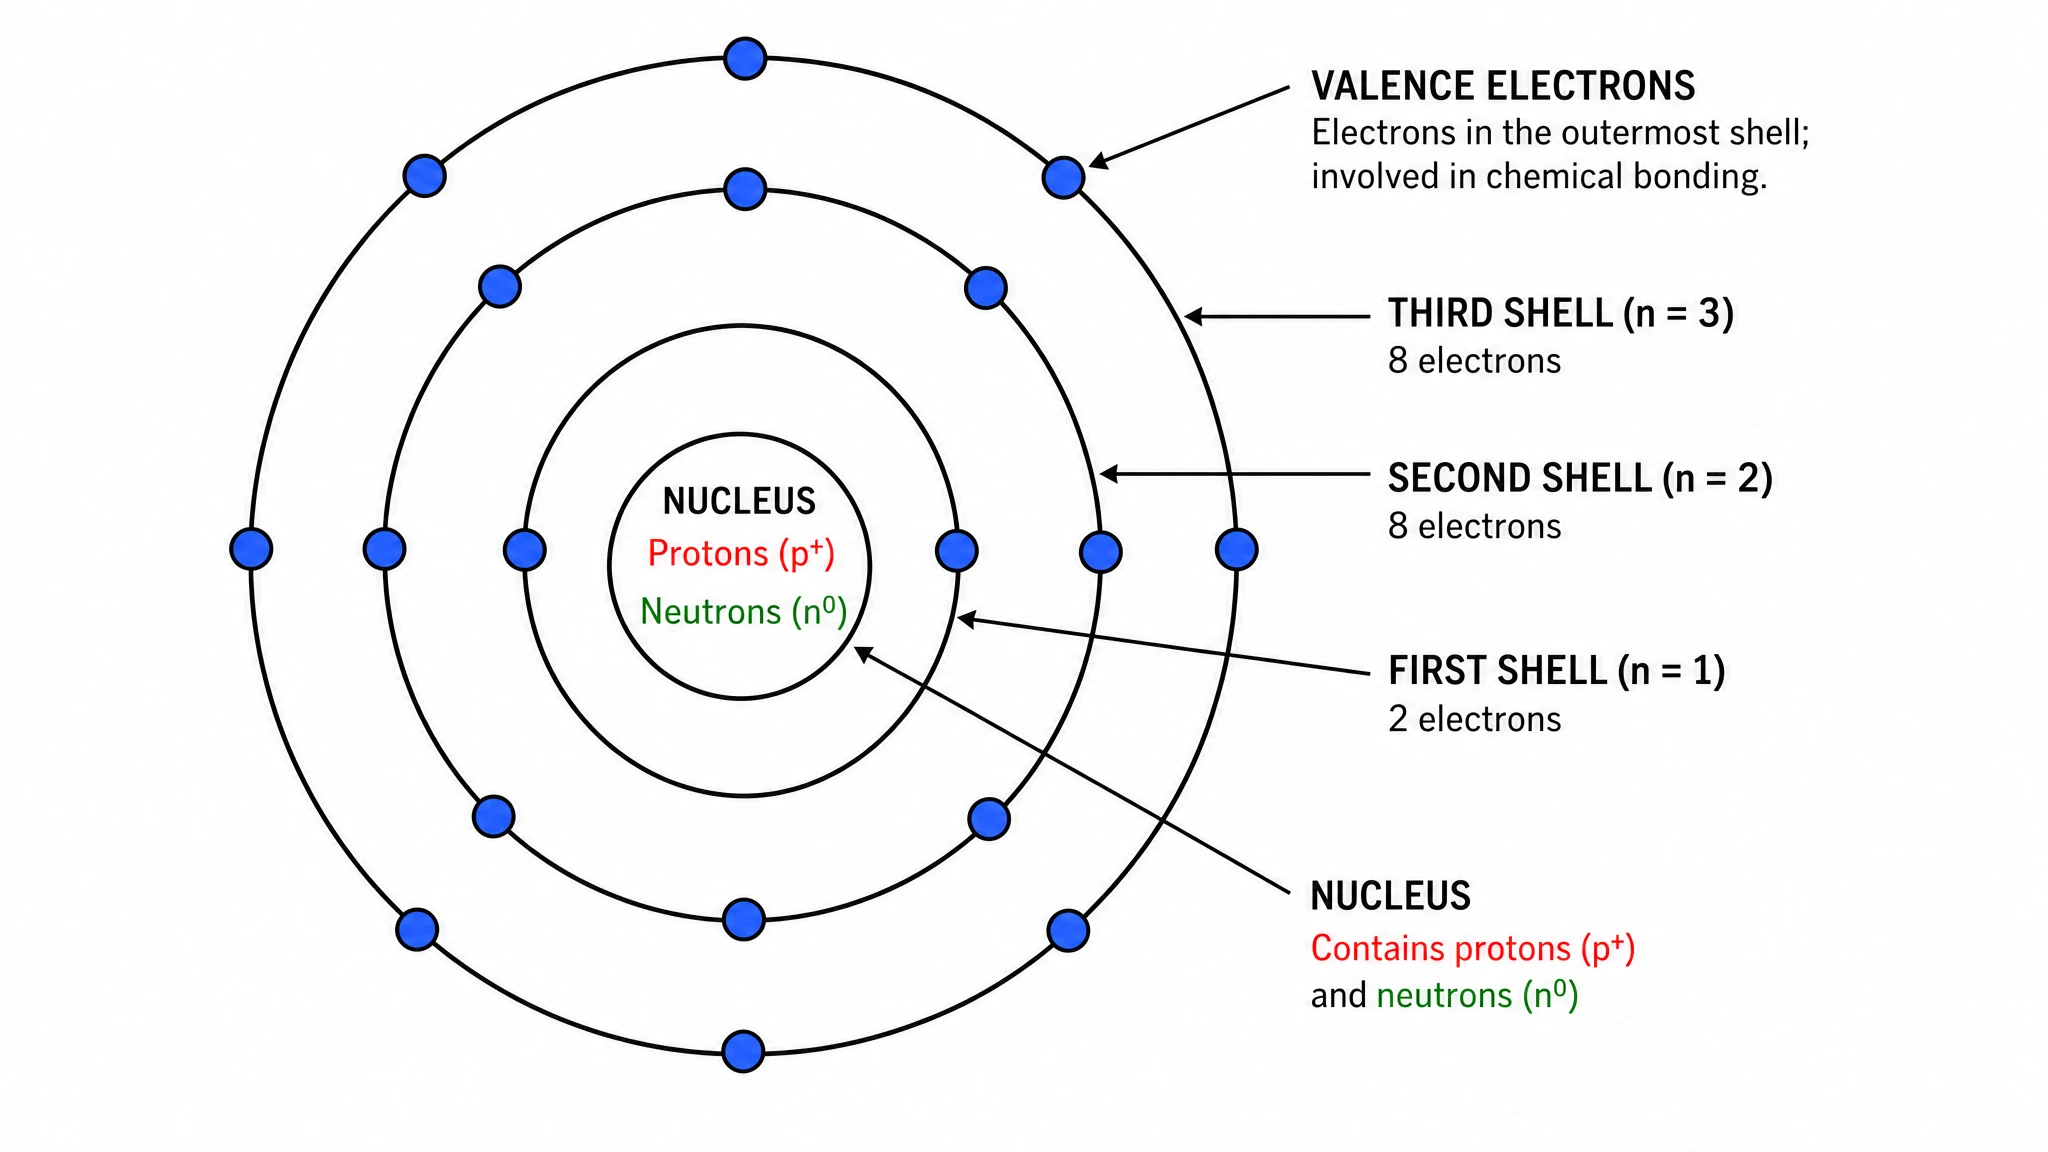 Bohr Model Maker
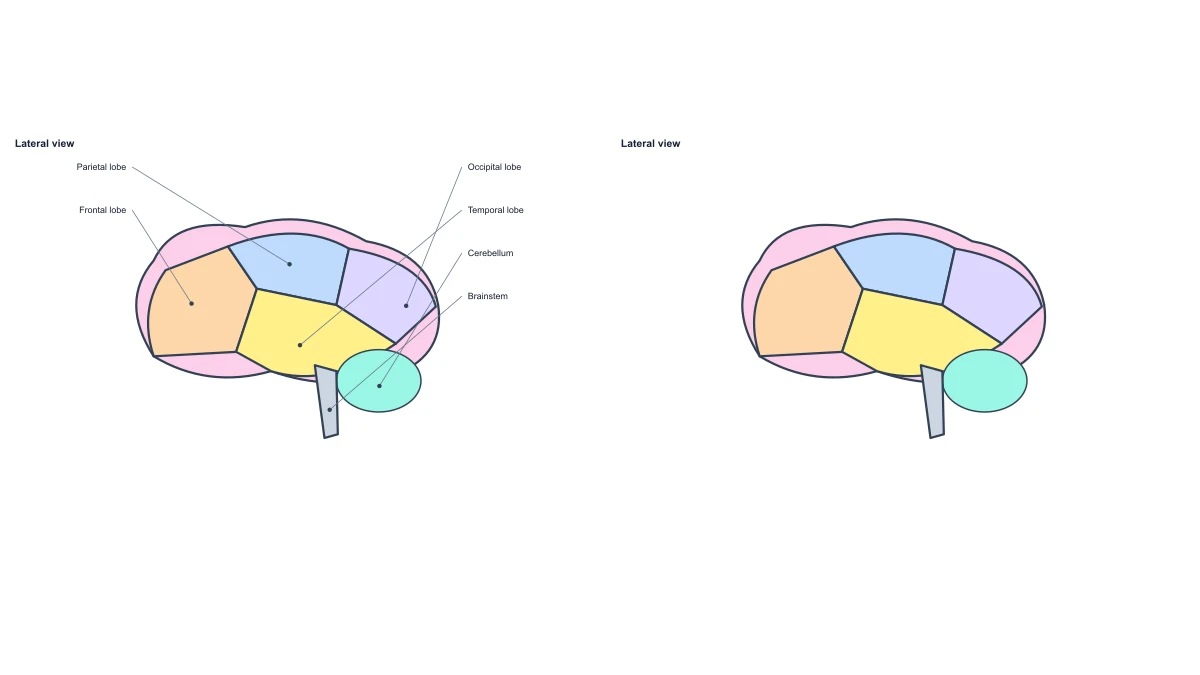 Brain Anatomy Diagram
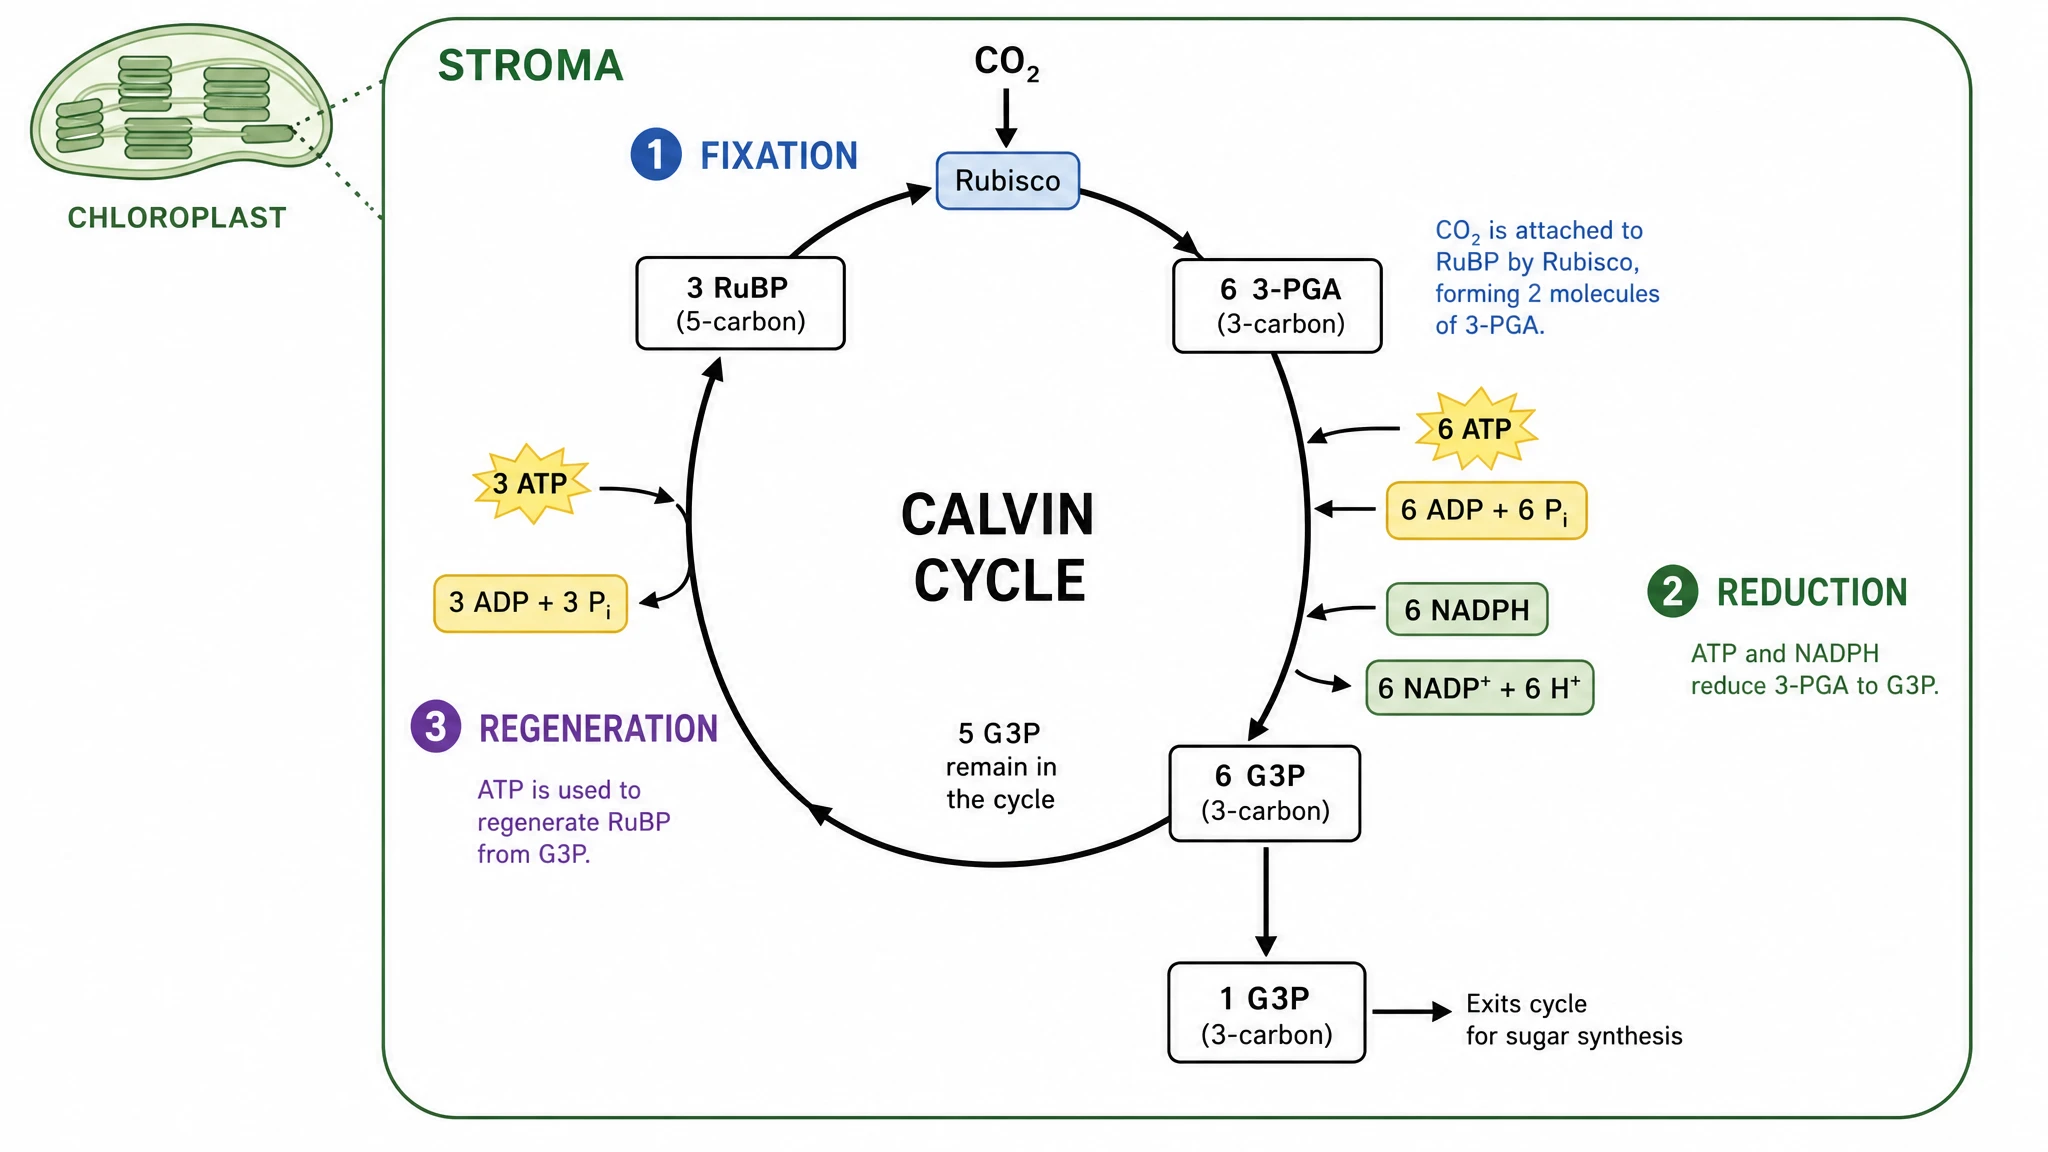 Calvin Cycle Diagram Generator
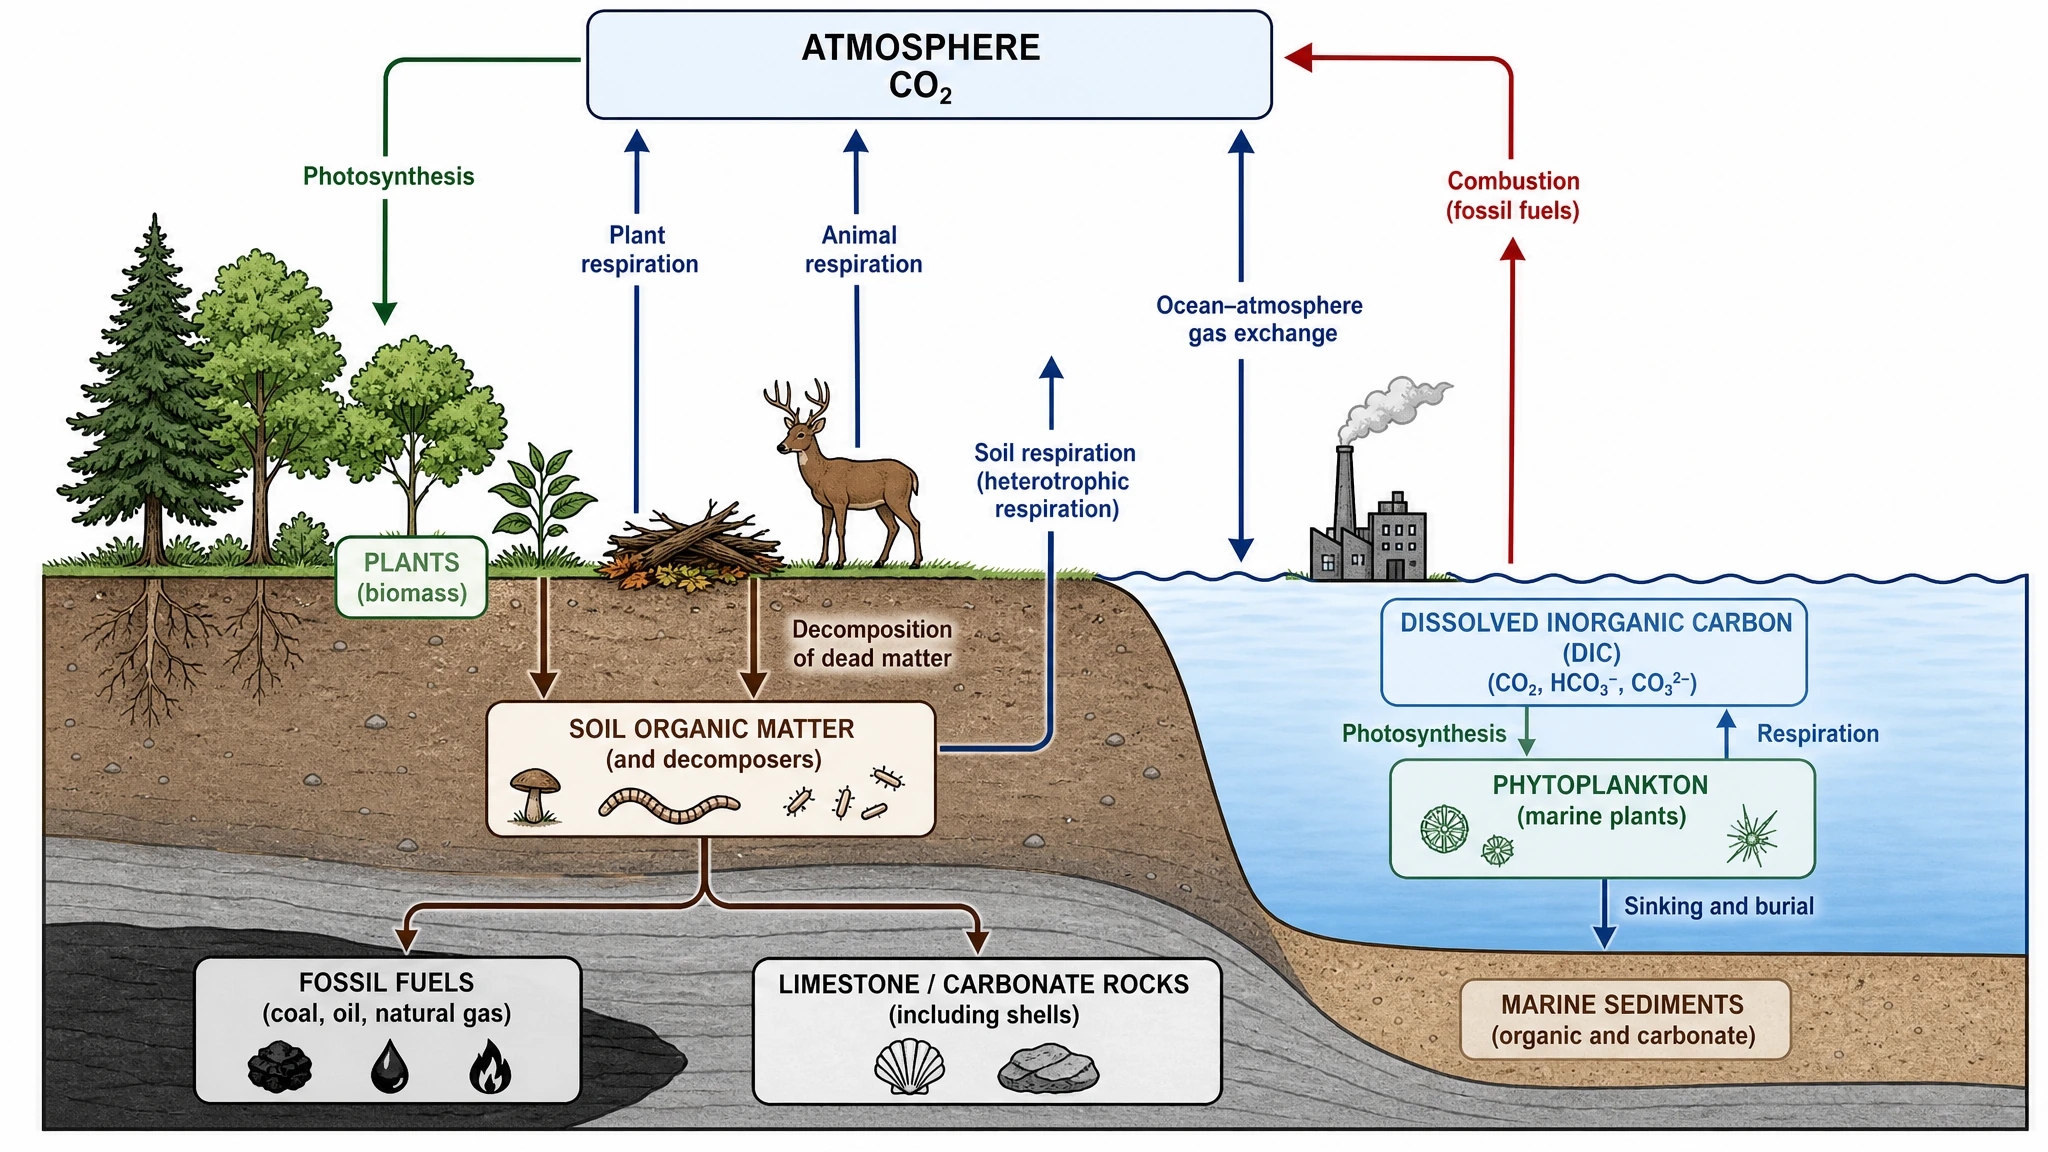 Carbon Cycle Diagram Generator
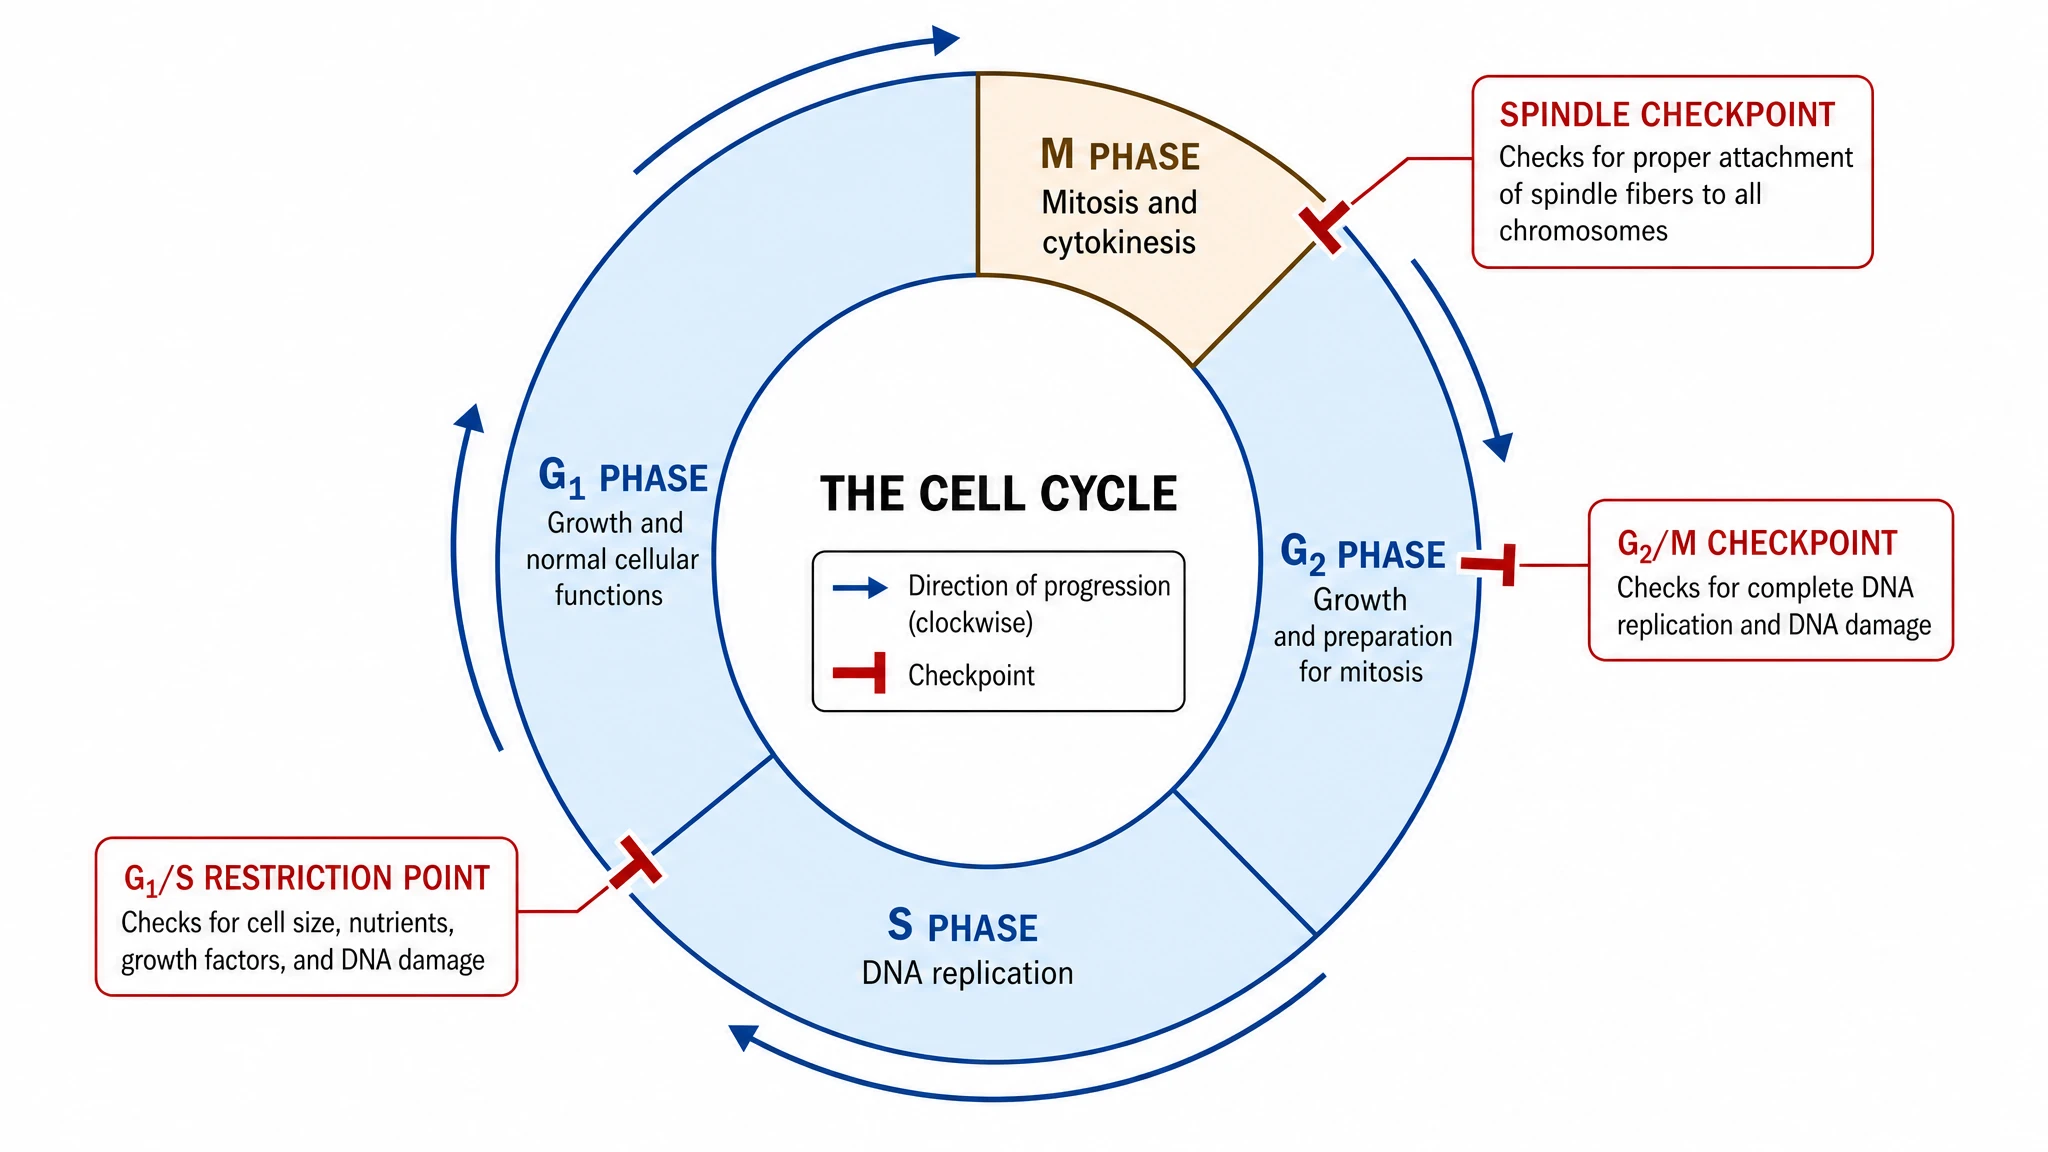 Cell Cycle Diagram Generator
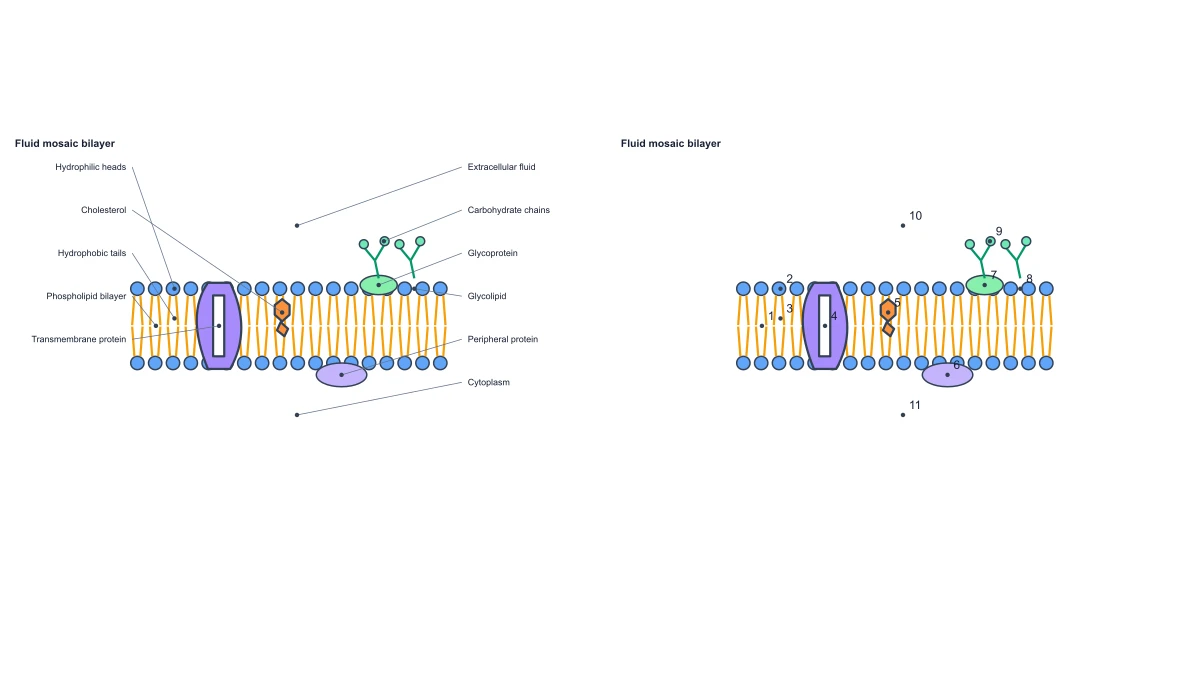 Cell Membrane Diagram
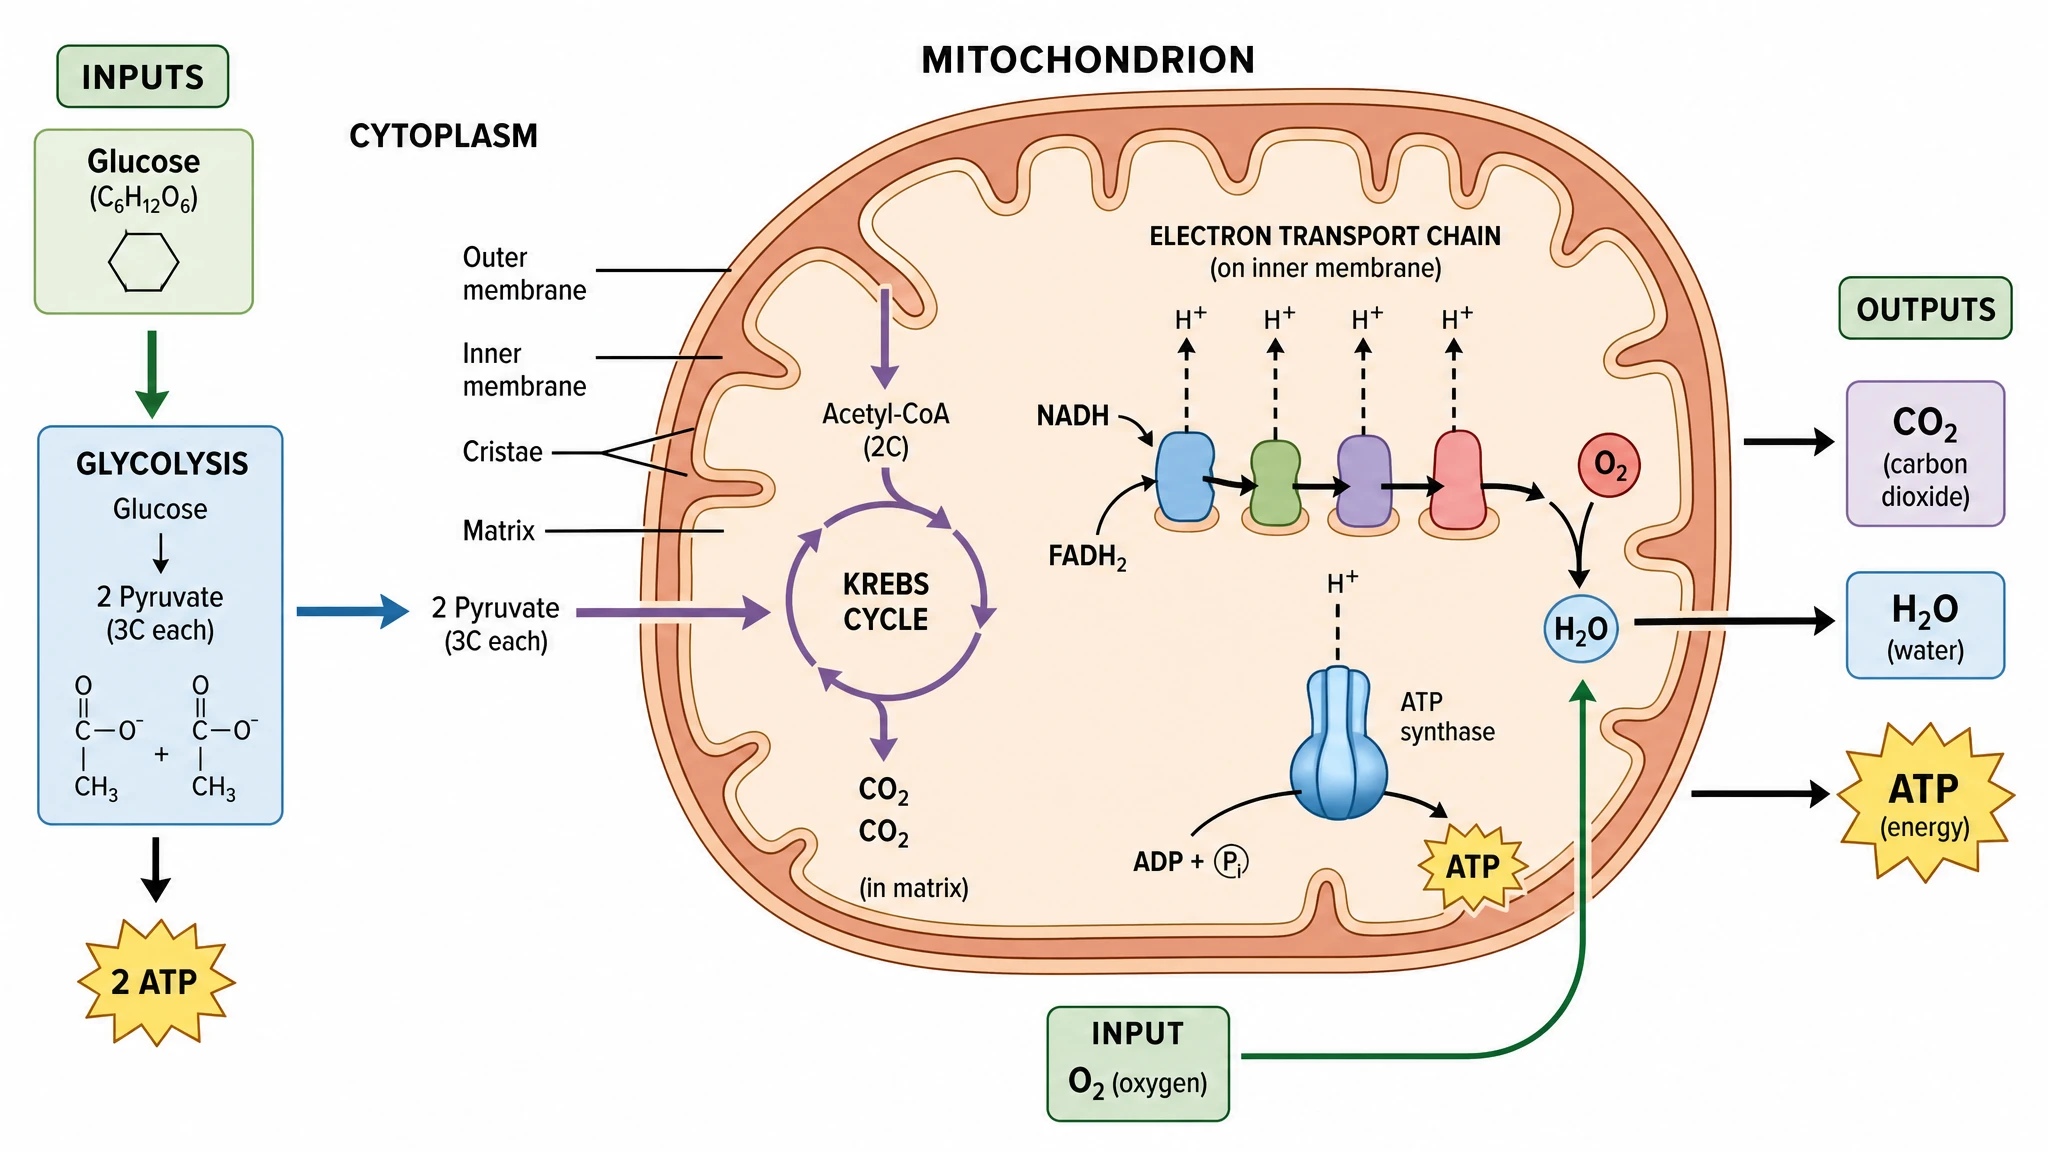 Cellular Respiration Diagram Generator
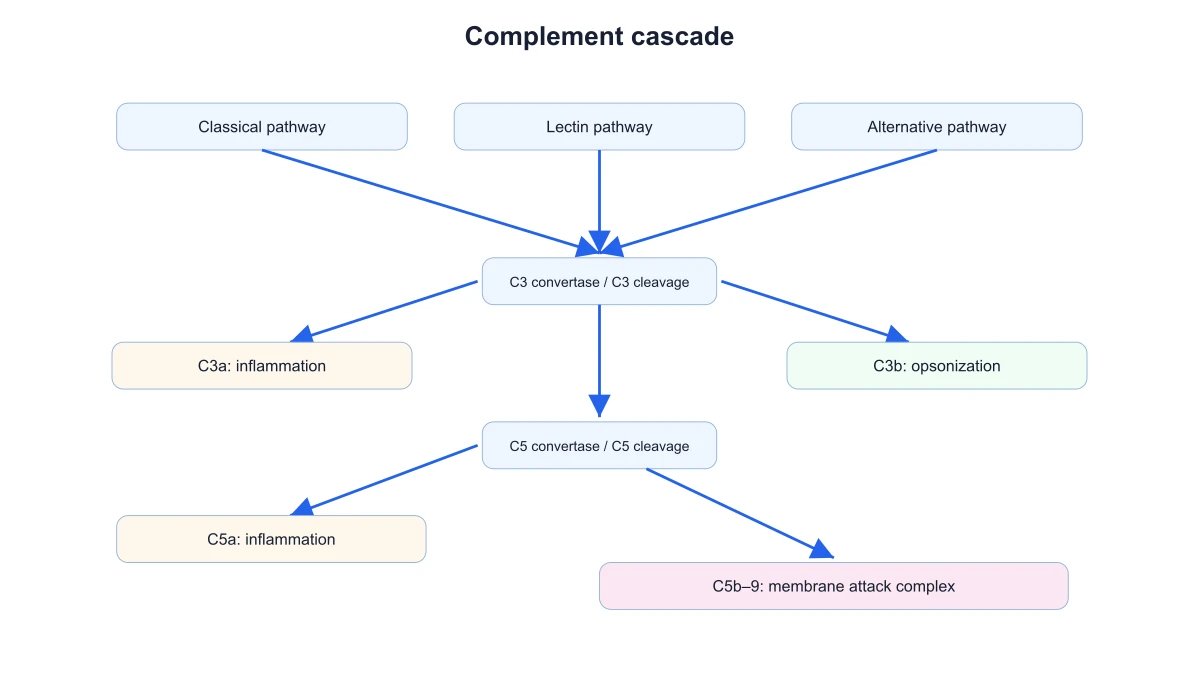 Complement System Diagram Generator
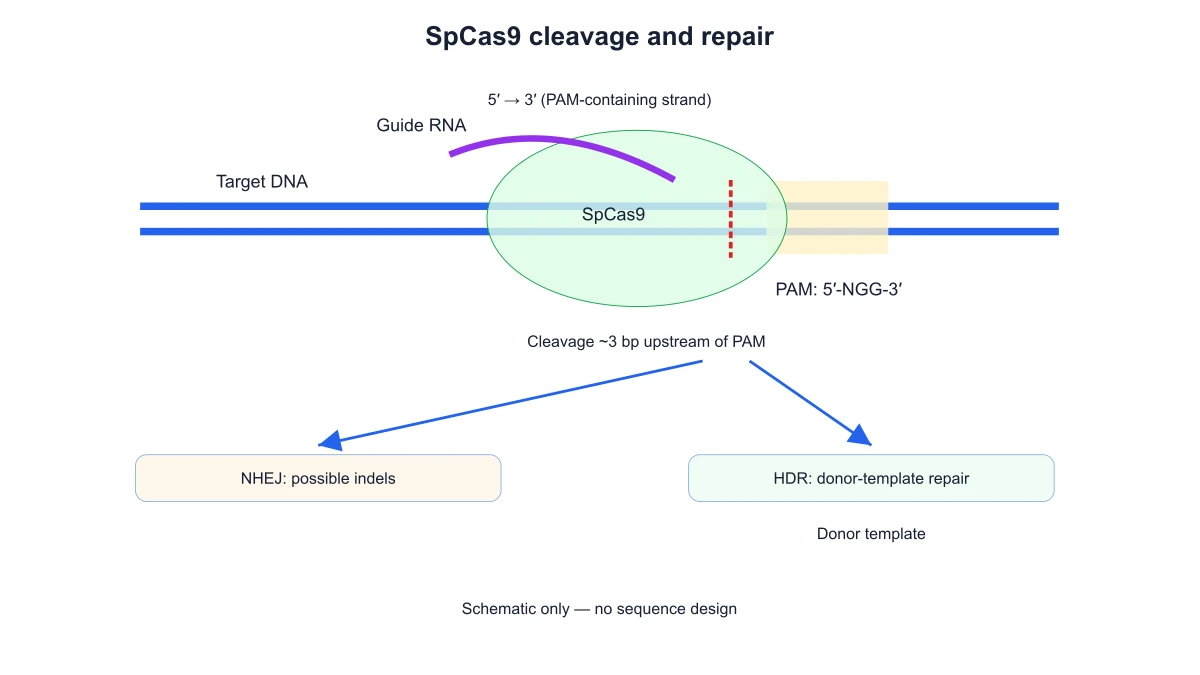 CRISPR-Cas9 Diagram Generator
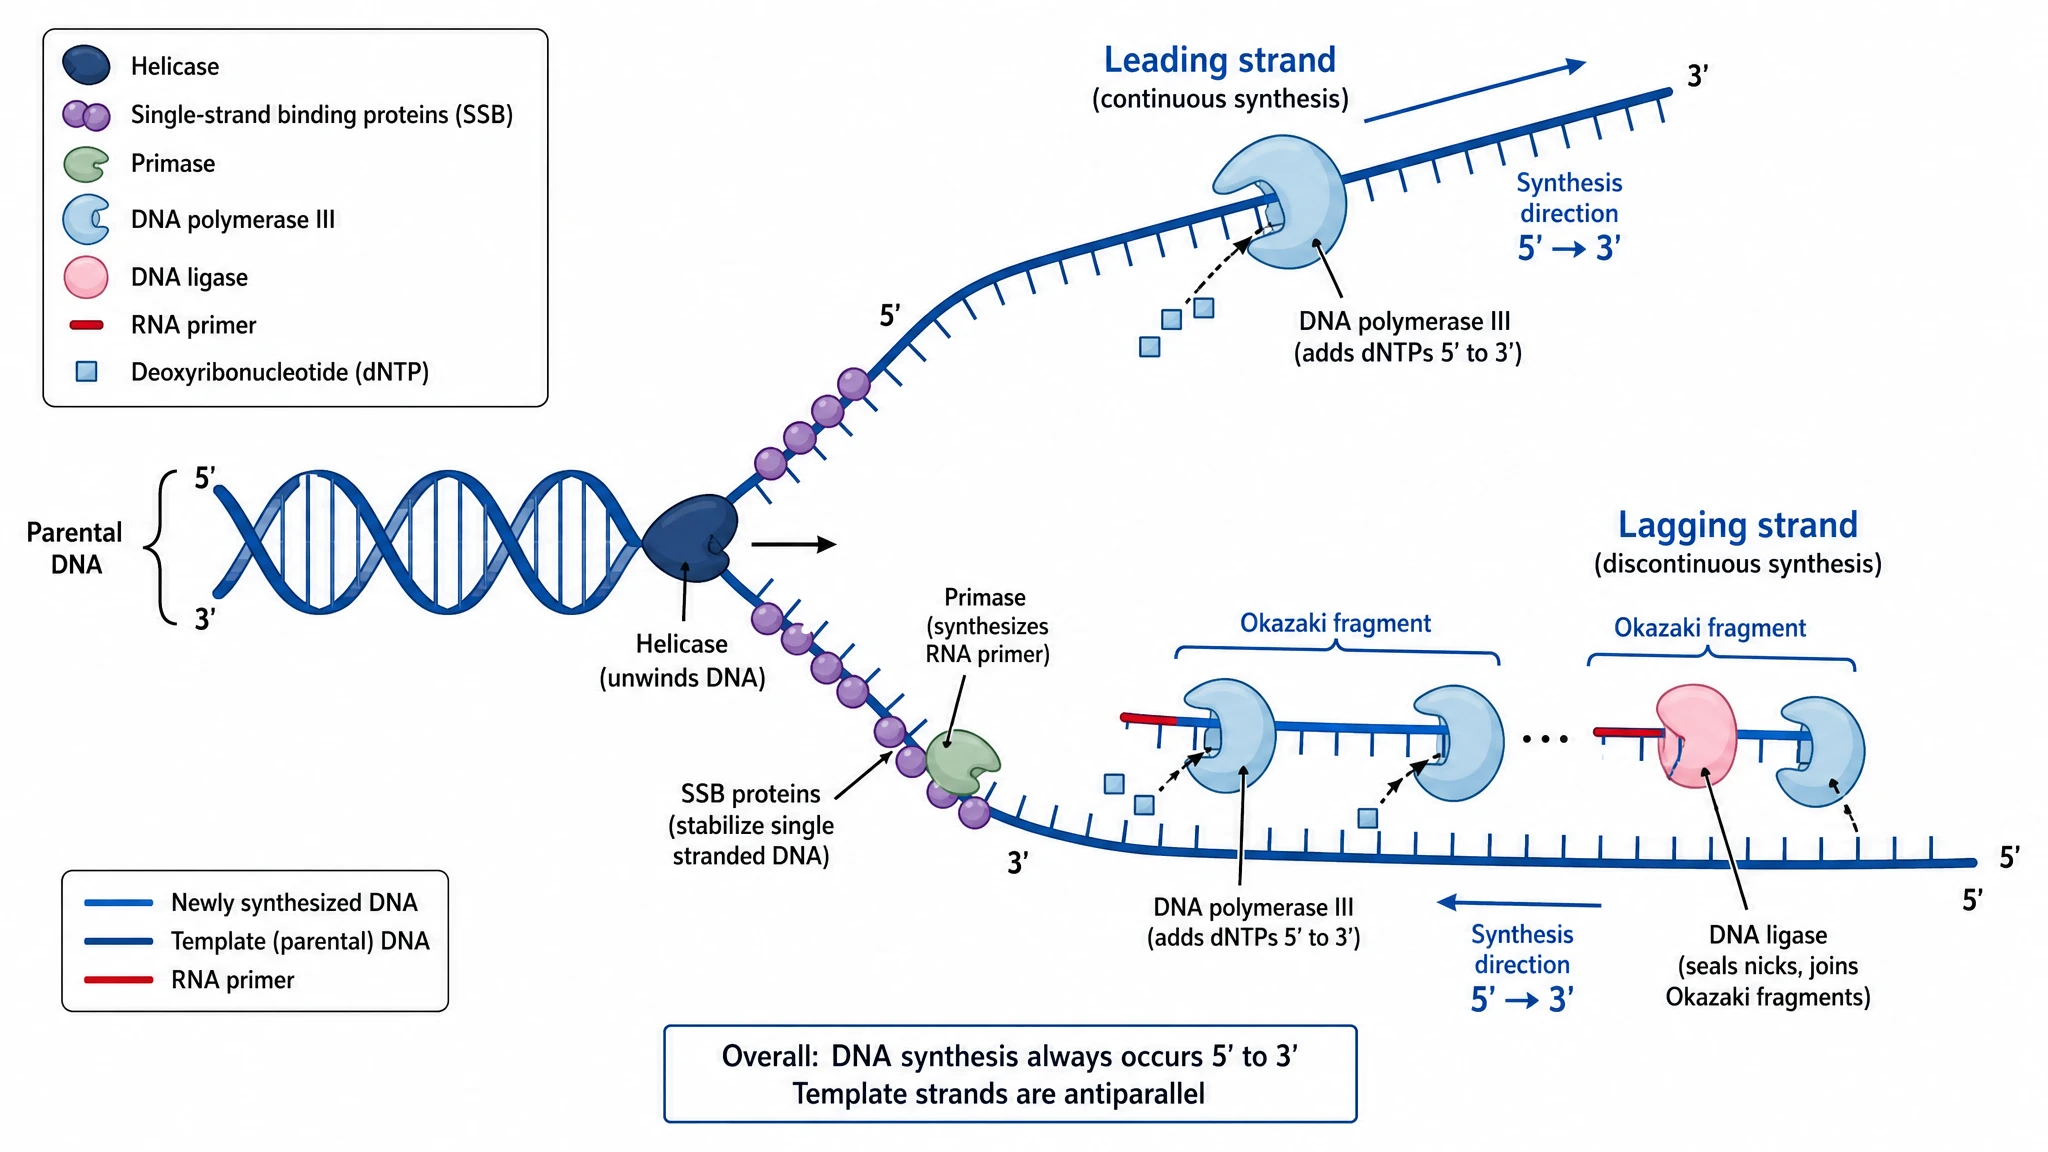 DNA Replication Diagram Generator
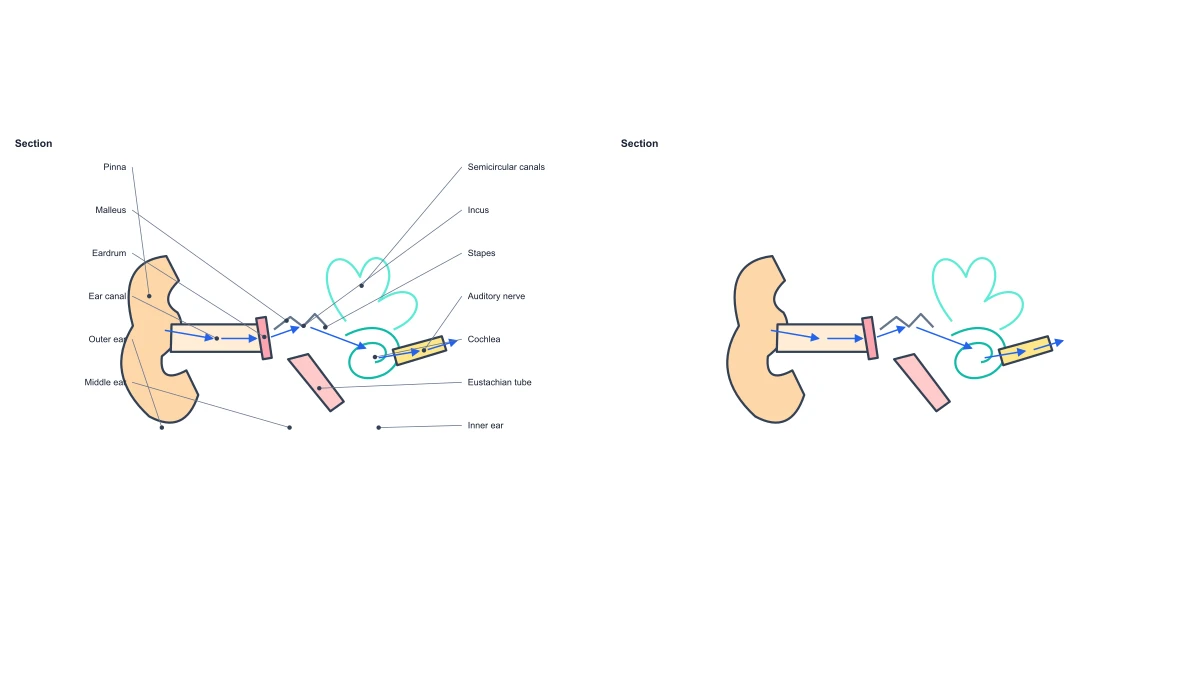 Ear Anatomy Diagram
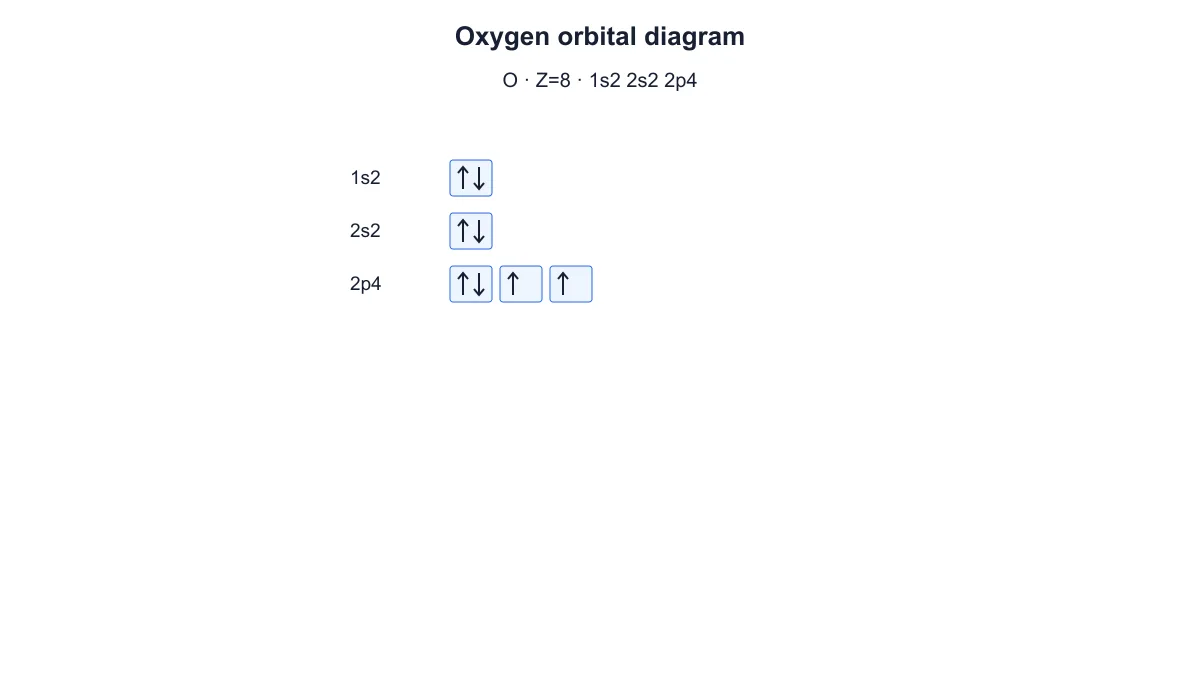 Electron Configuration Diagram Generator
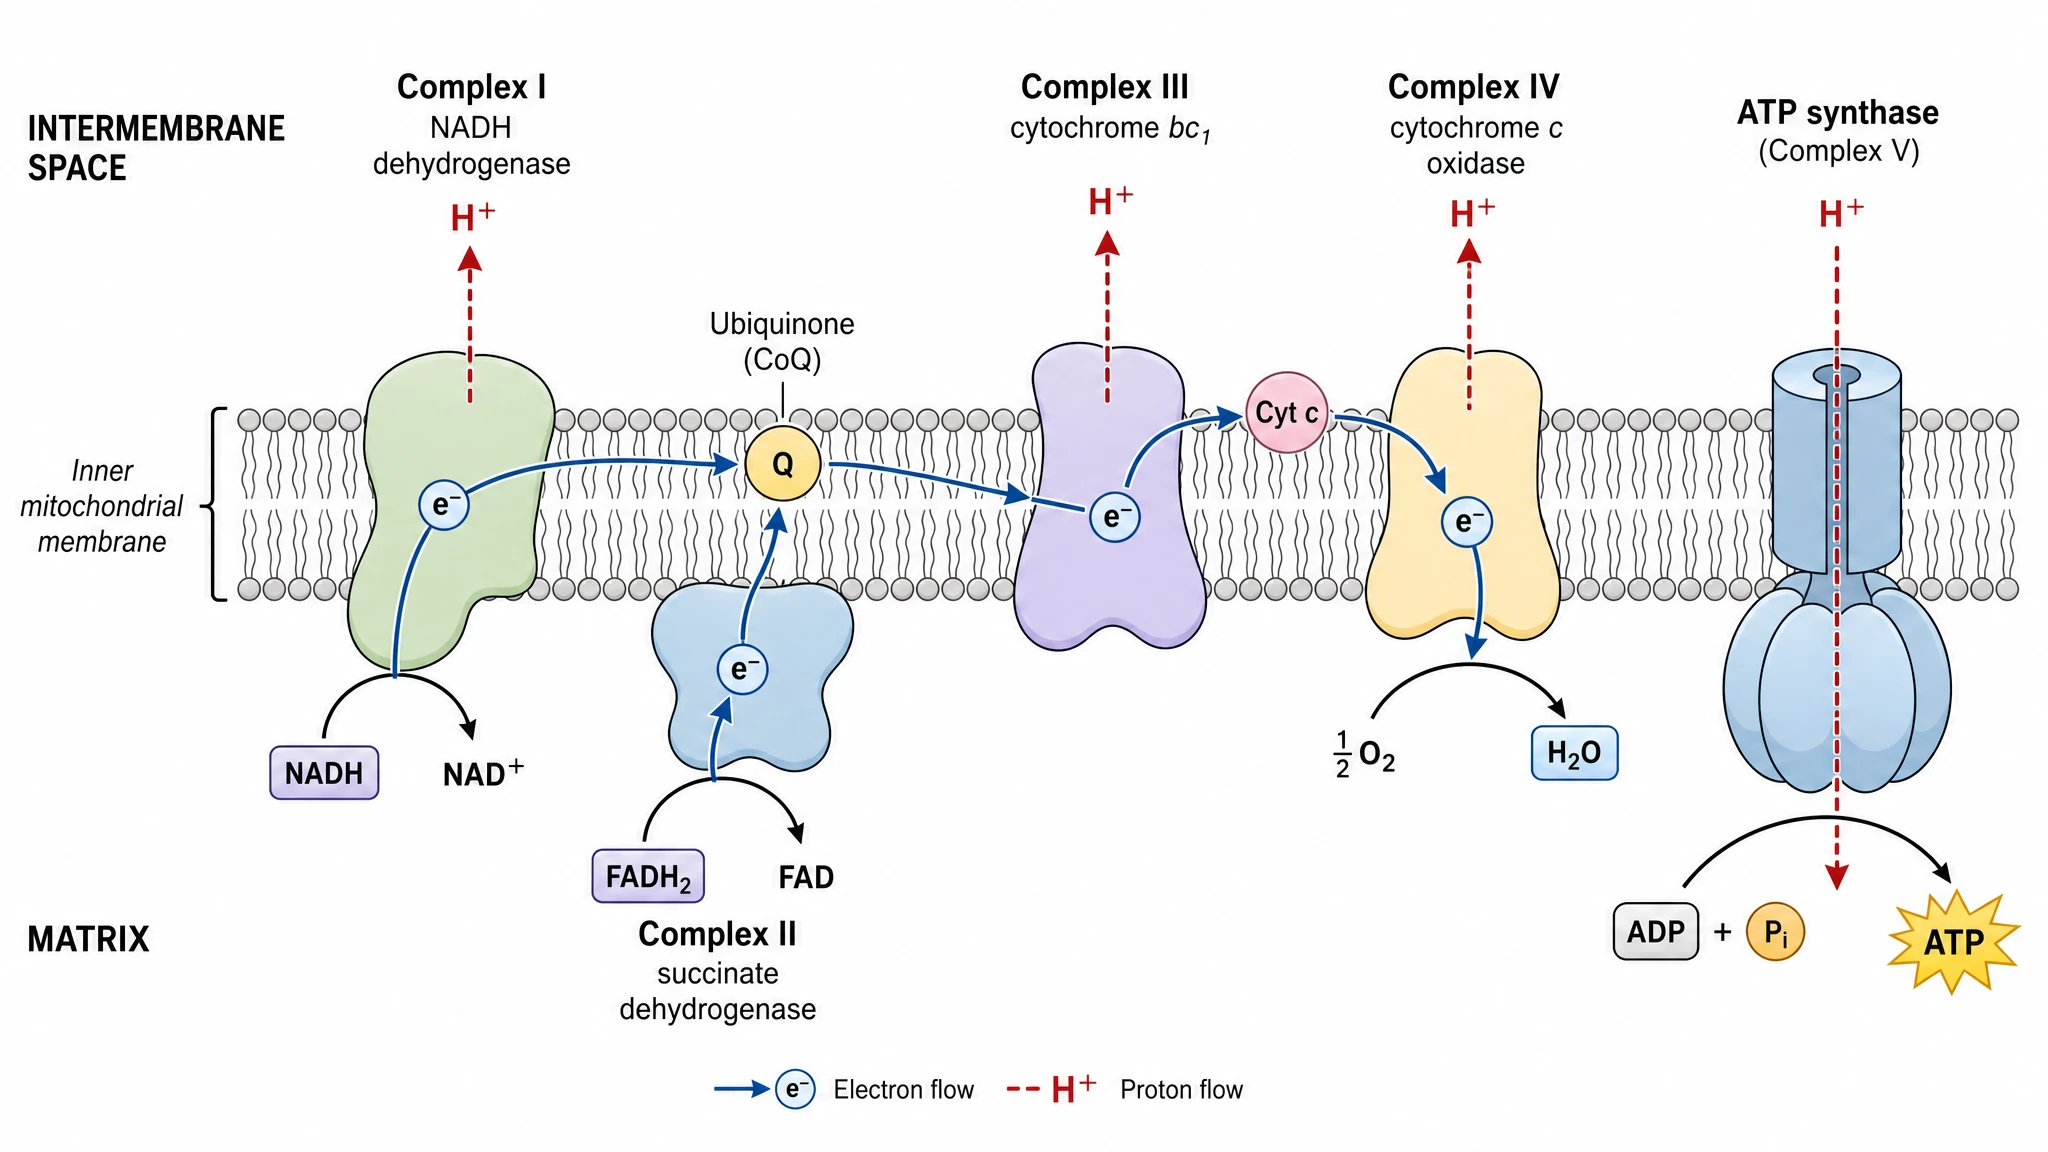 Electron Transport Chain Diagram Generator
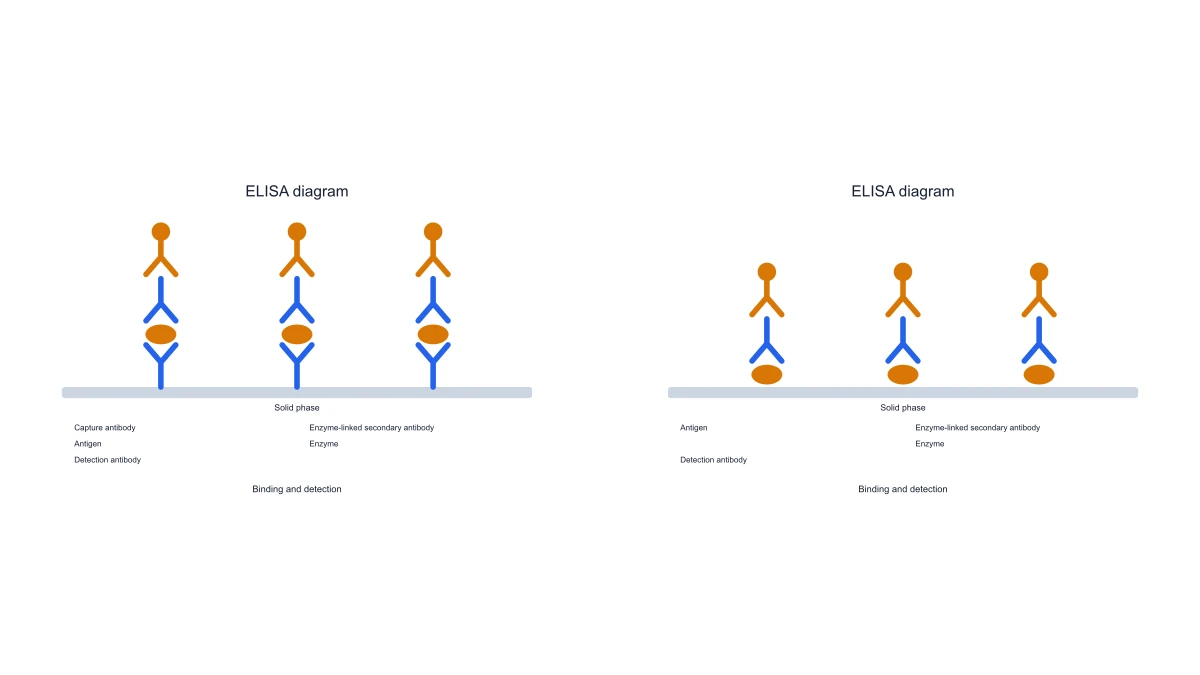 ELISA Diagram Generator
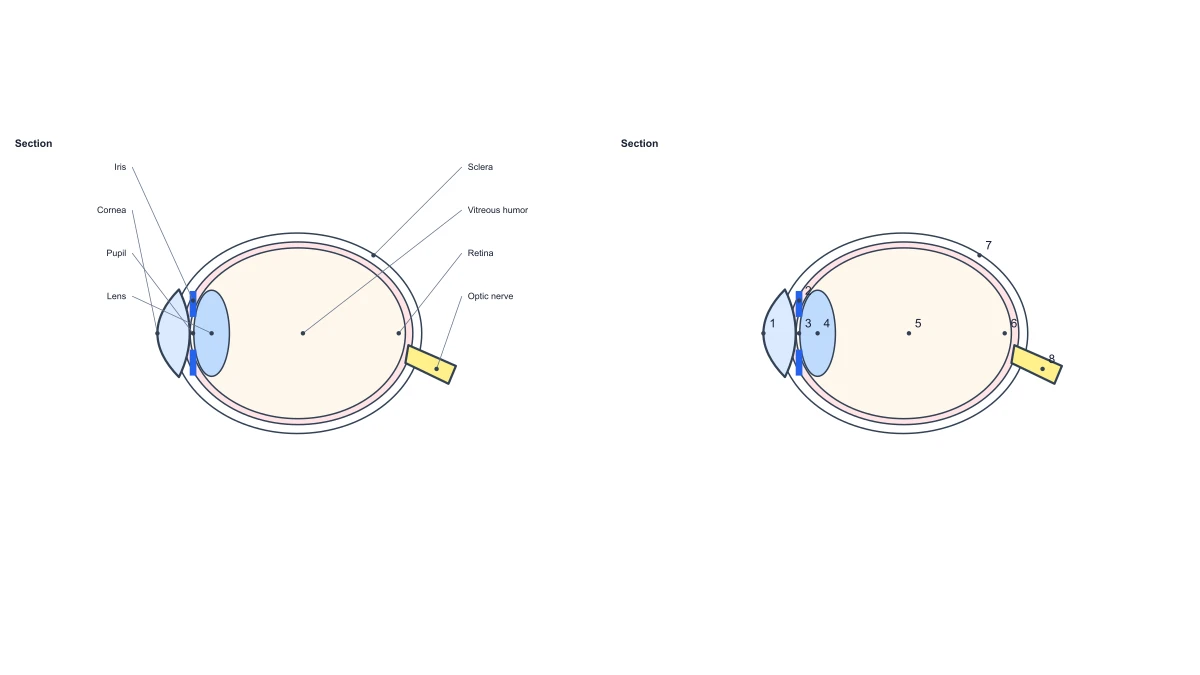 Eye Anatomy Diagram
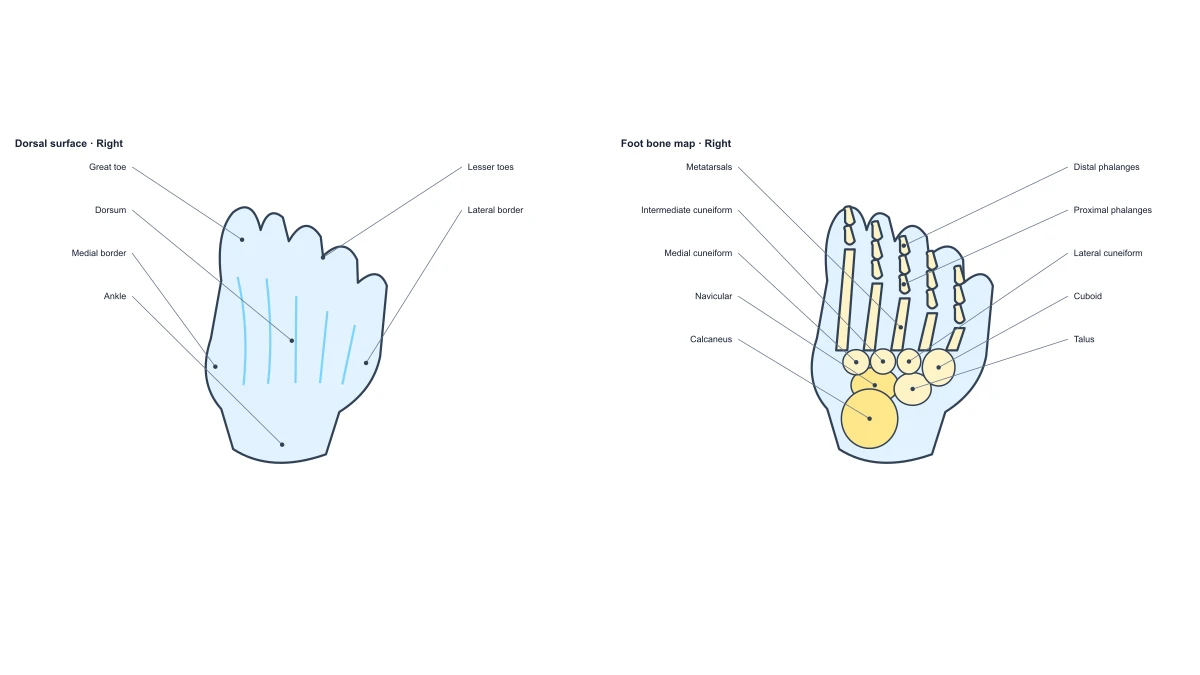 Foot Anatomy Diagram
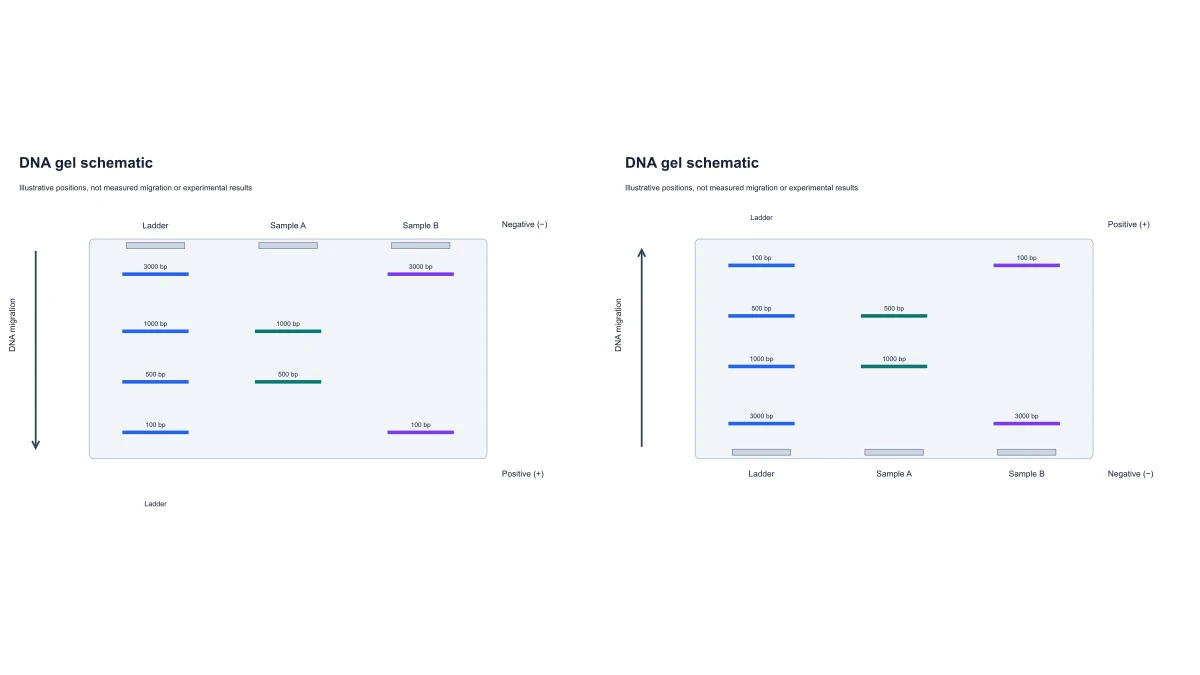 Gel Electrophoresis Diagram Generator
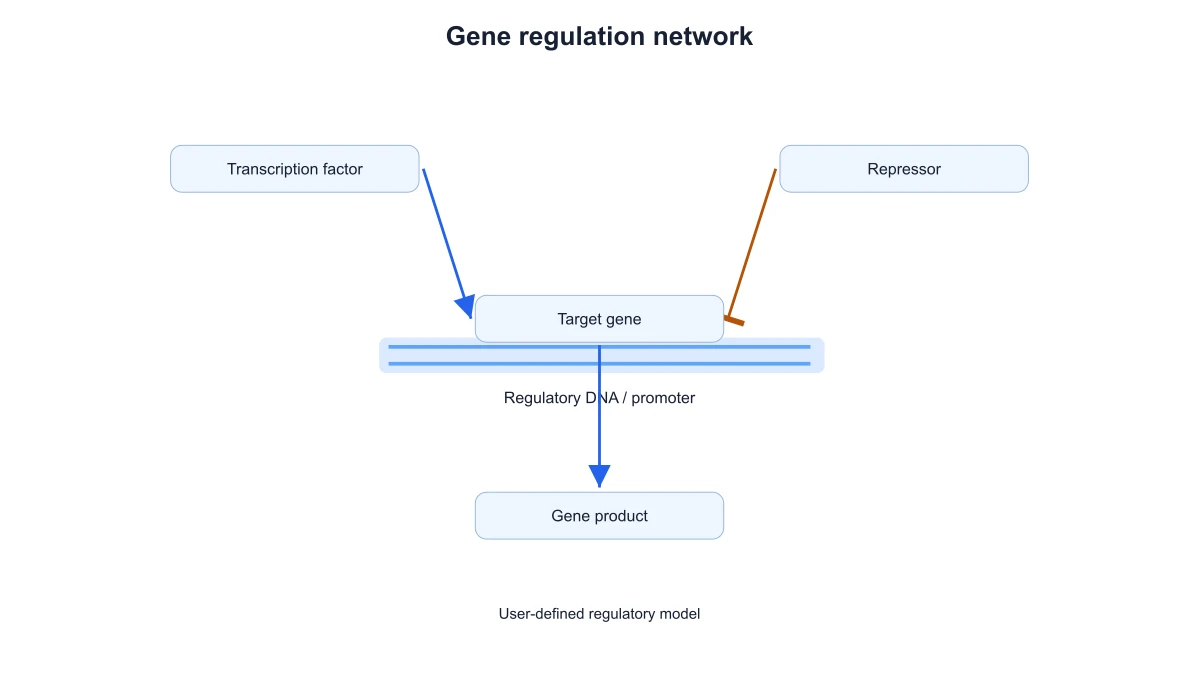 Gene Regulation Diagram Generator
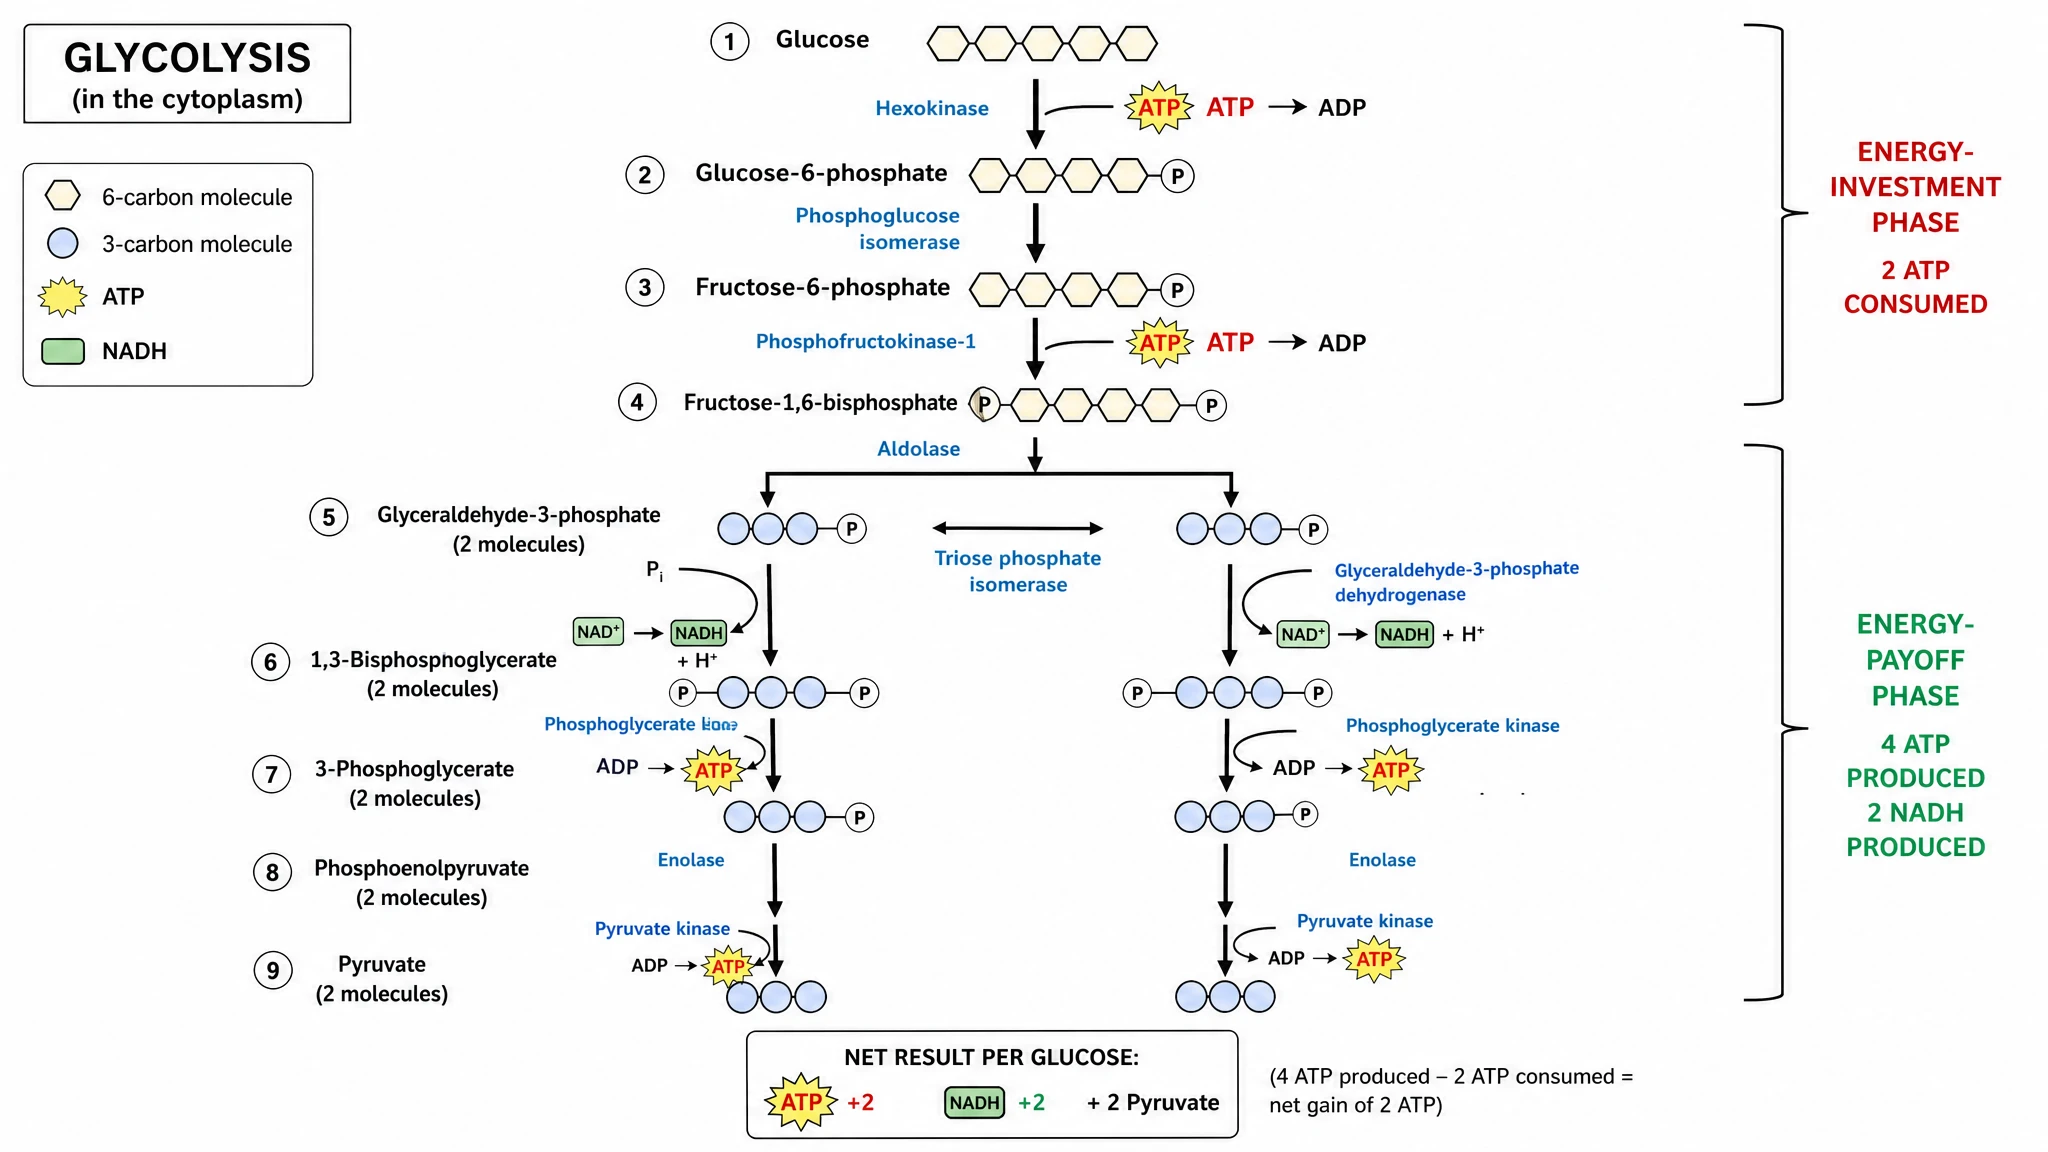 Glycolysis Diagram Generator
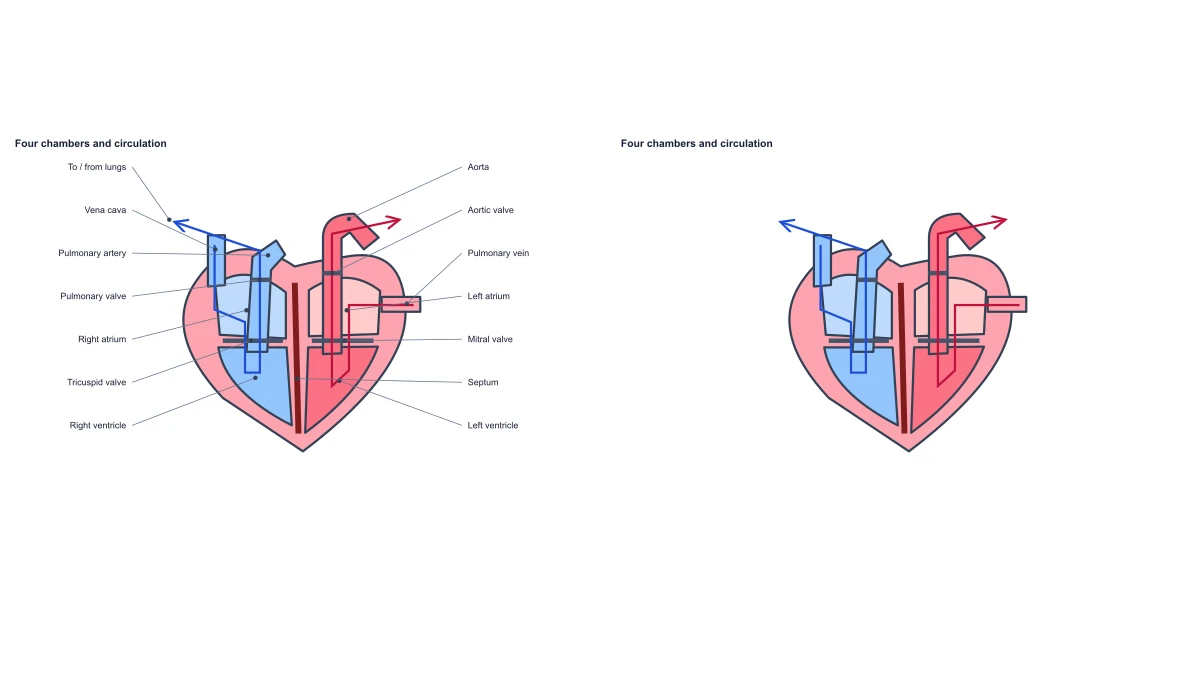 Heart Diagram
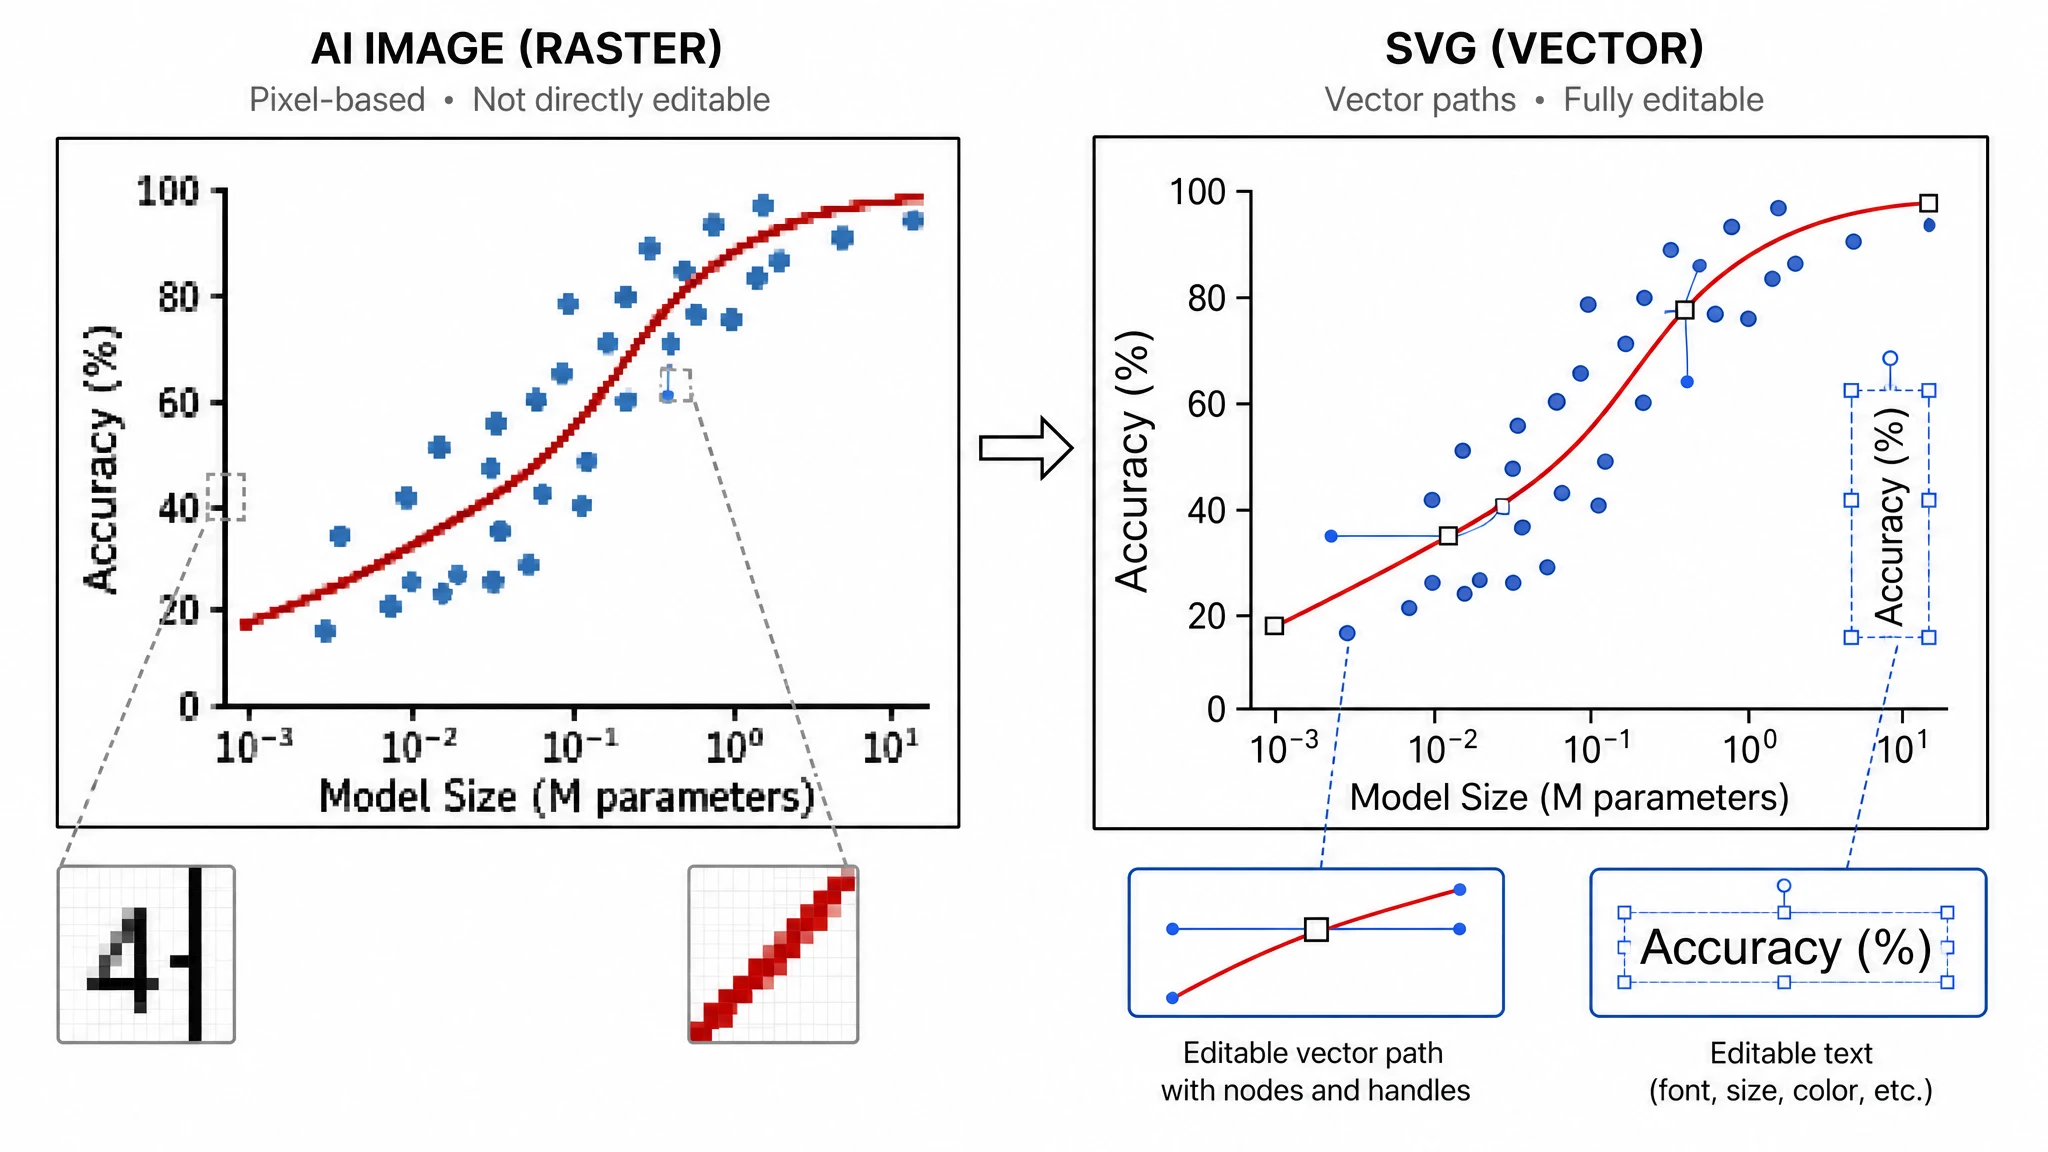 Image to Editable SVG Converter
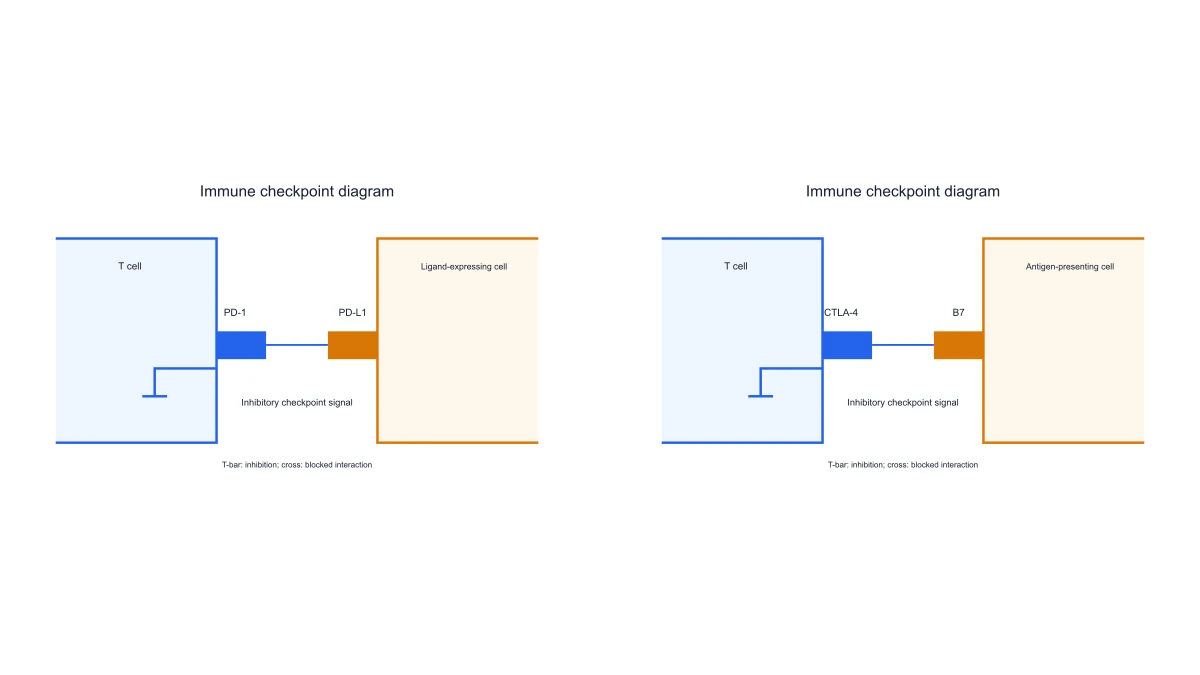 Immune Checkpoint Diagram Generator
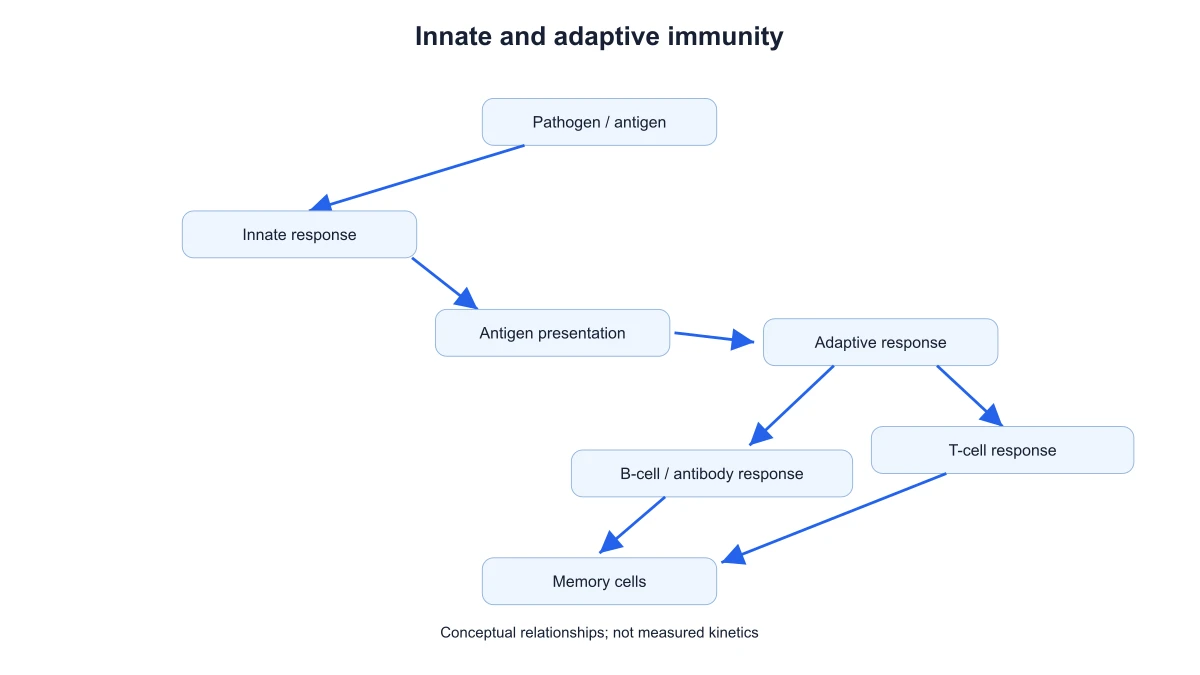 Immune Response Diagram Generator
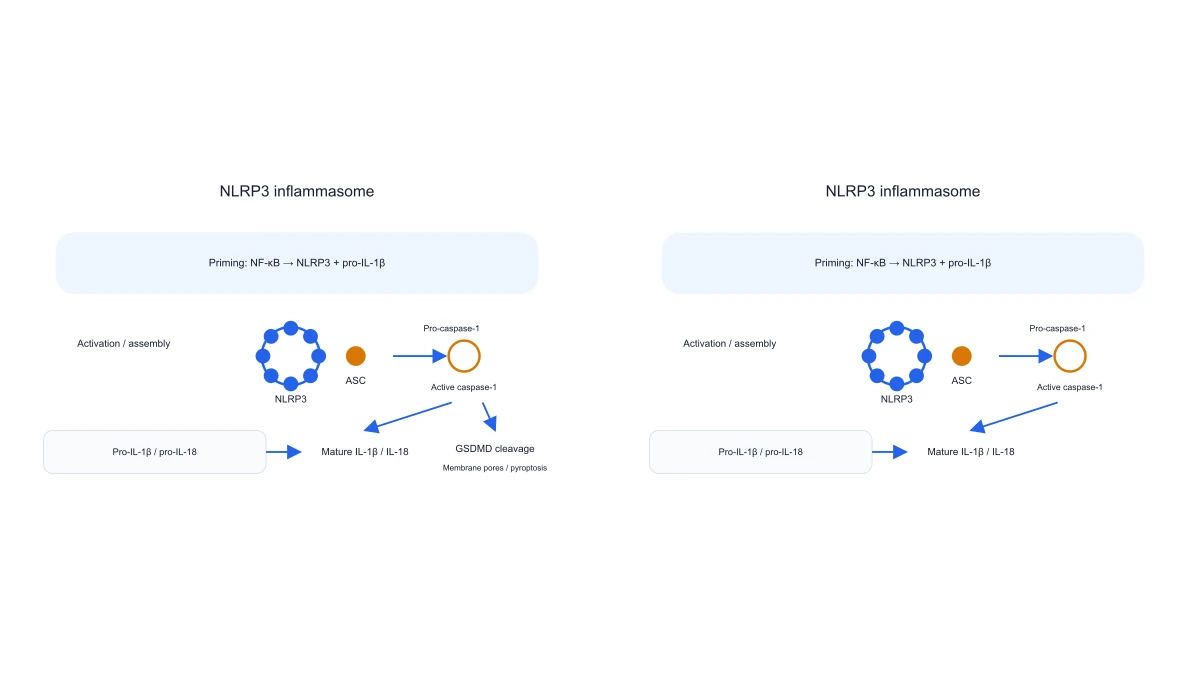 Inflammasome Diagram Generator
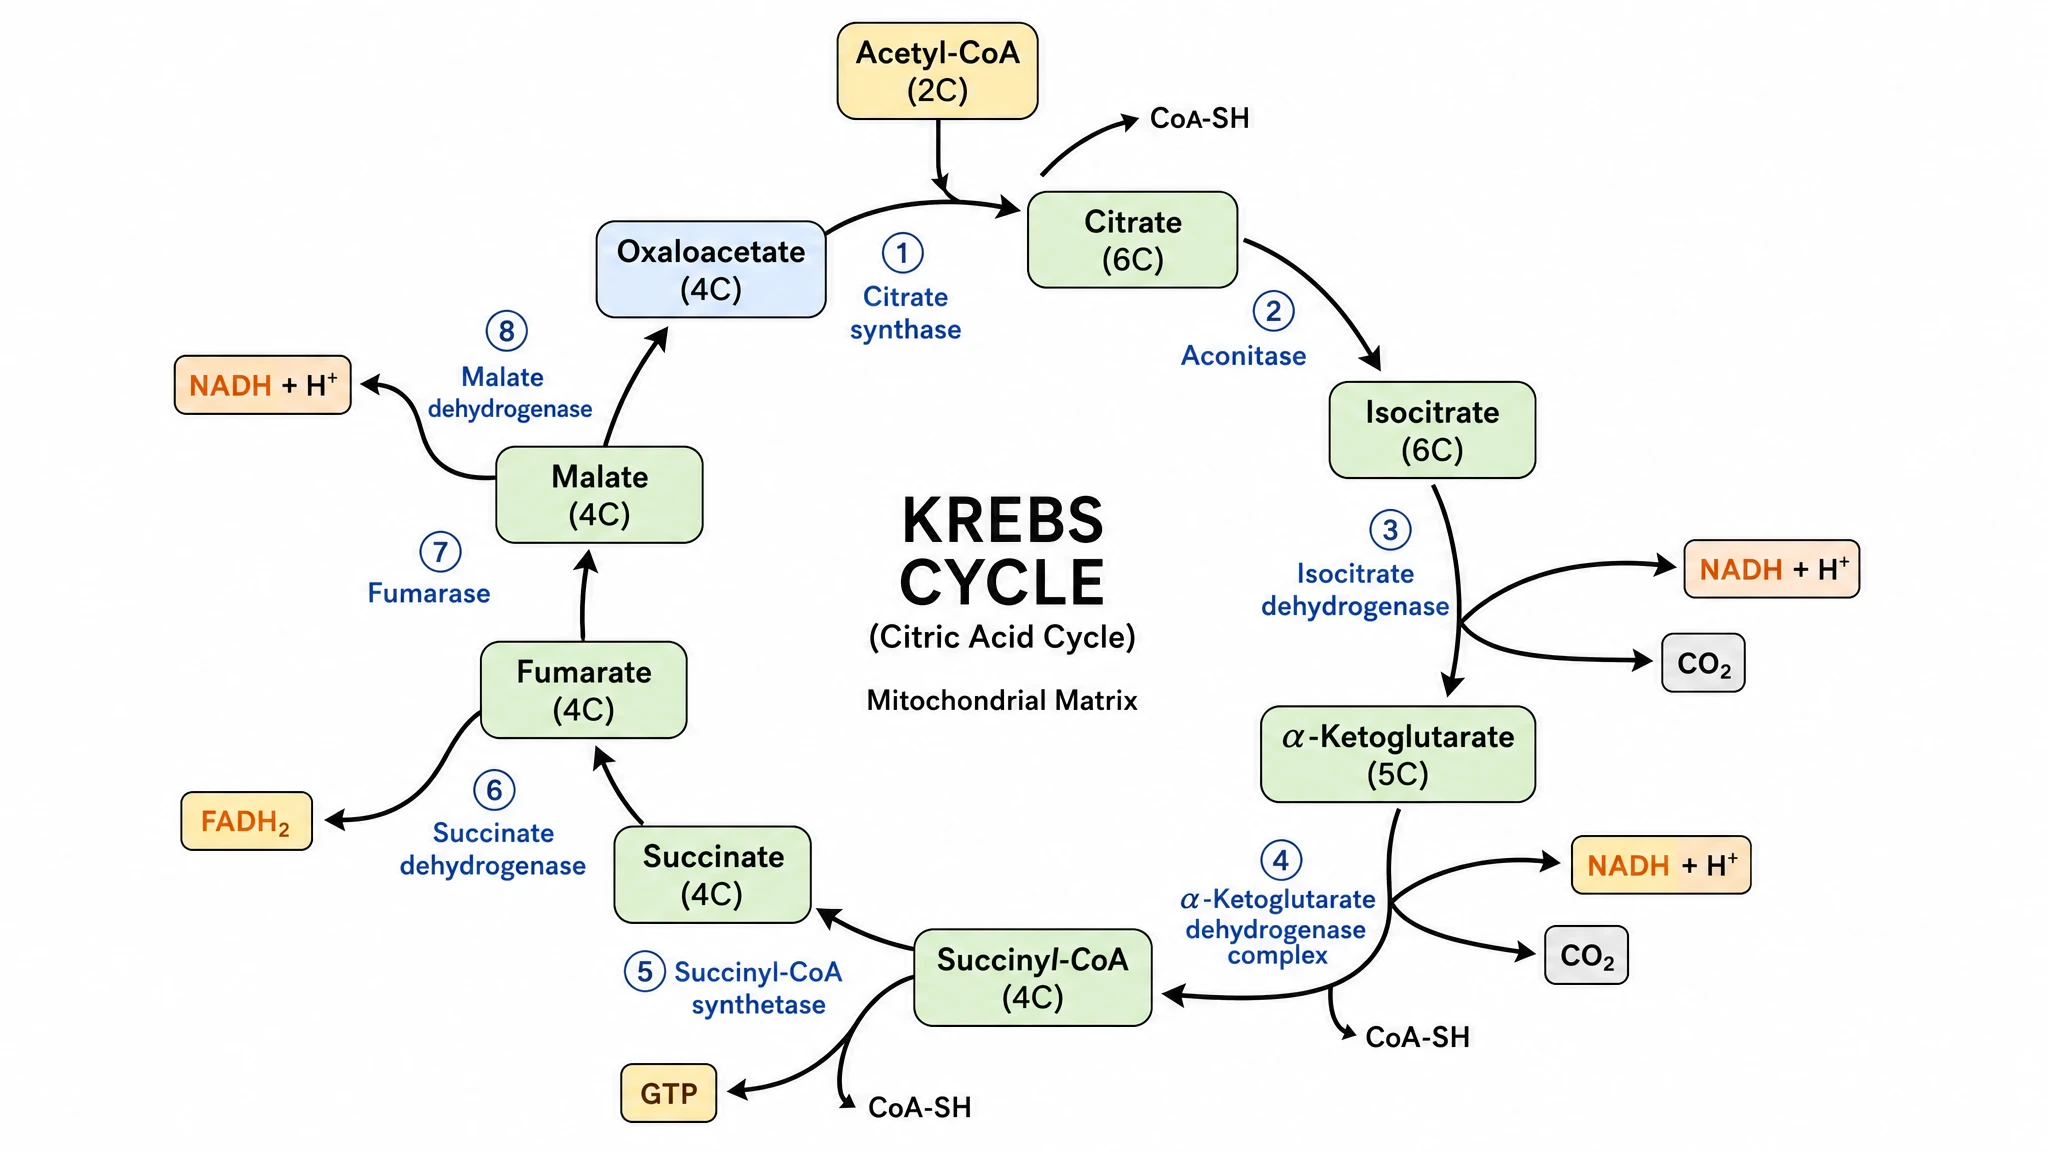 Krebs Cycle Diagram Generator
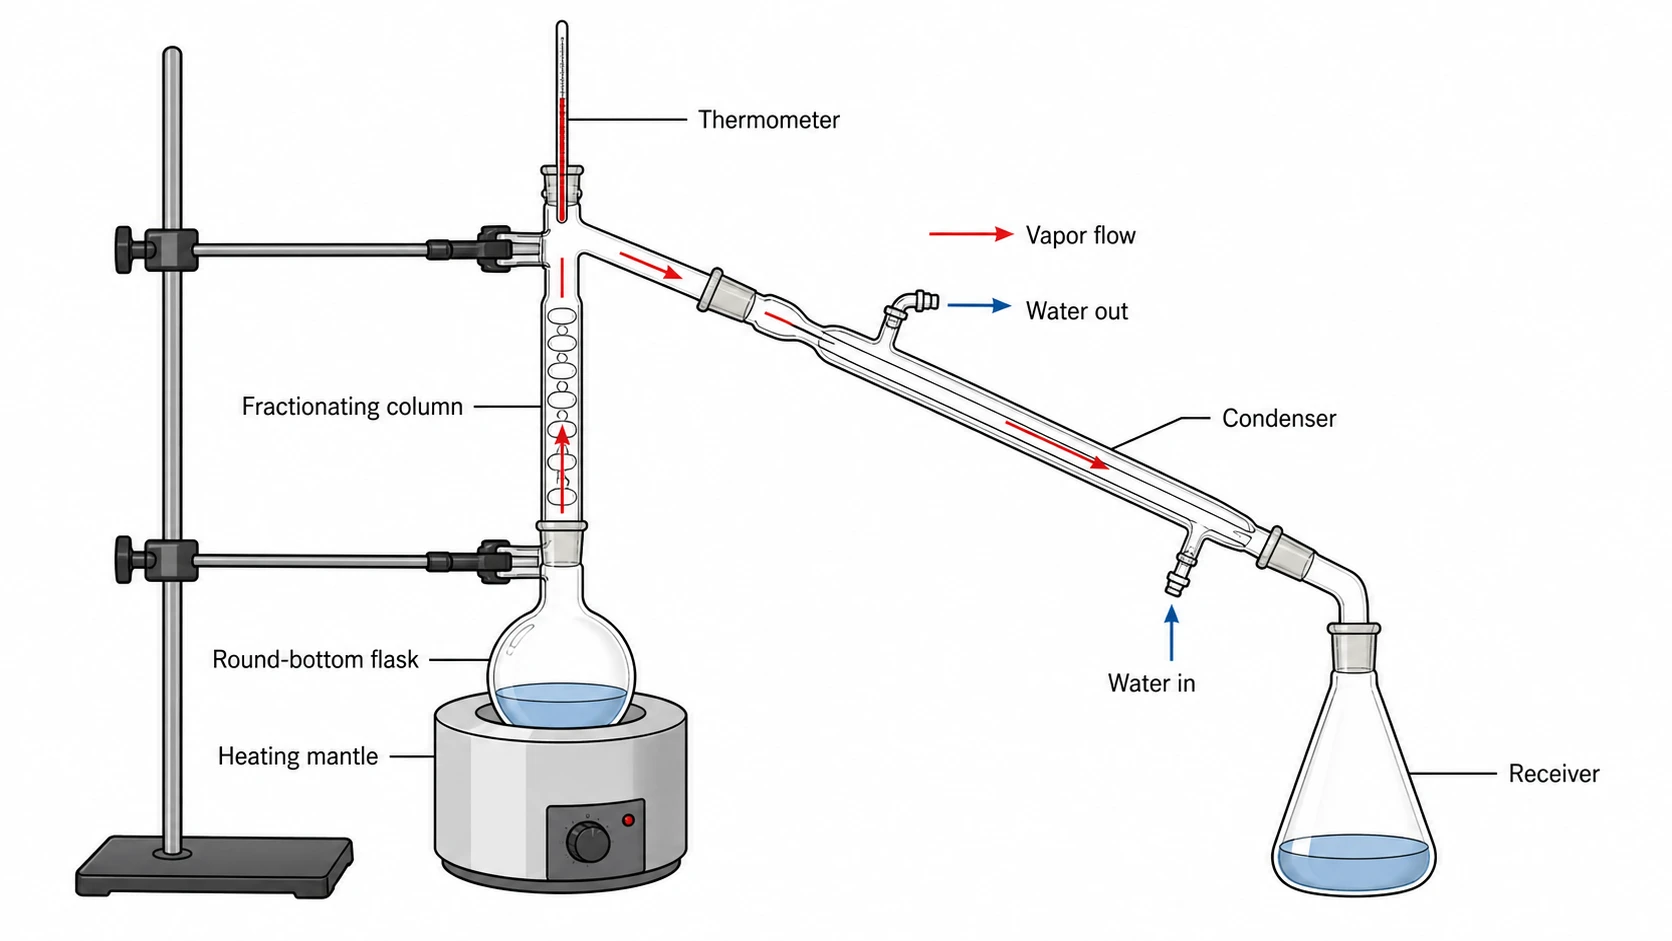 Lab Diagram Maker
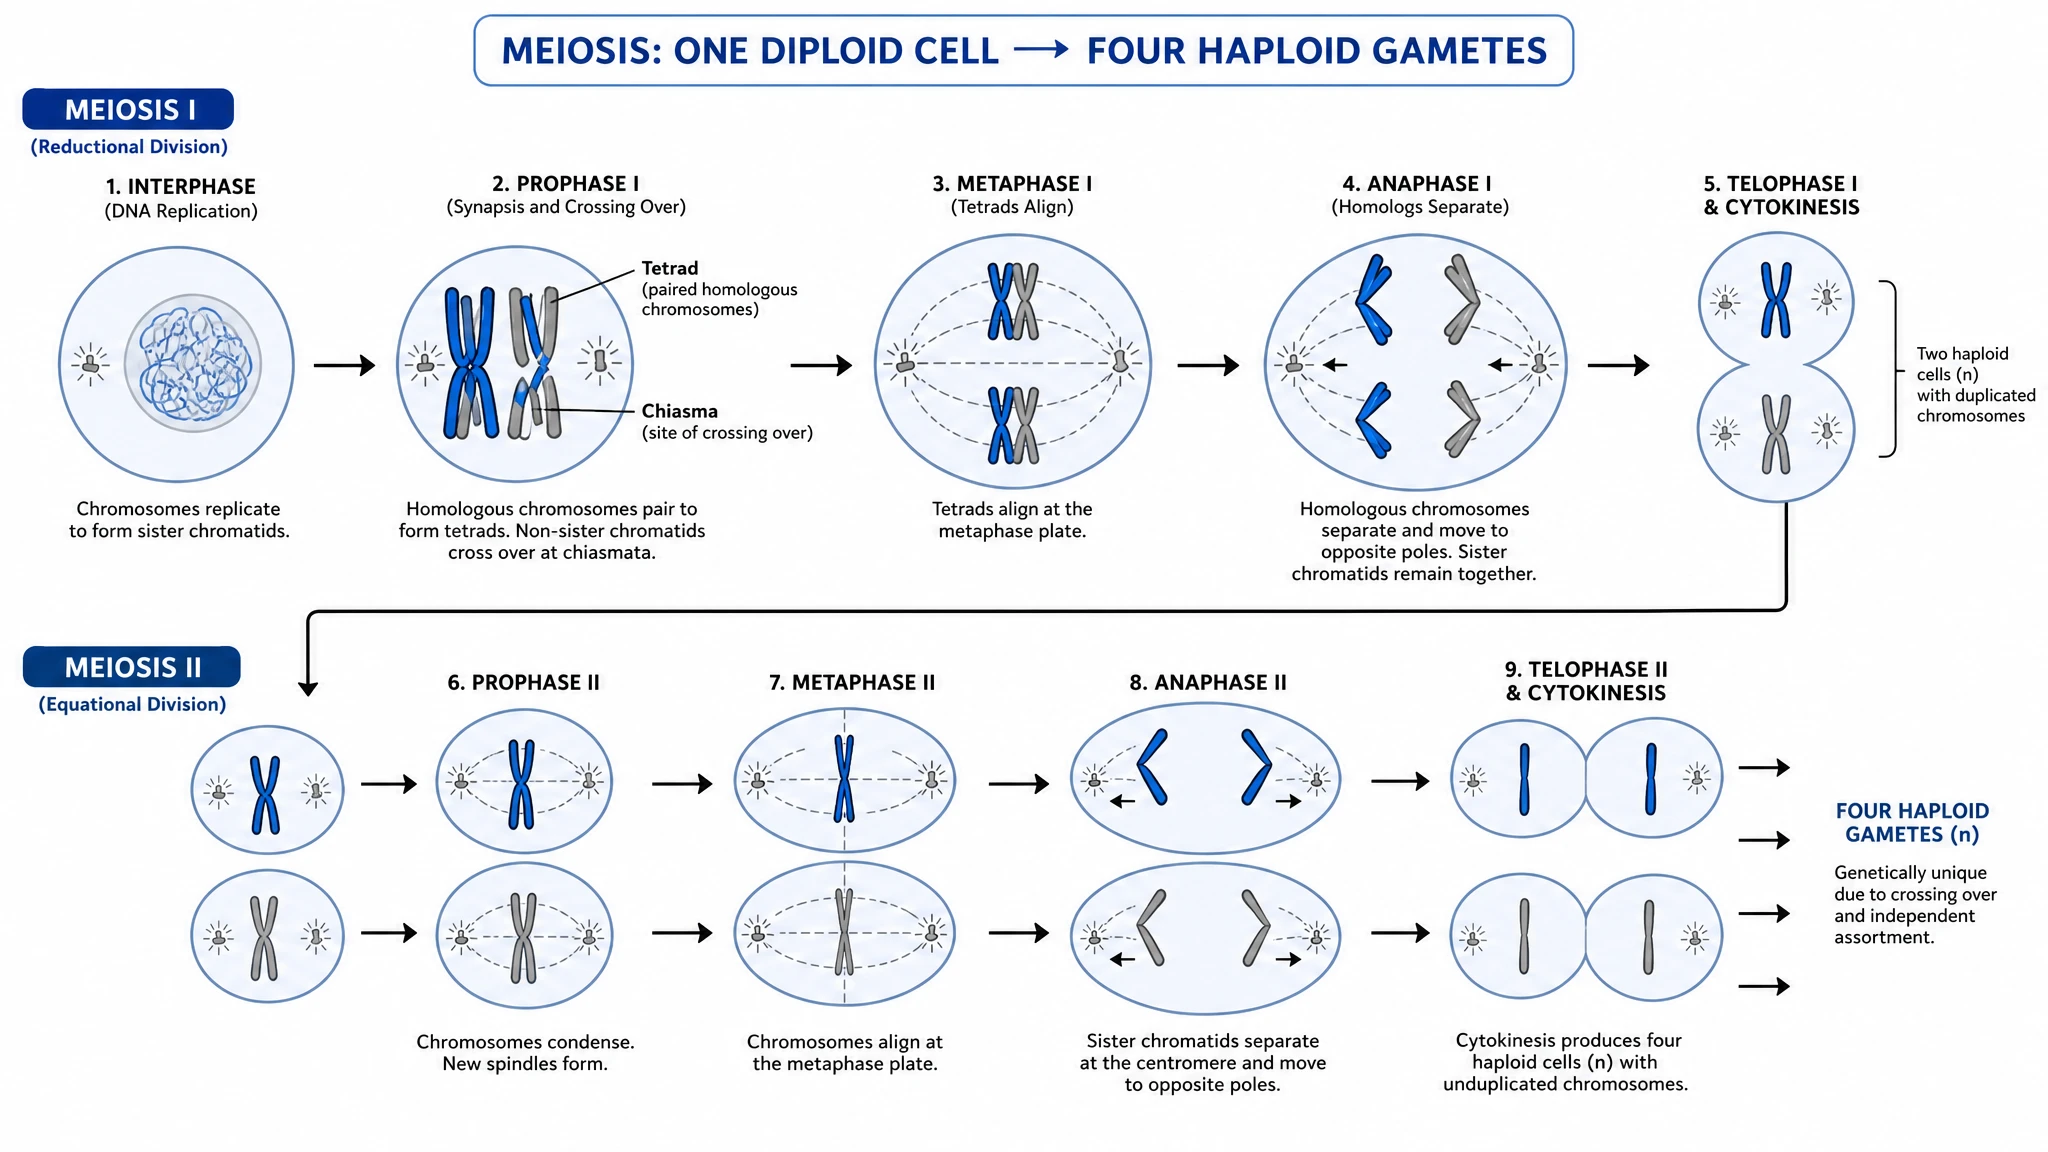 Meiosis Diagram Generator
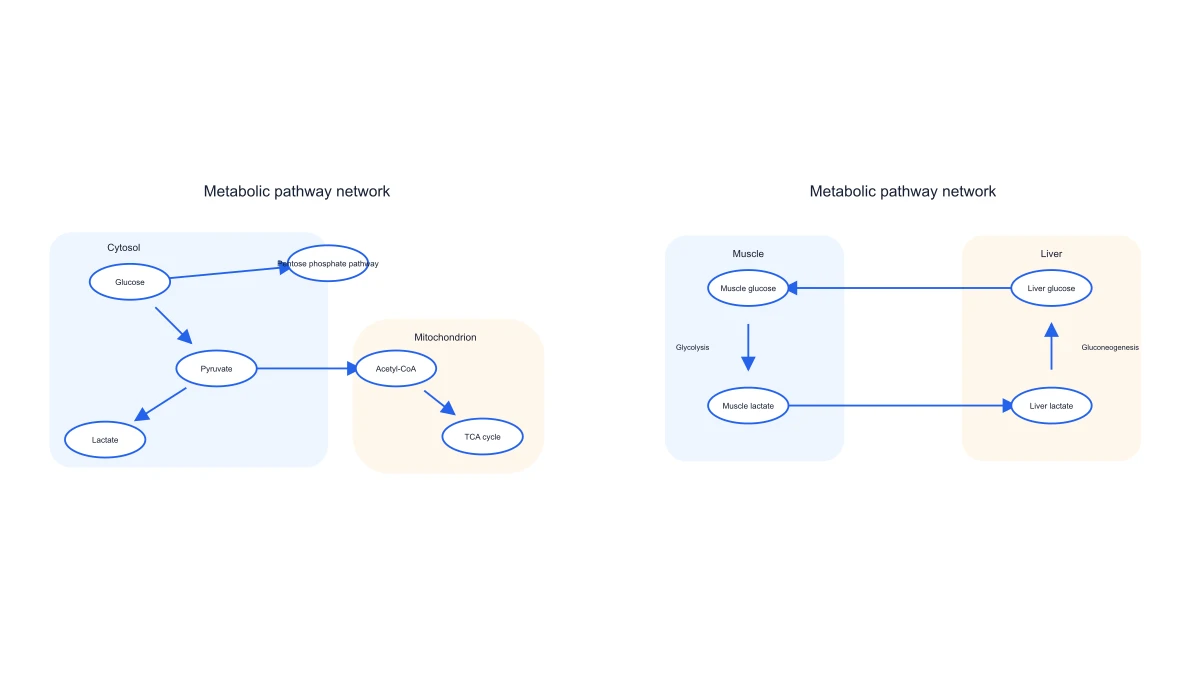 Metabolic Pathway Diagram Generator
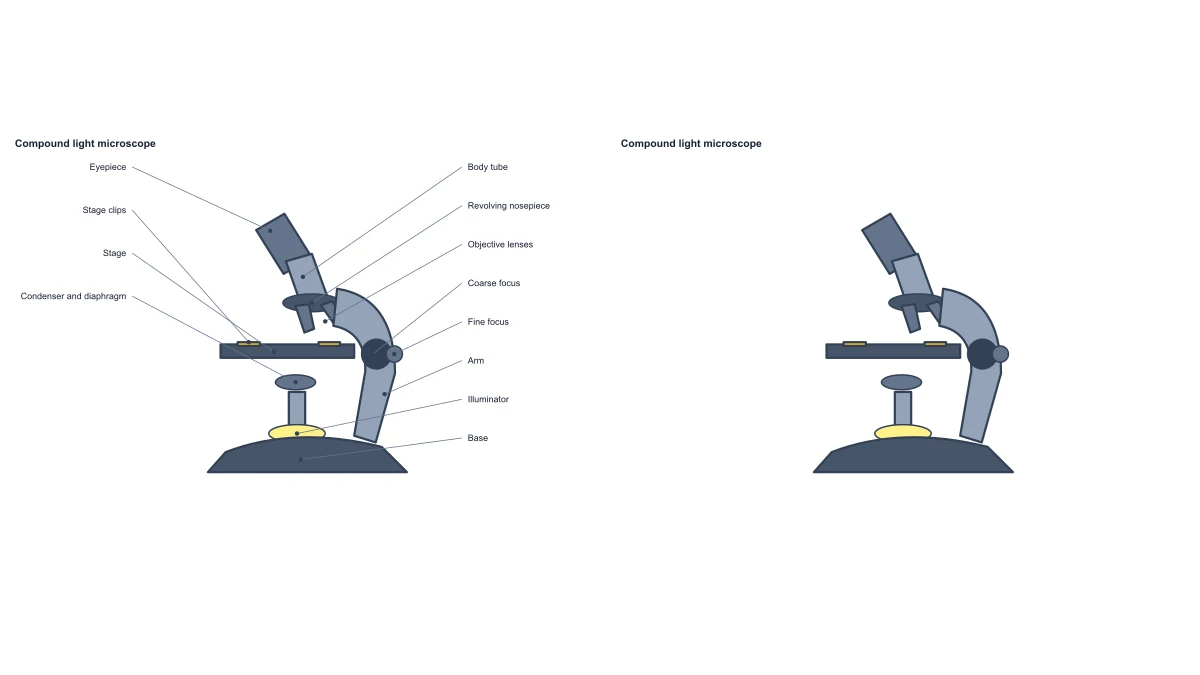 Microscope Diagram
 Molecular Orbital Diagram Generator
 Nitrogen Cycle Diagram Generator
 Pedigree Chart Maker
 Phospholipid Diagram Generator
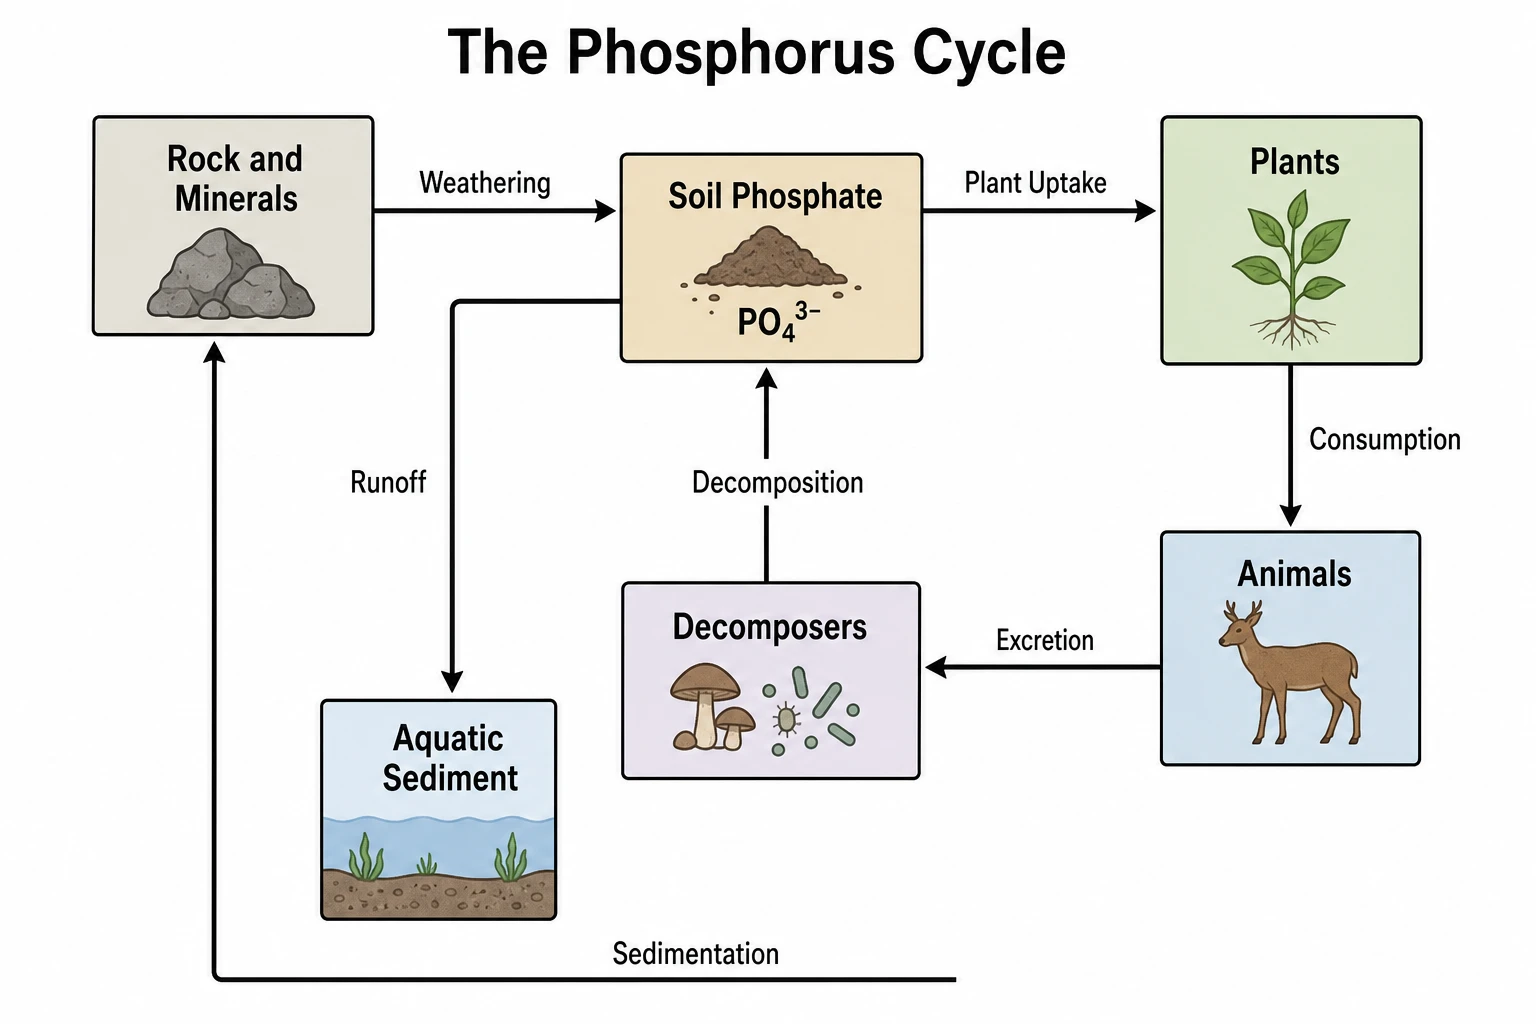 Phosphorus Cycle Diagram Generator
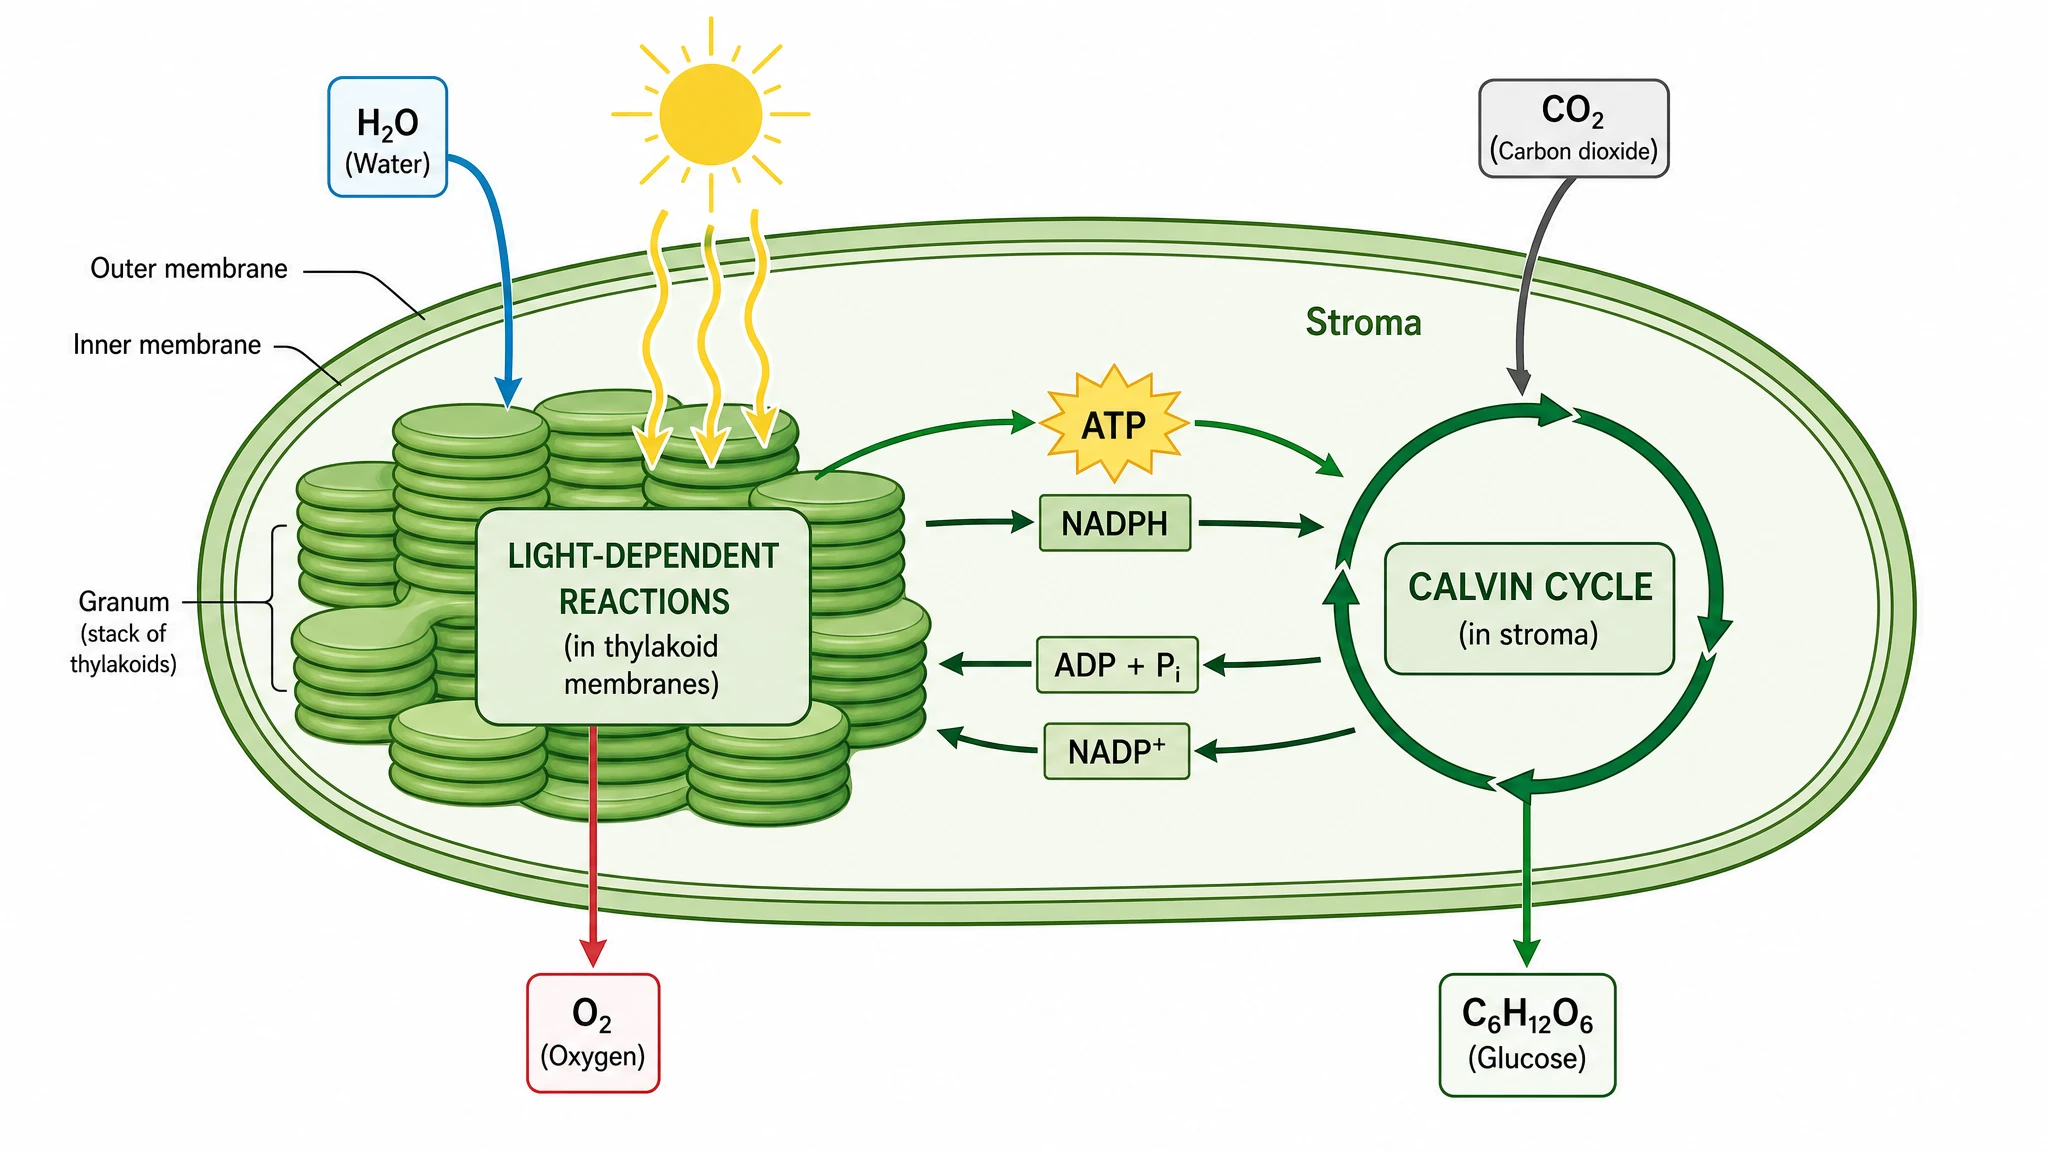 Photosynthesis Diagram Generator
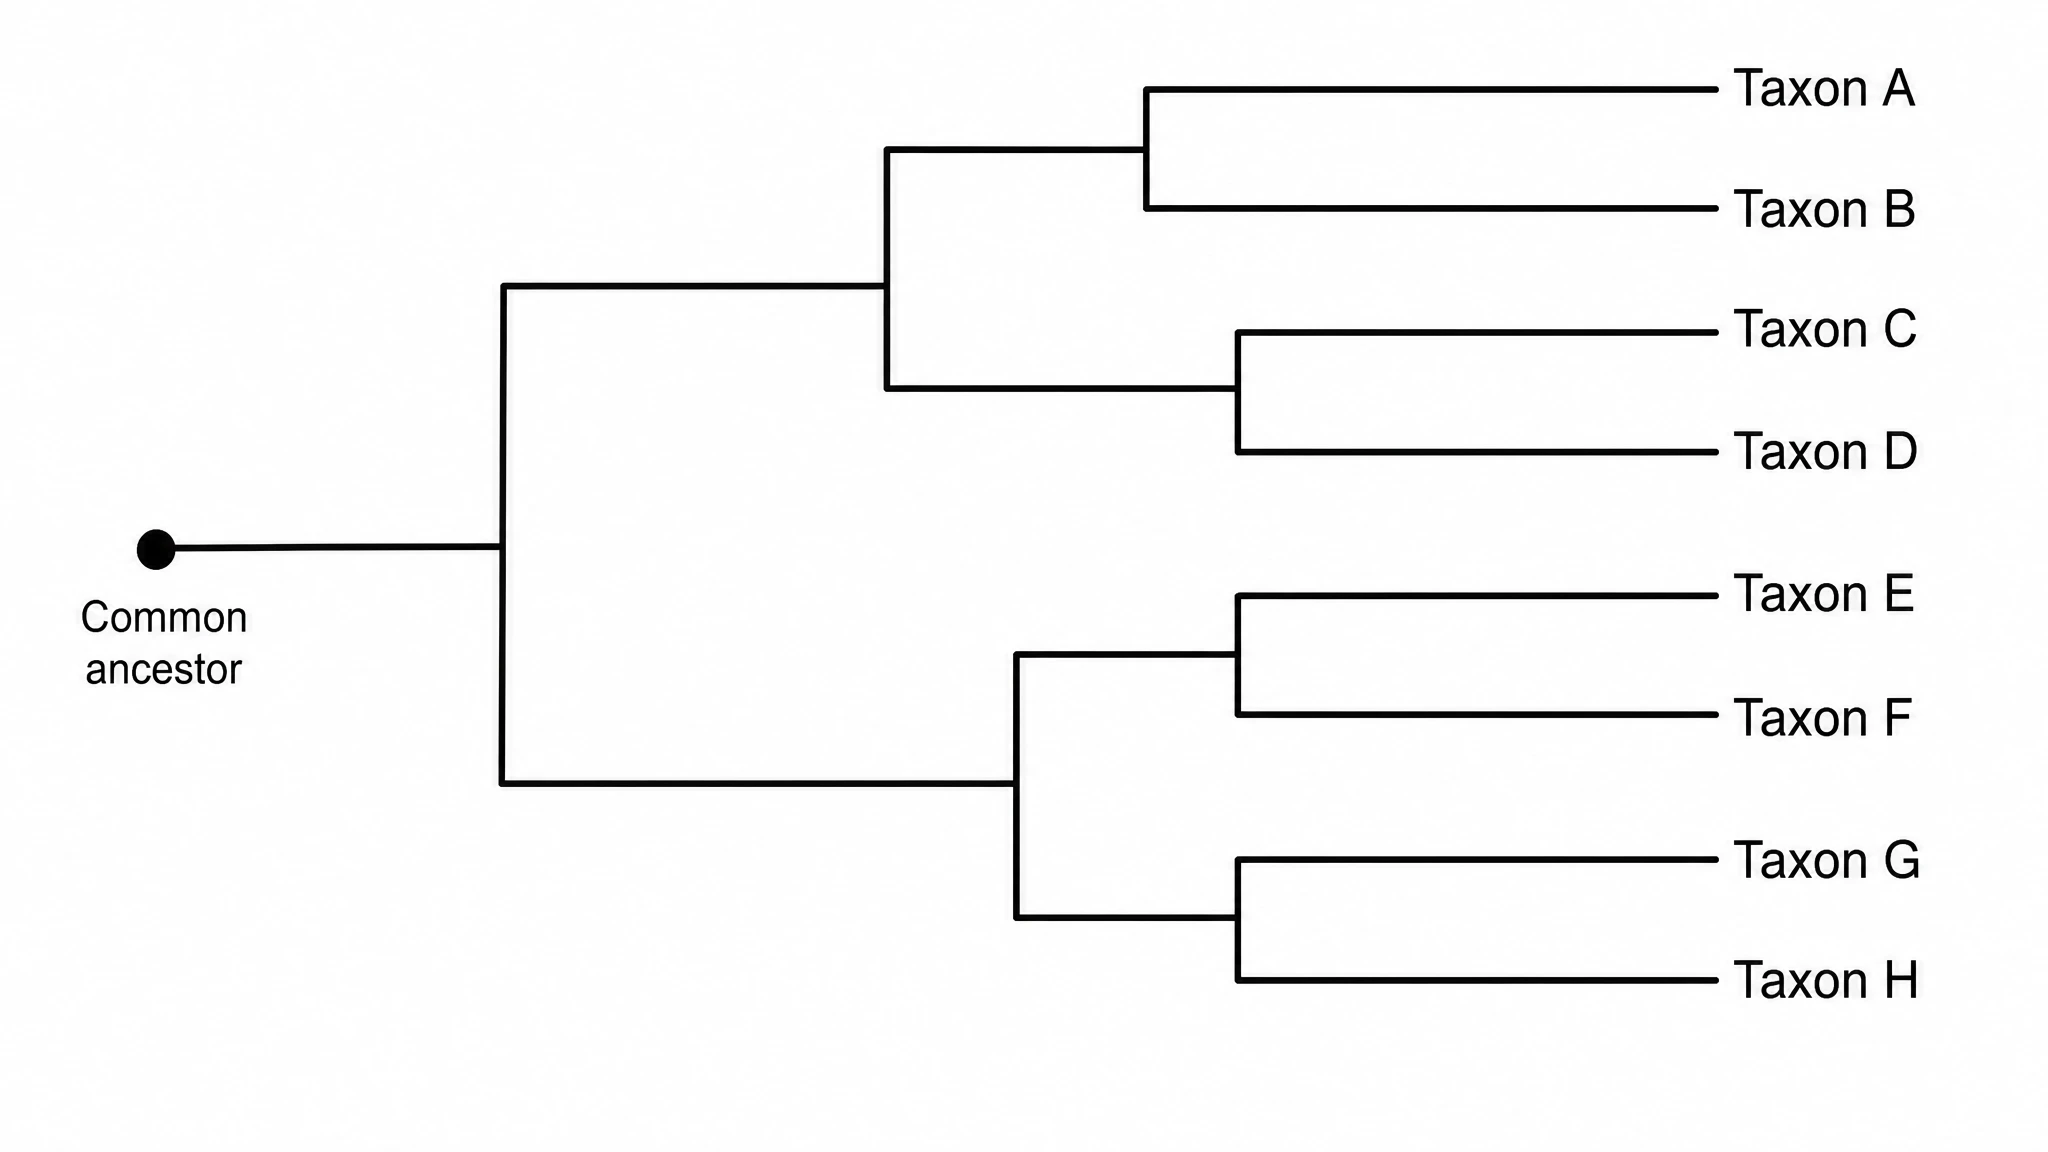 Phylogenetic Tree Maker
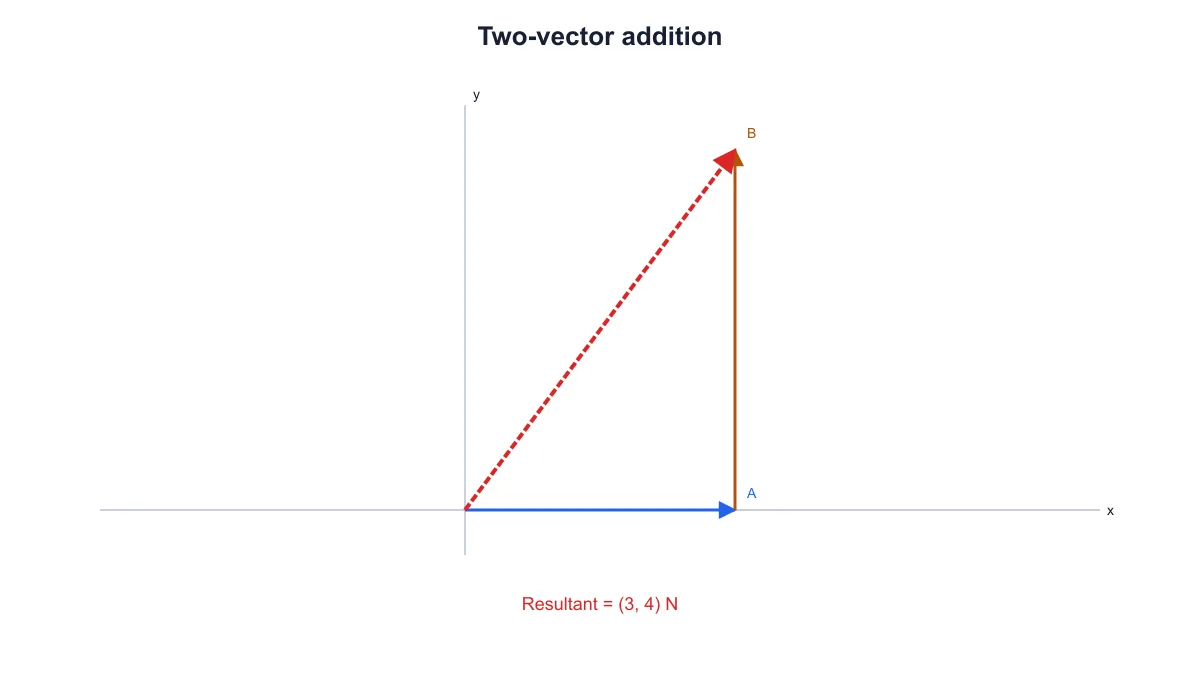 Physics Vector Diagram Maker
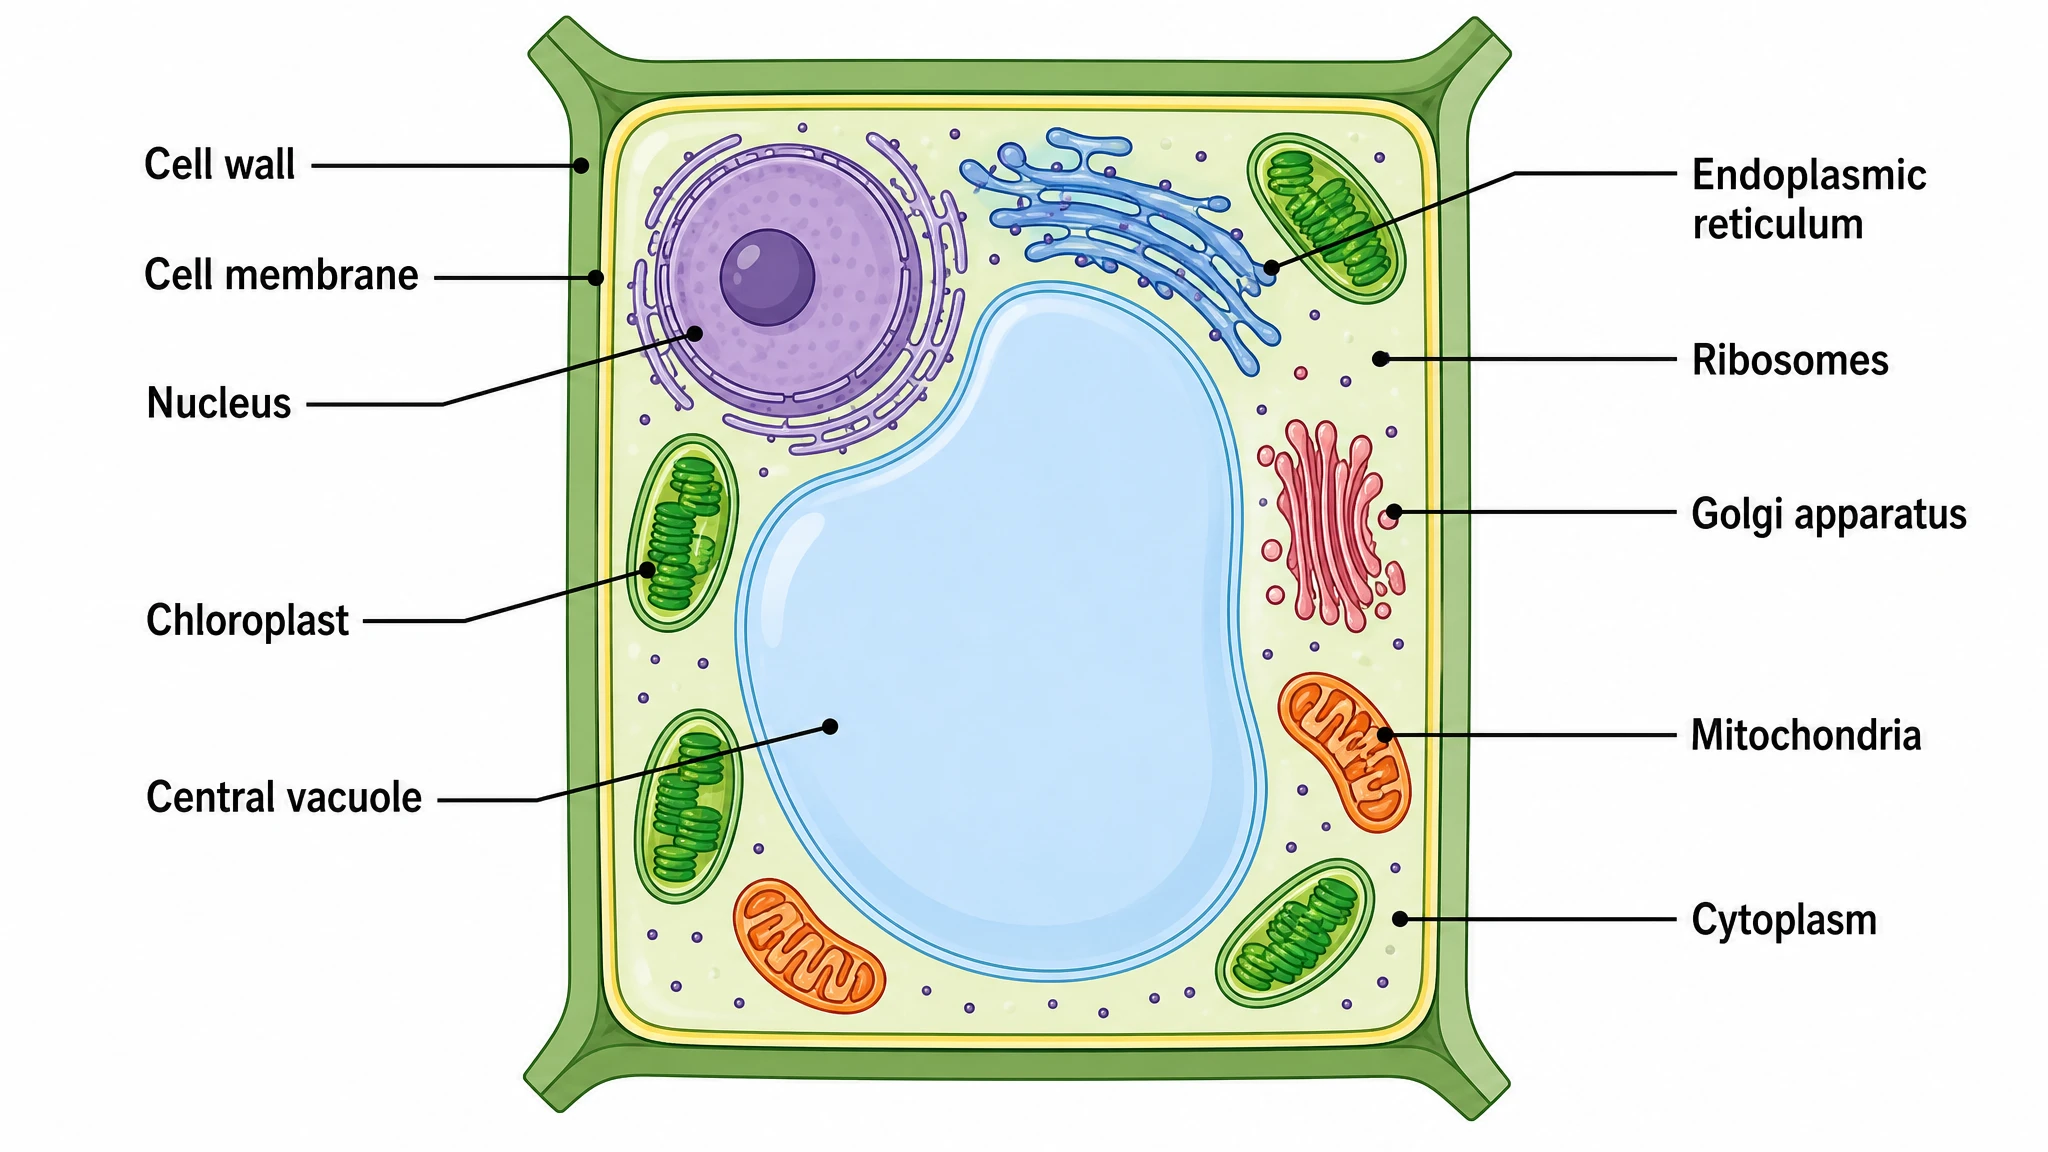 Plant Cell Diagram Generator
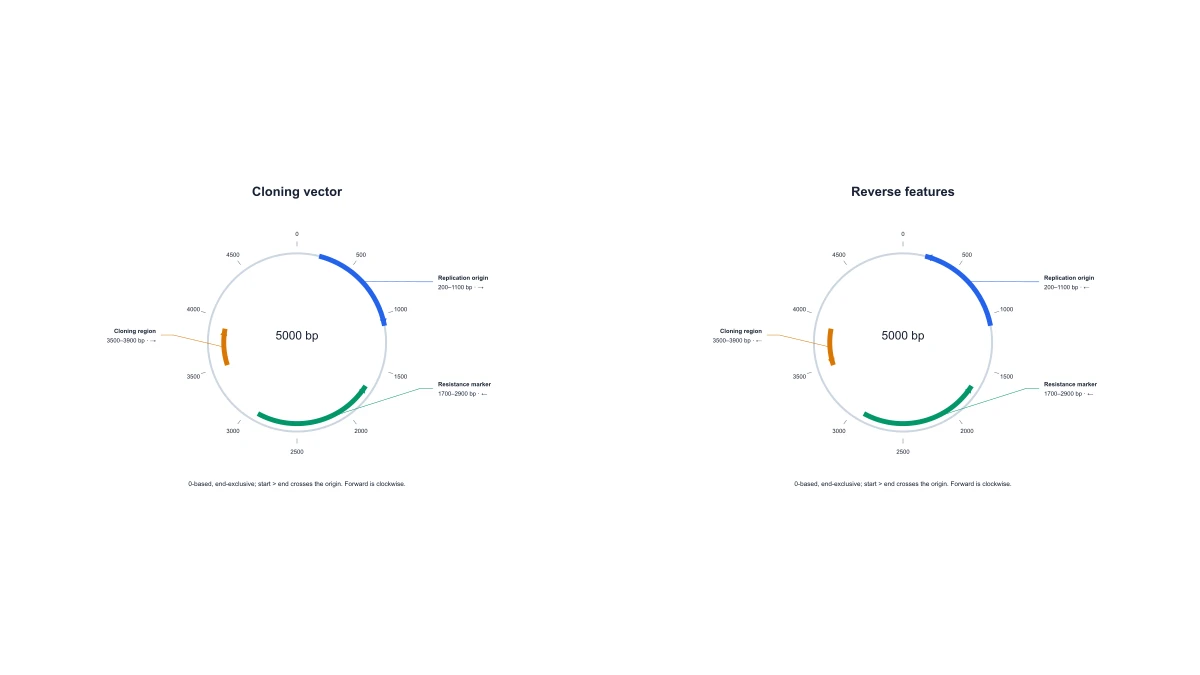 Plasmid Map Maker
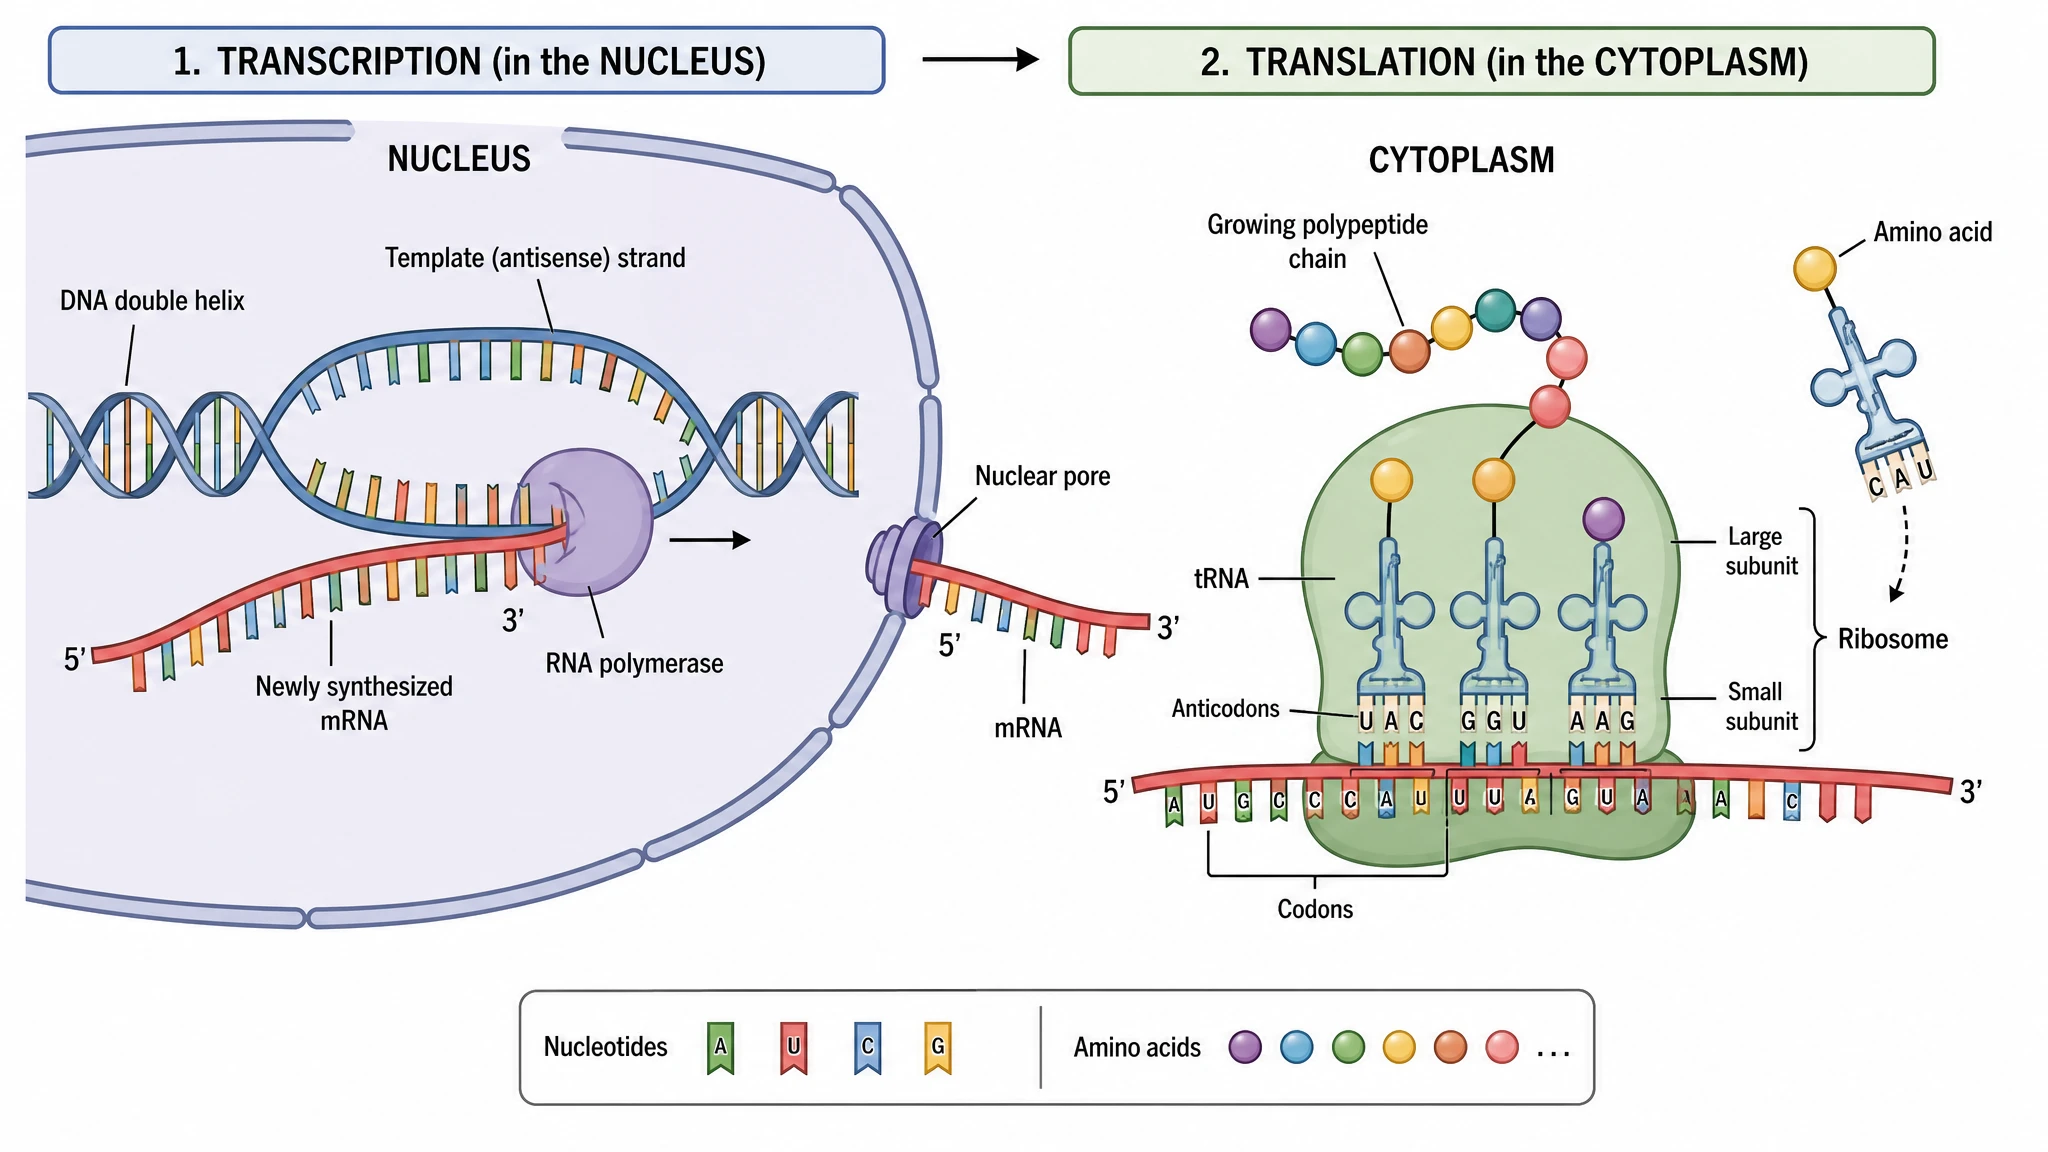 Protein Synthesis Diagram Generator
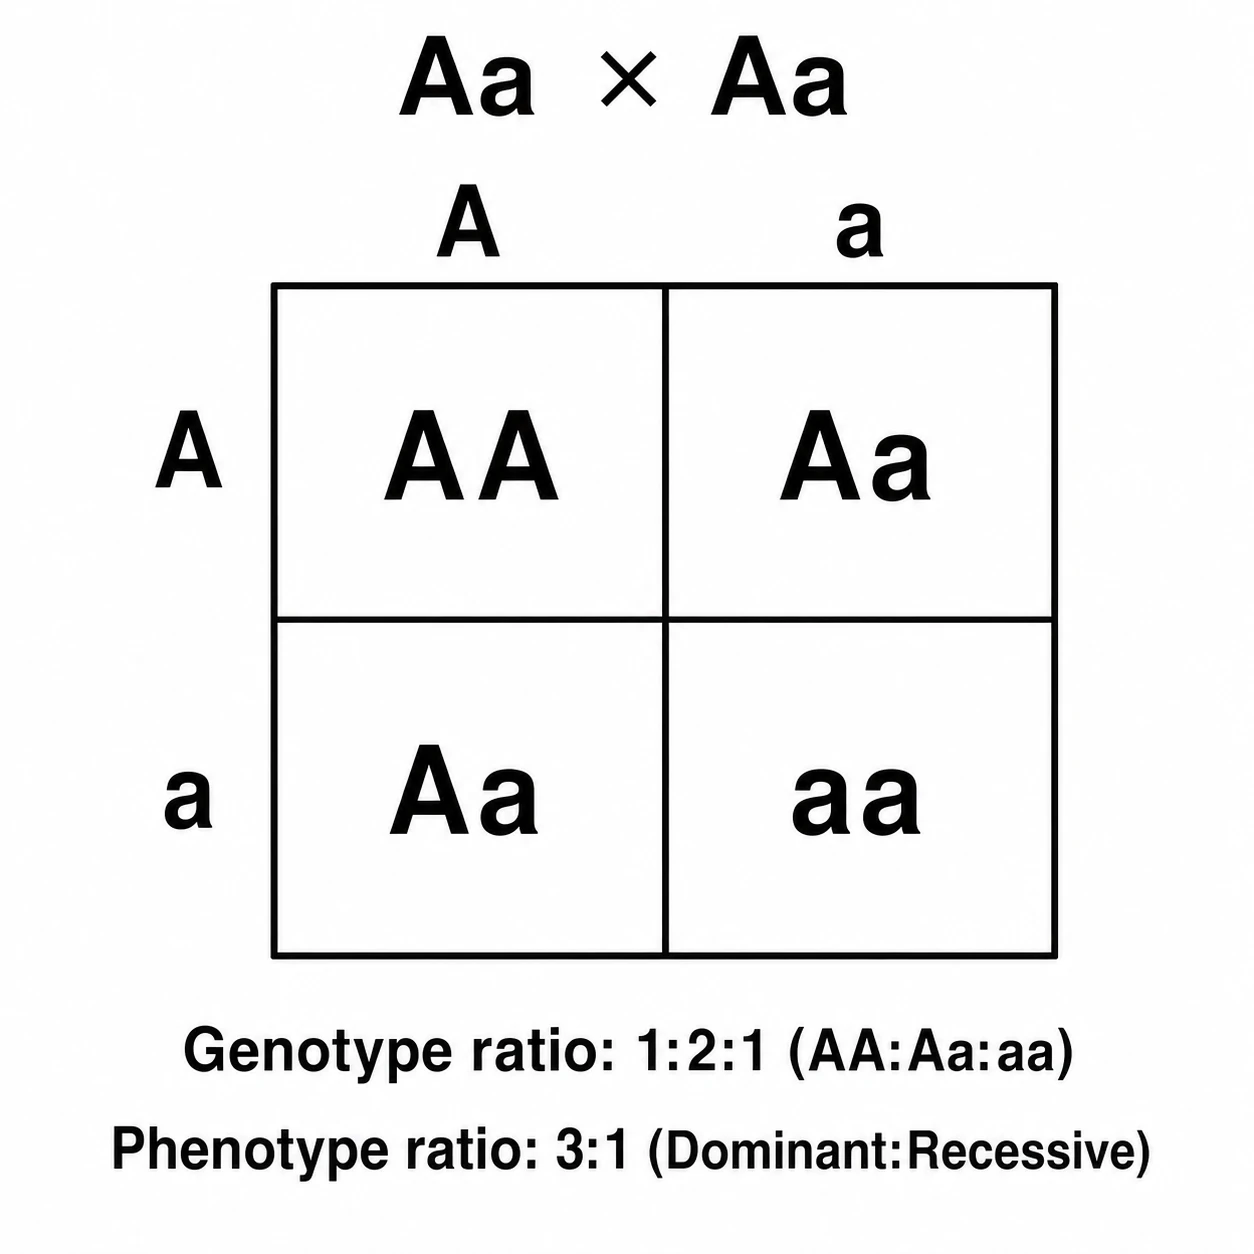 Punnett Square Maker
 Ray Diagram Maker
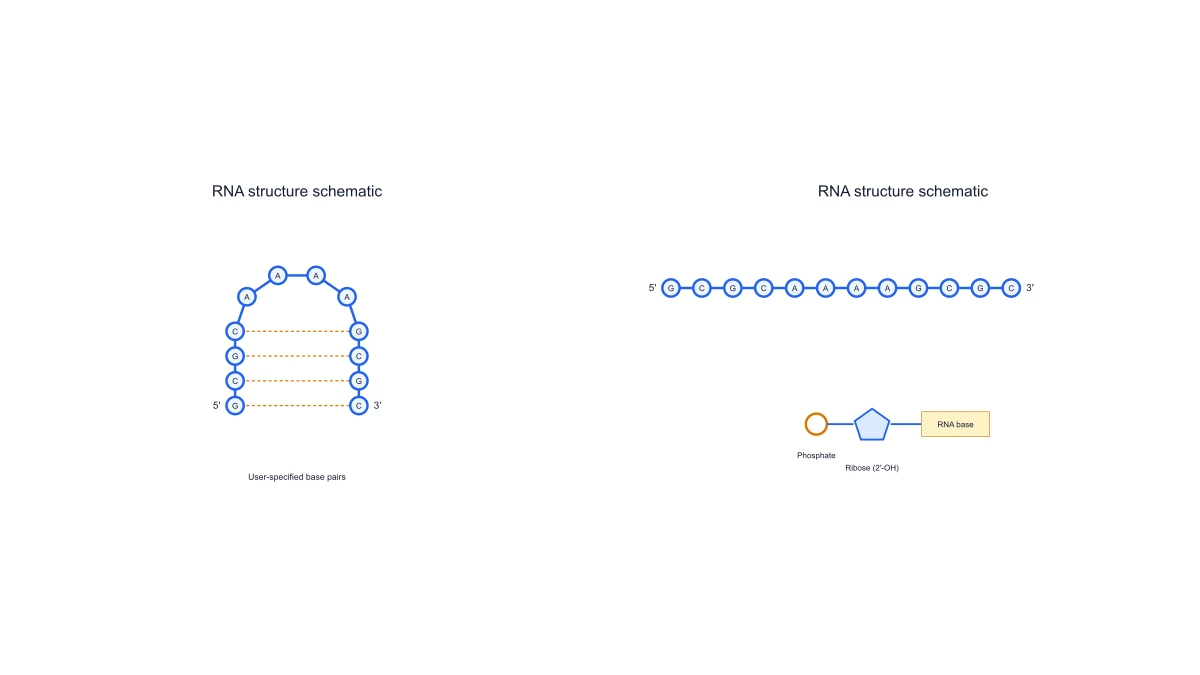 RNA Structure Diagram Generator
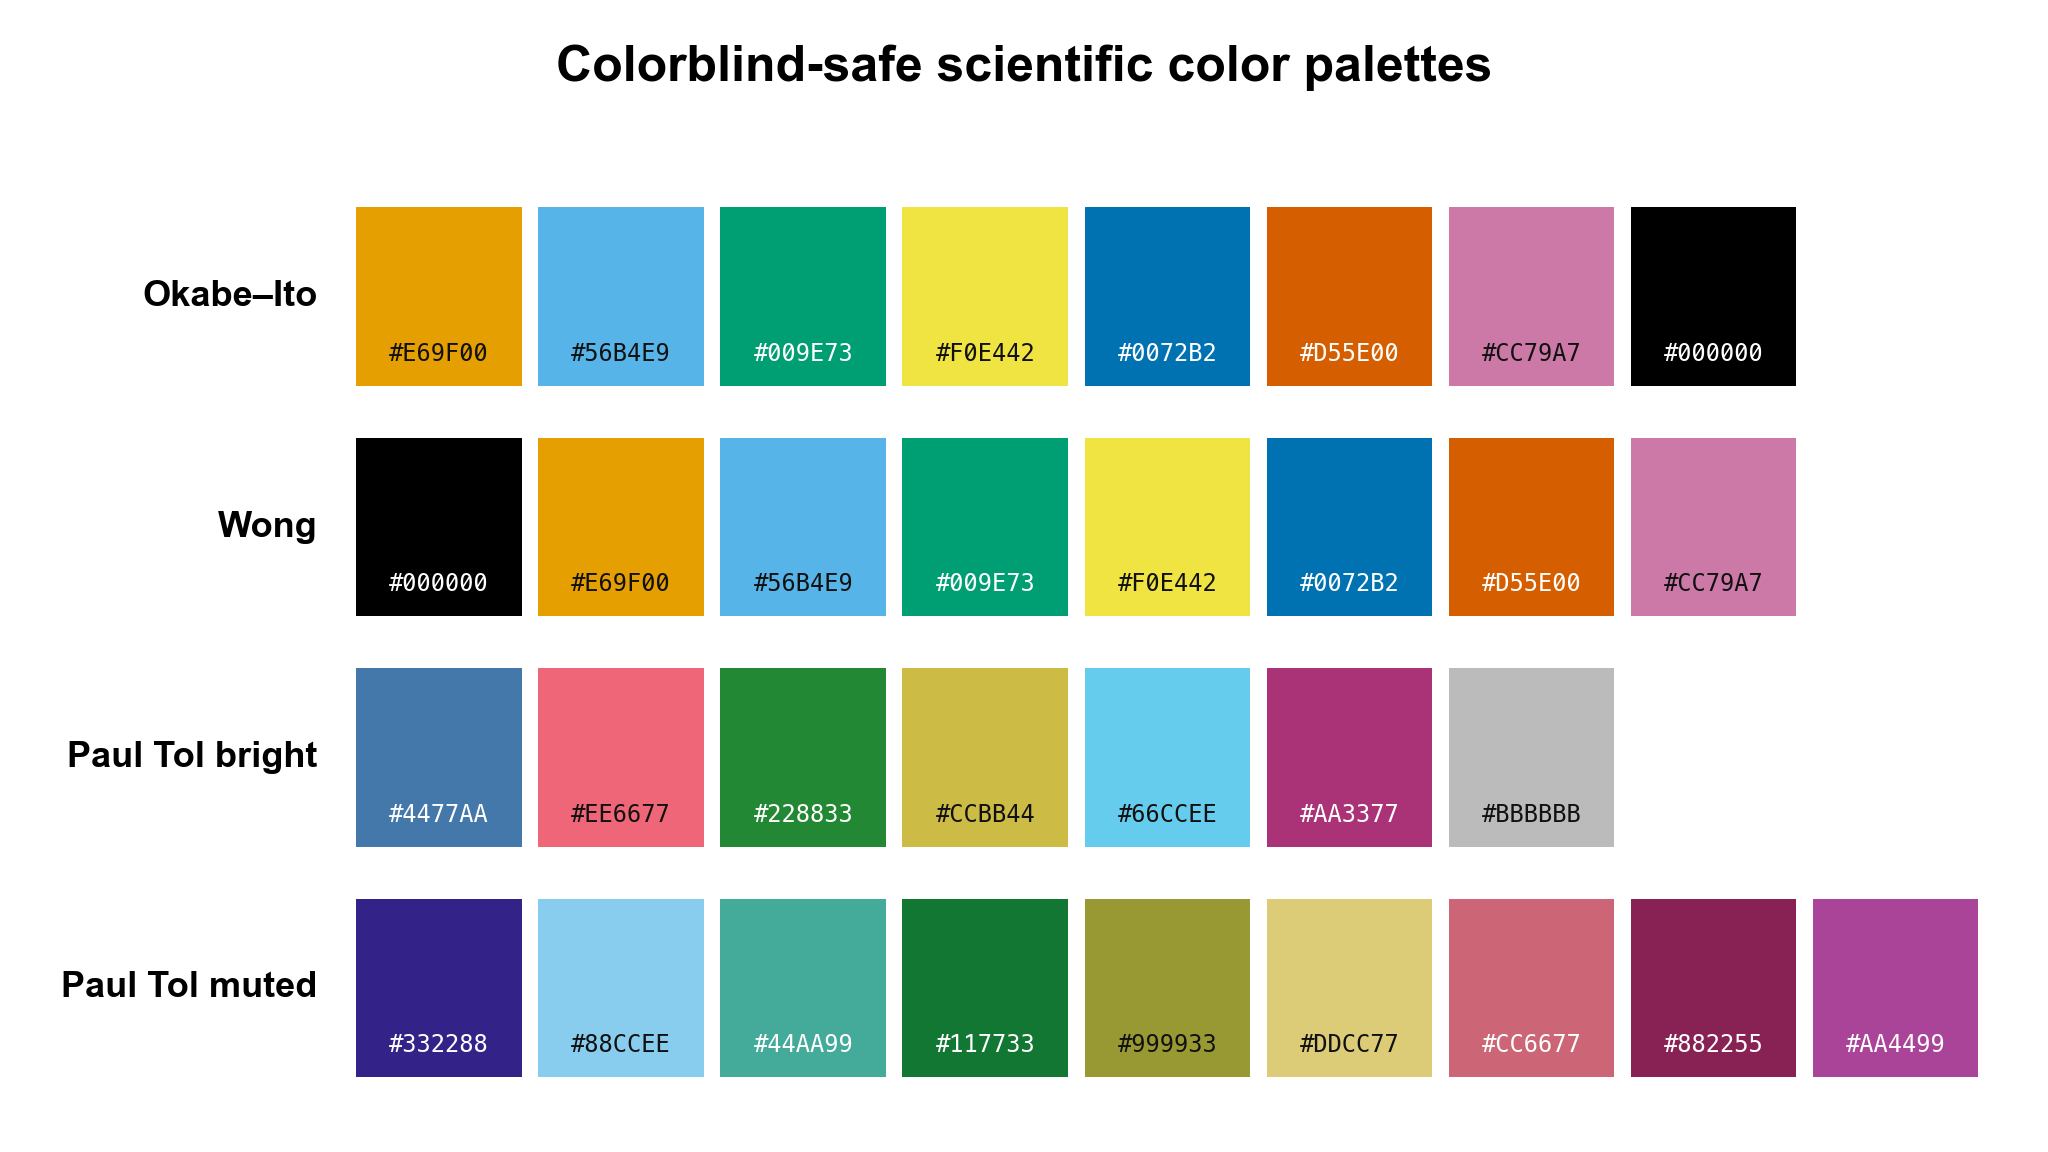 Scientific Color Palette Generator
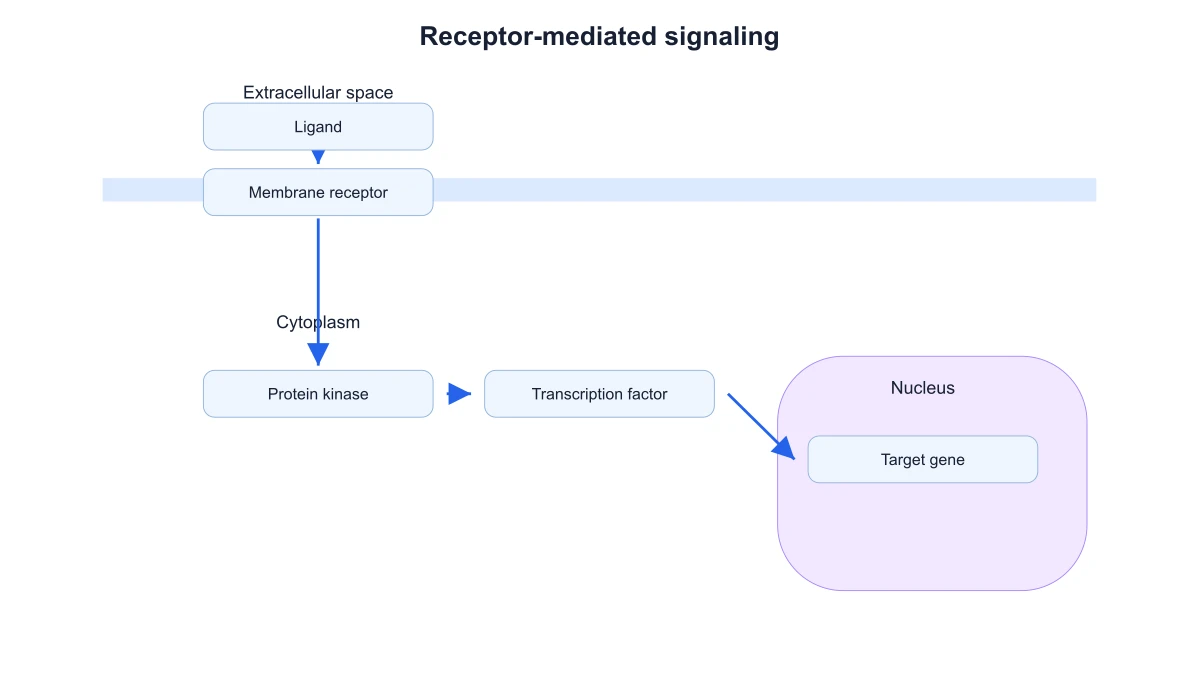 Signaling Pathway Diagram Generator
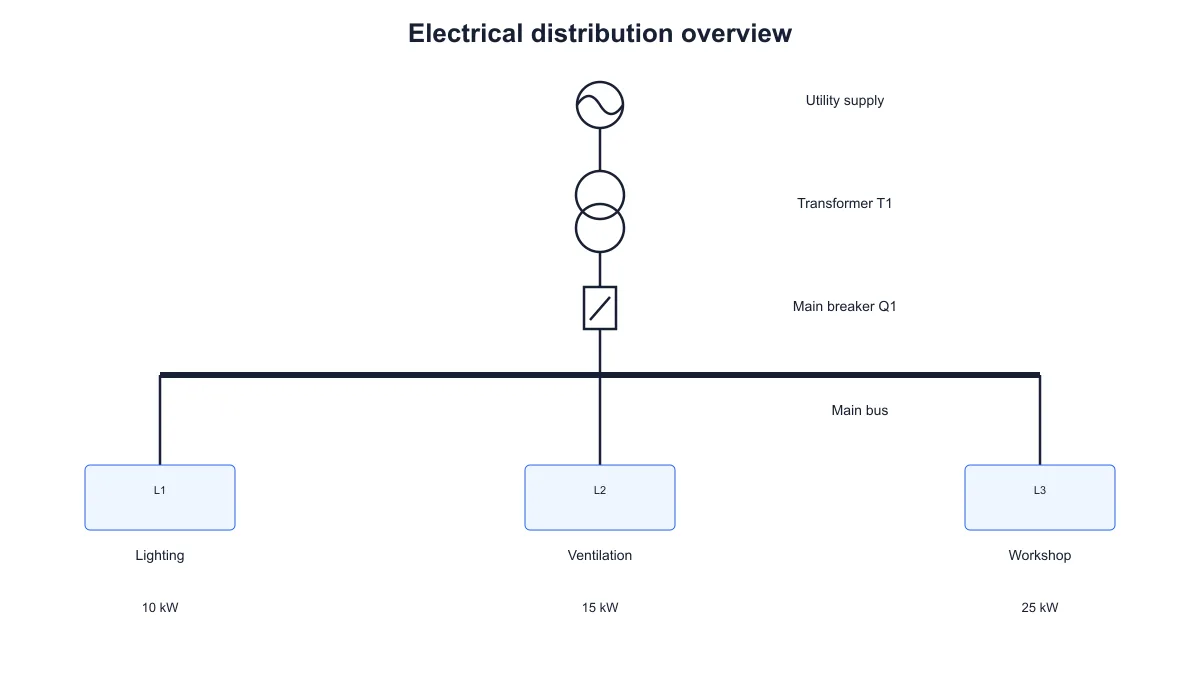 Single Line Diagram Generator
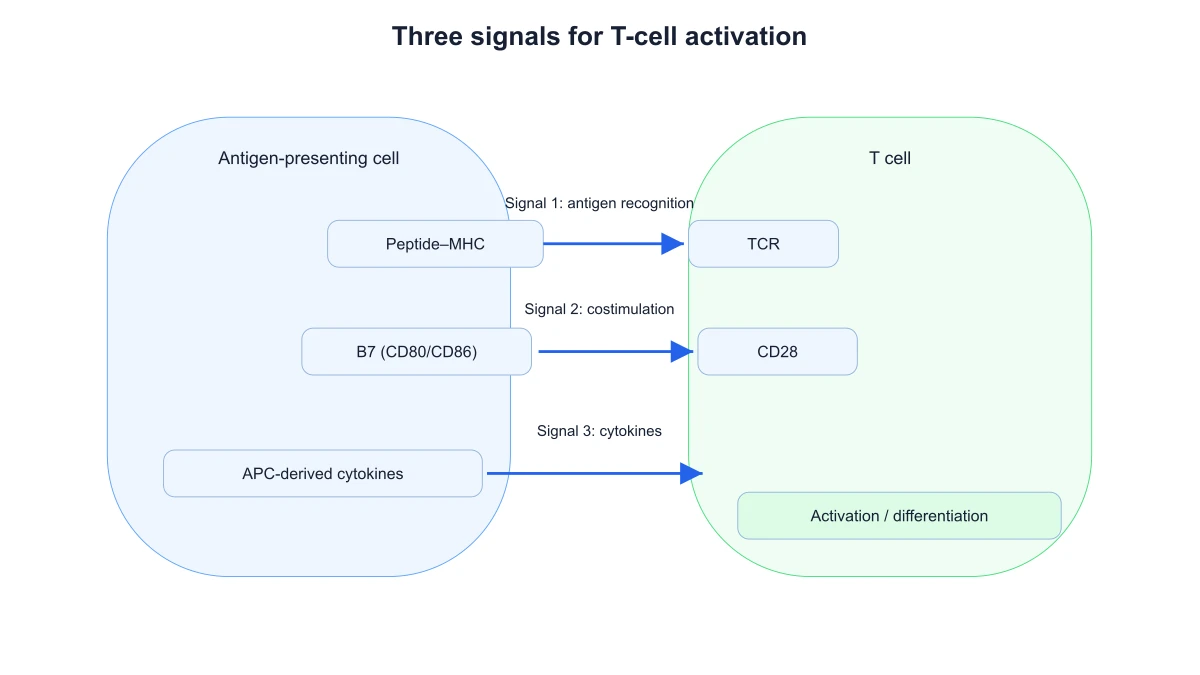 T-Cell Activation Diagram Generator
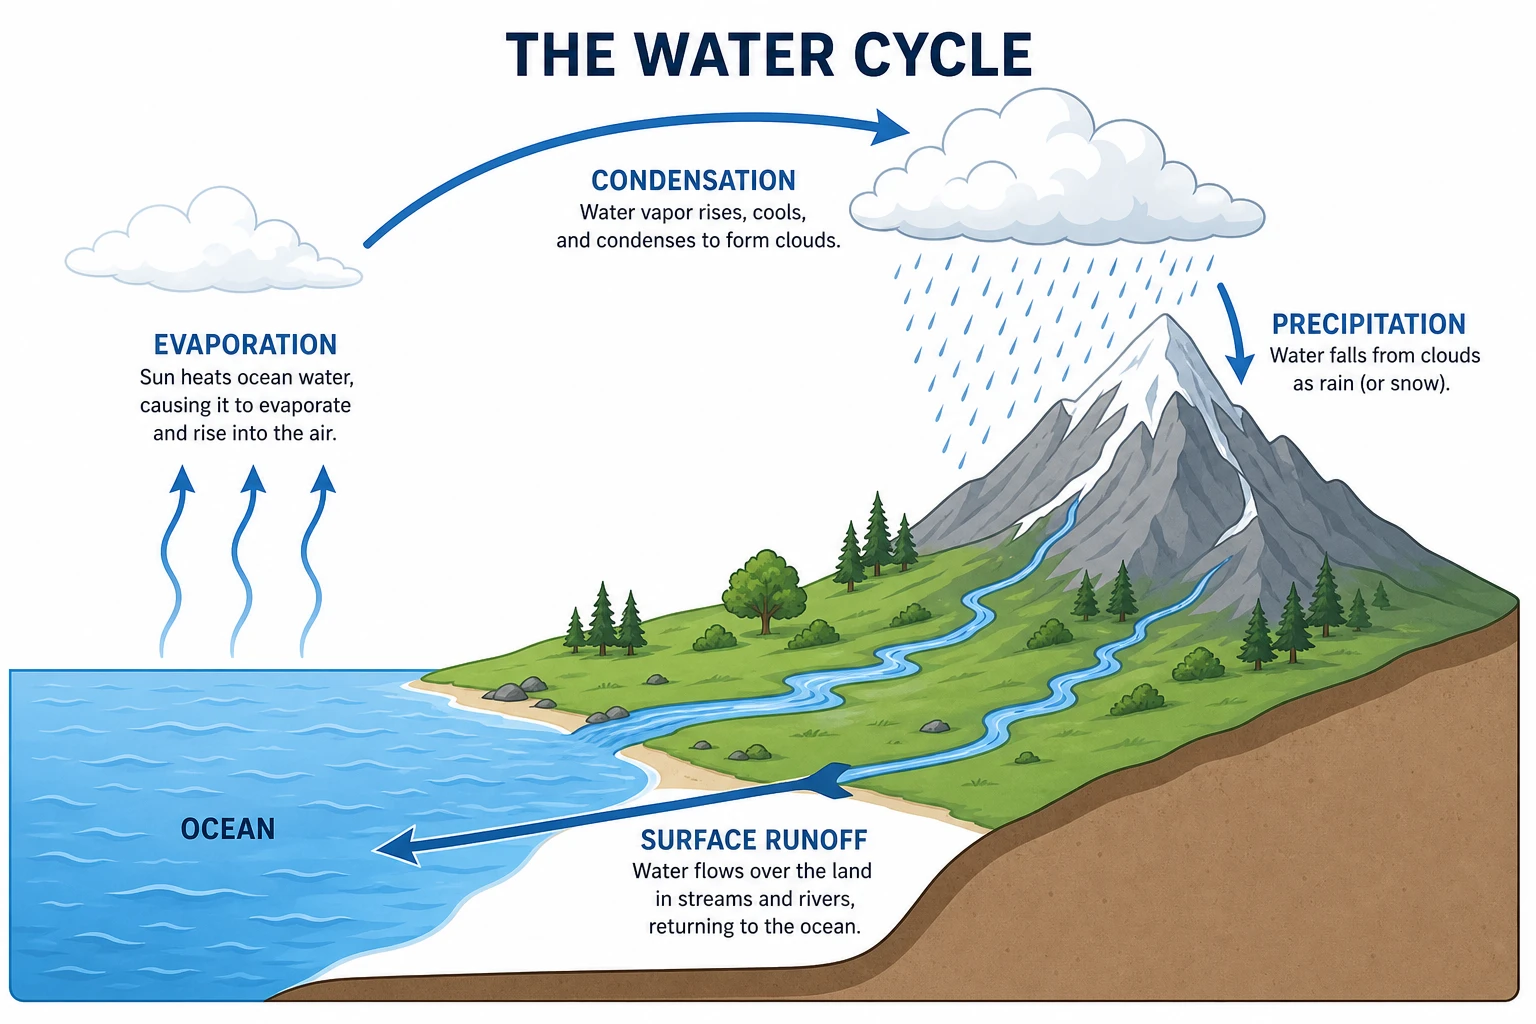 Water Cycle Diagram Generator
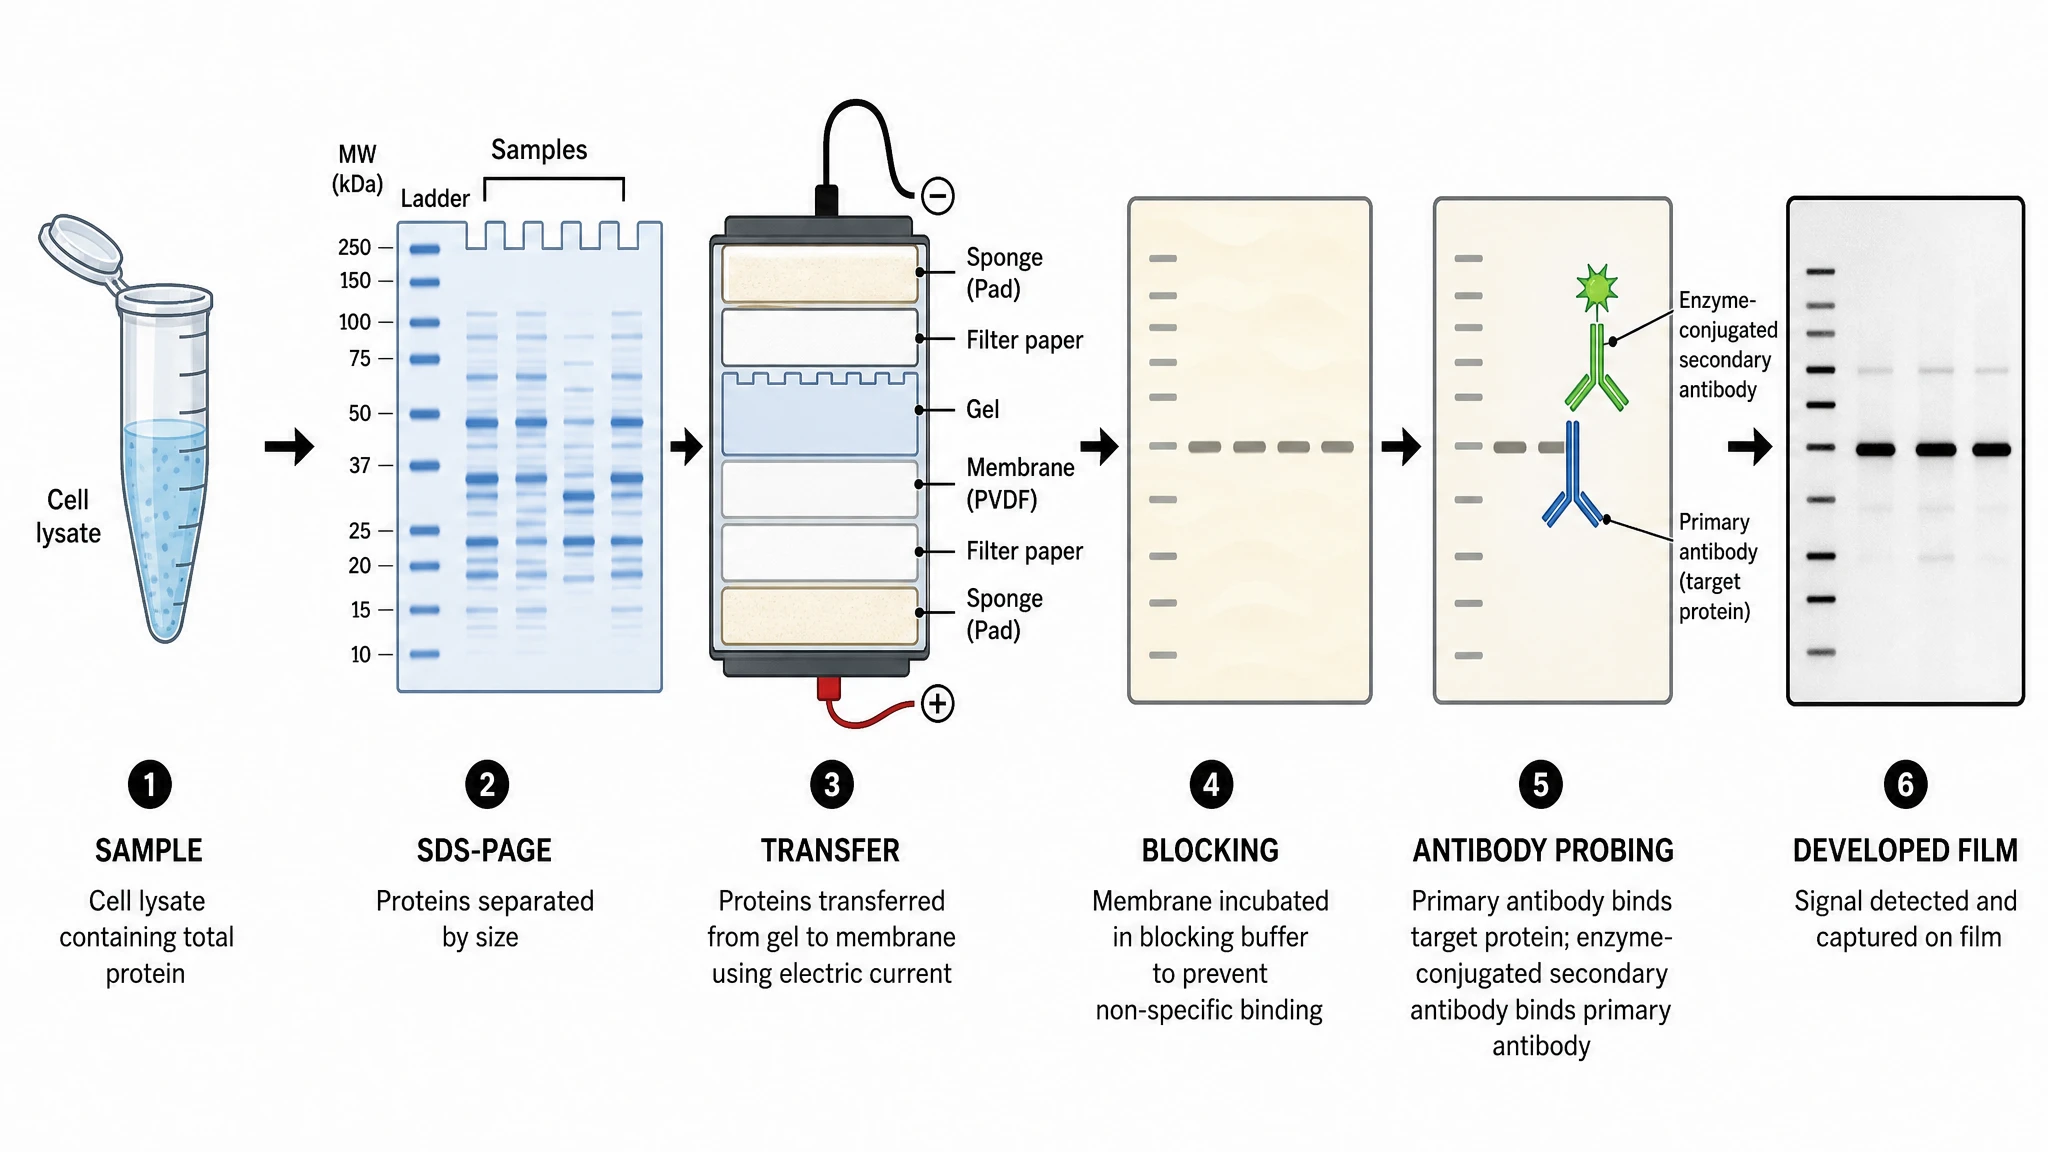 Western Blot Diagram Generator
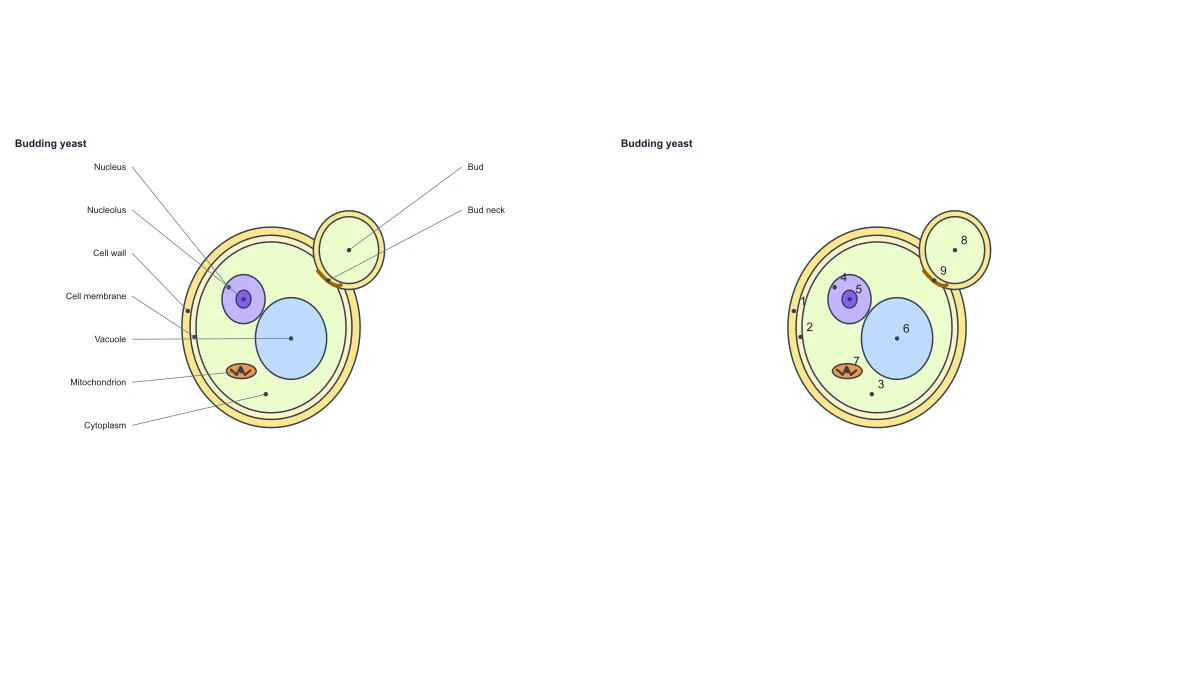 Fungal Cell Diagram — Free Labeled Yeast Editor
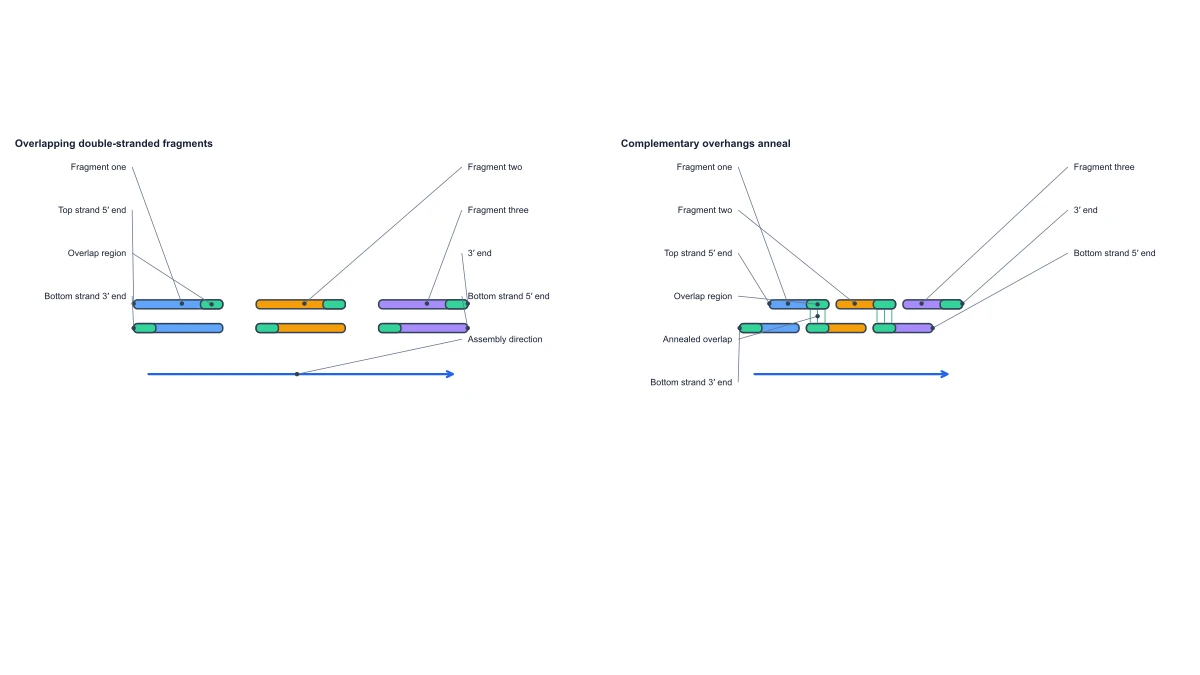 Gibson Assembly Diagram — Free Mechanism Editor
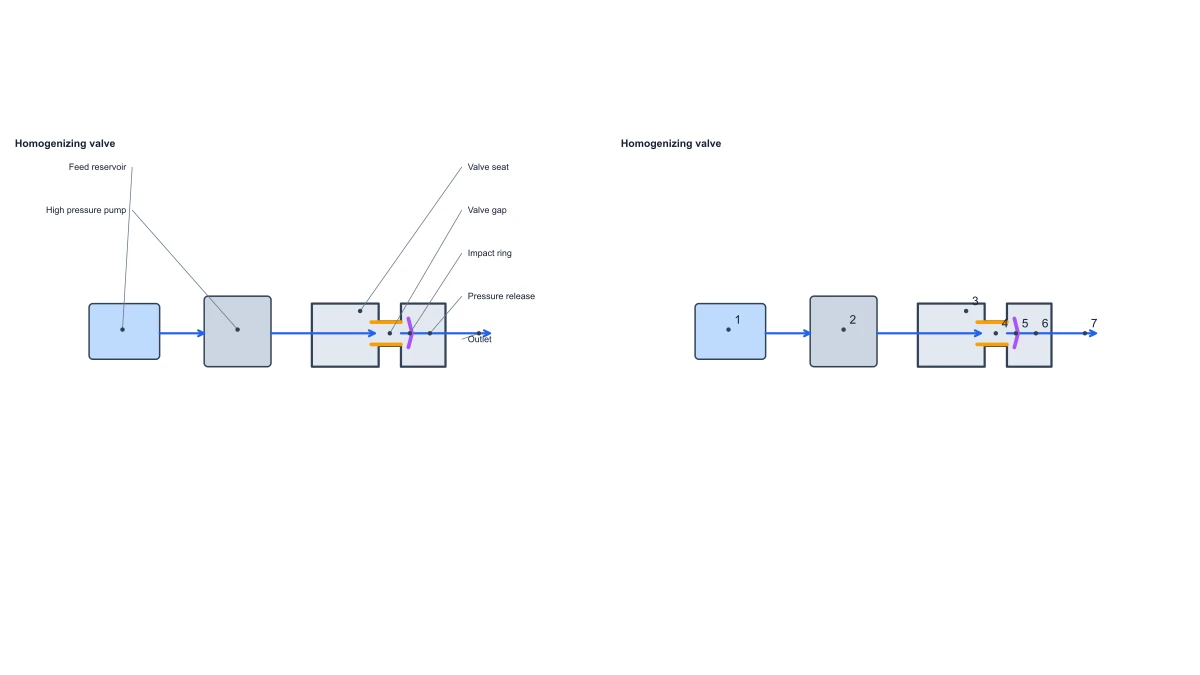 High Pressure Homogenizer Working Principle — Free Diagram
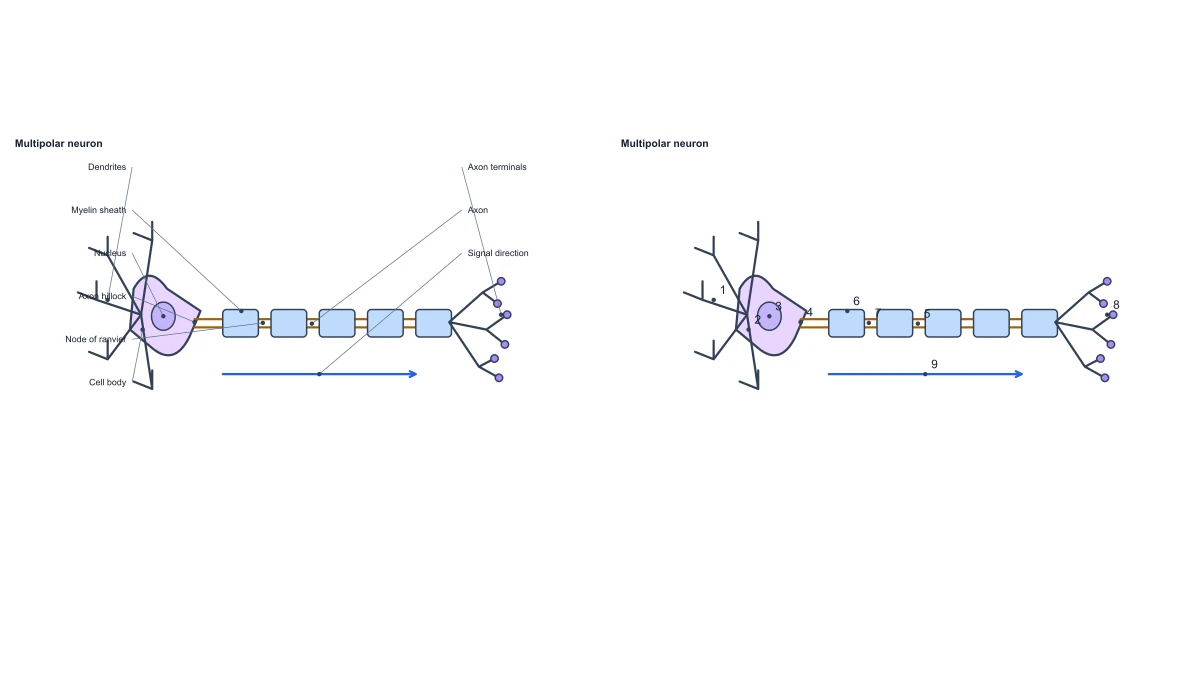 Neuron Diagram
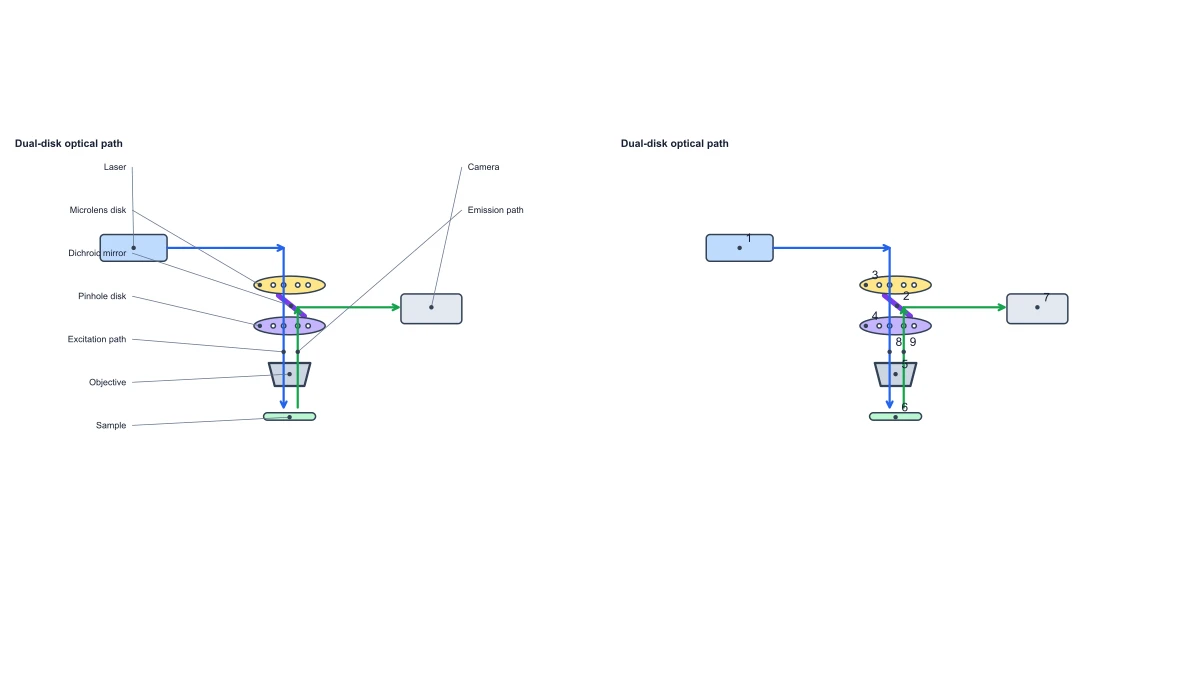 Spinning Disk Confocal Optical Diagram
 Swan Neck Flask Experiment — Free Diagram Editor
Statistical charts and graphs
34 tools Bode Plot Generator
 Spider Chart Maker
 Kaplan-Meier Survival Curve
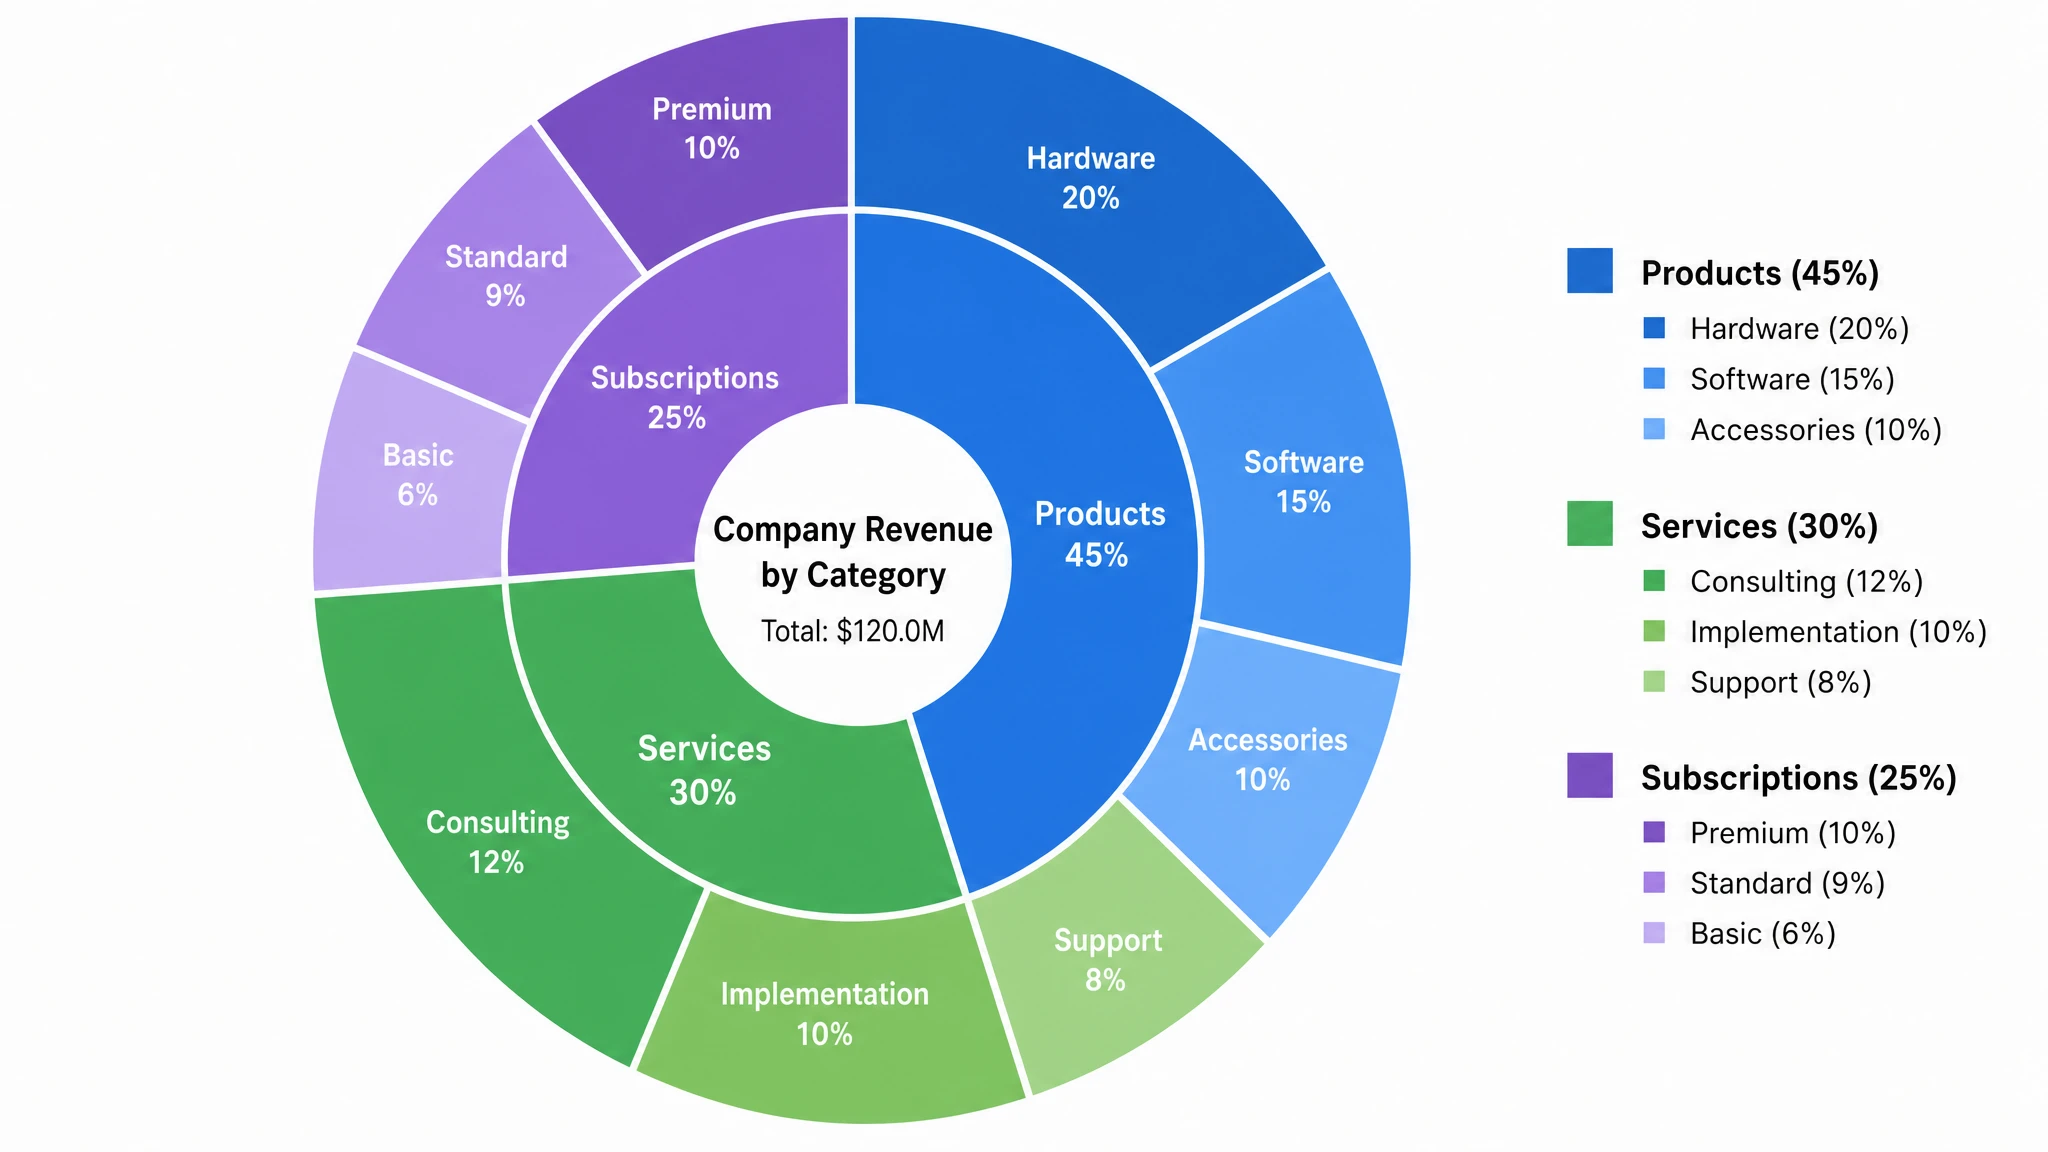 Multi-Layer Pie Chart Maker
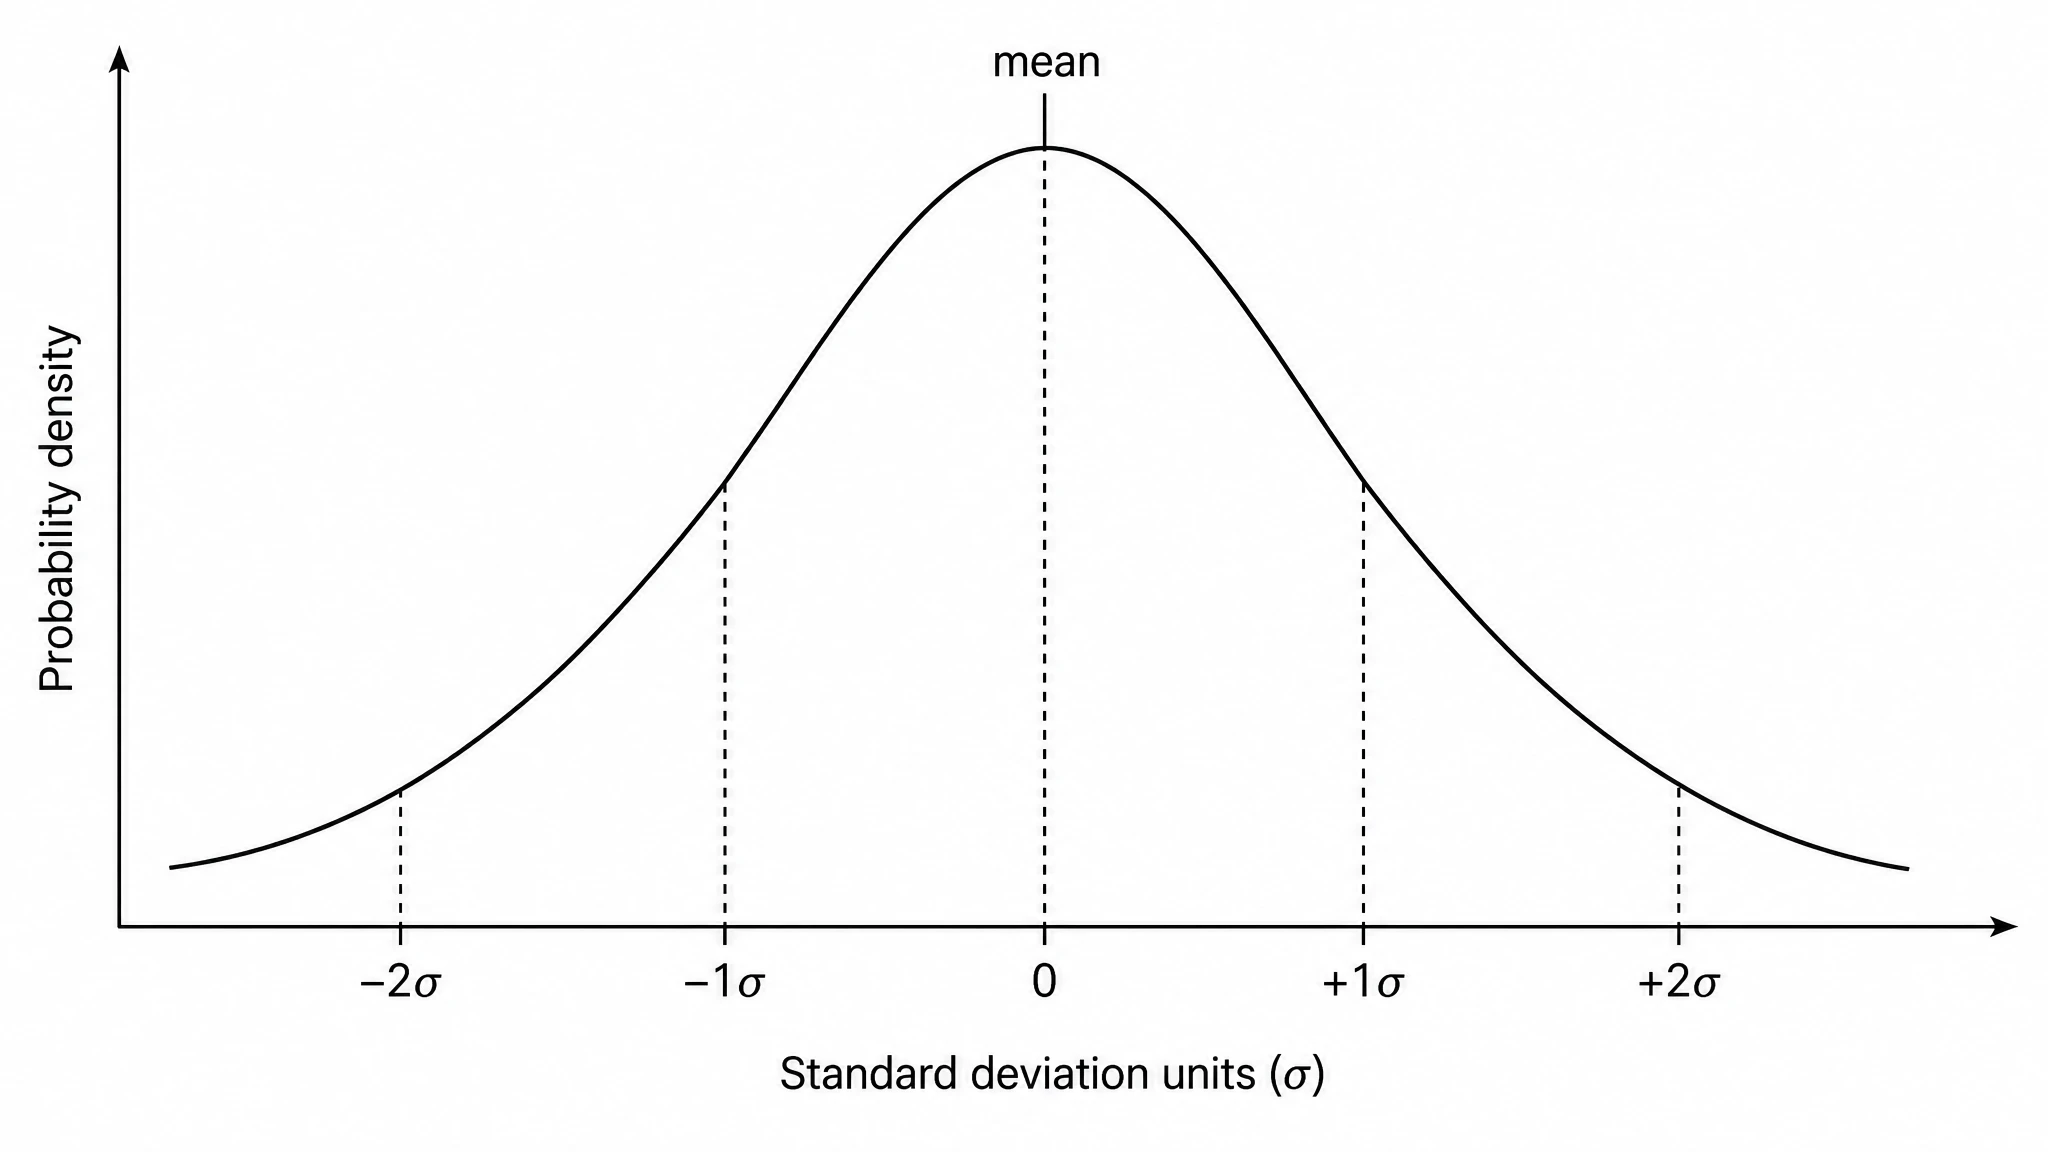 Bell Curve Generator
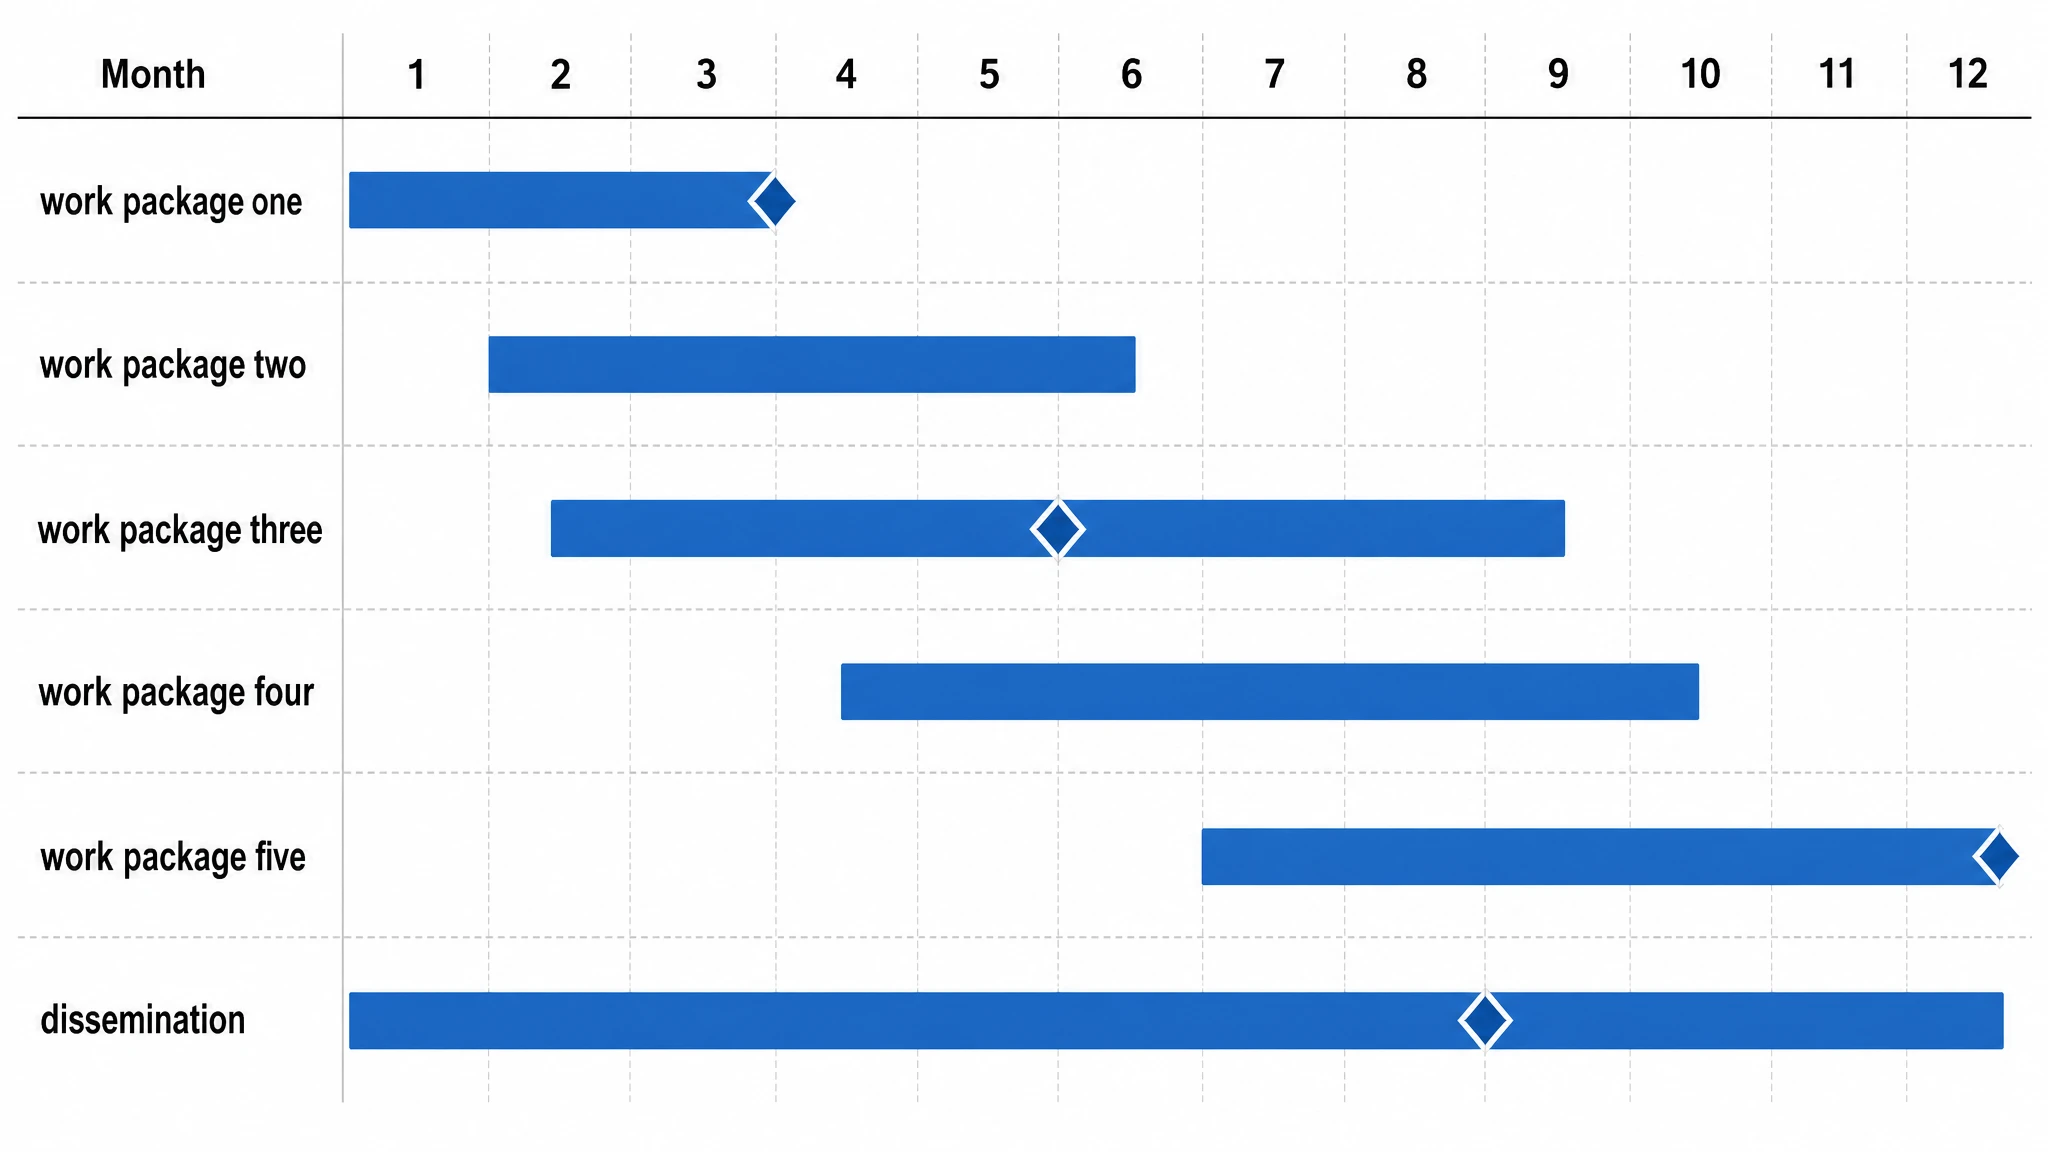 Gantt Chart Generator
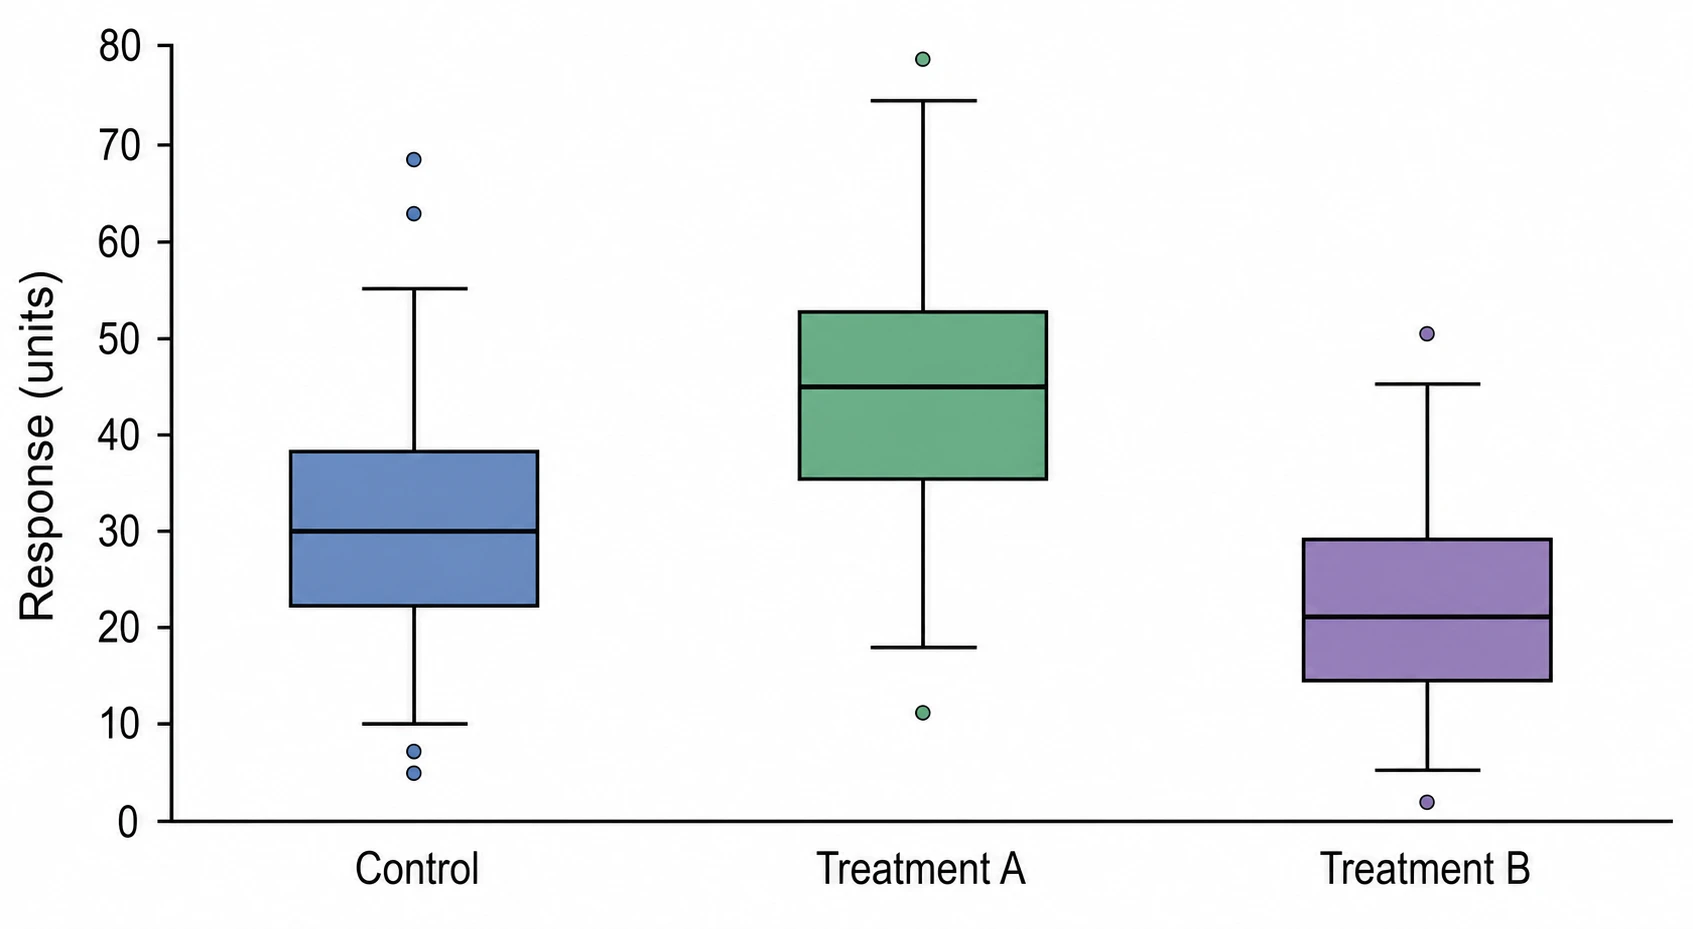 Box Plot Generator
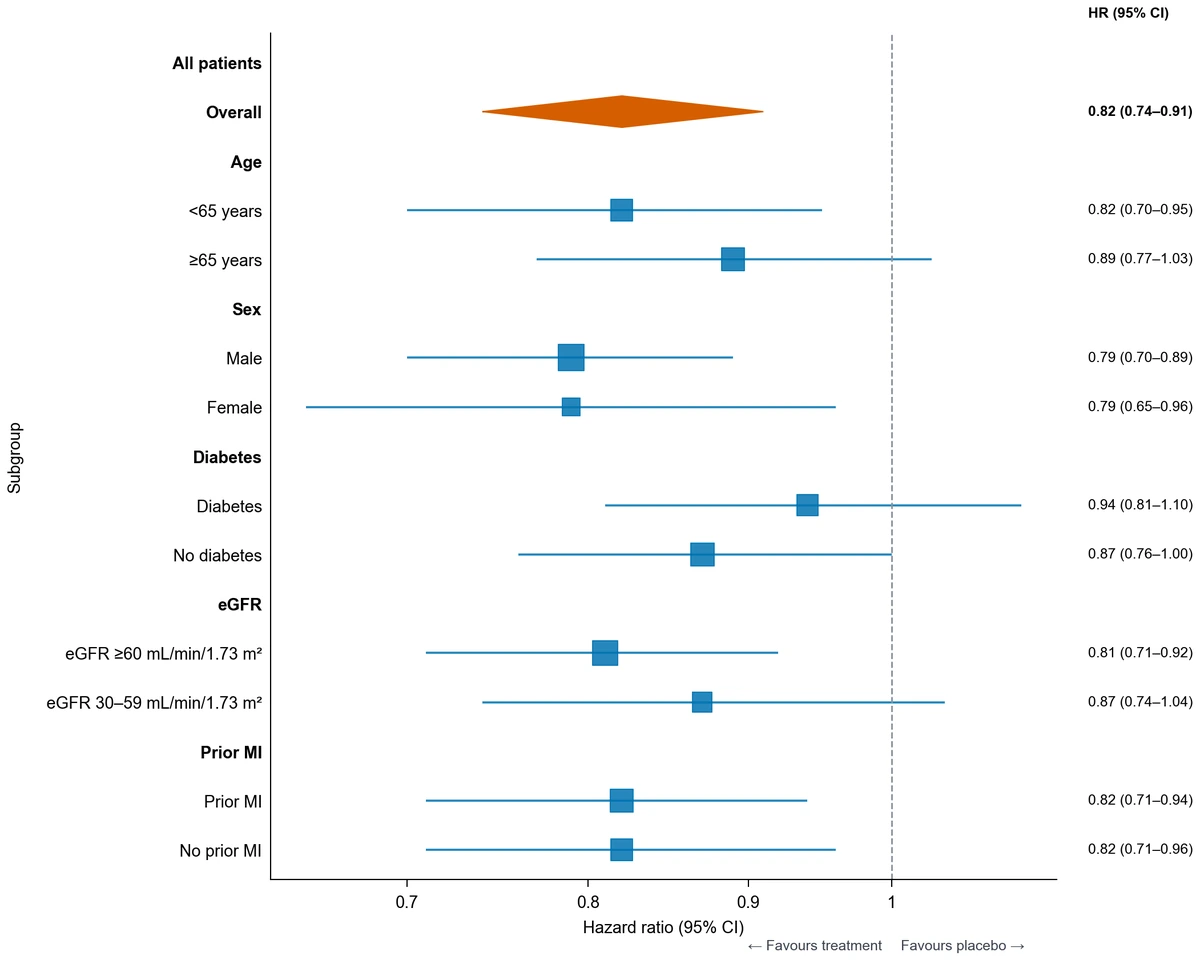 Forest Plot Generator
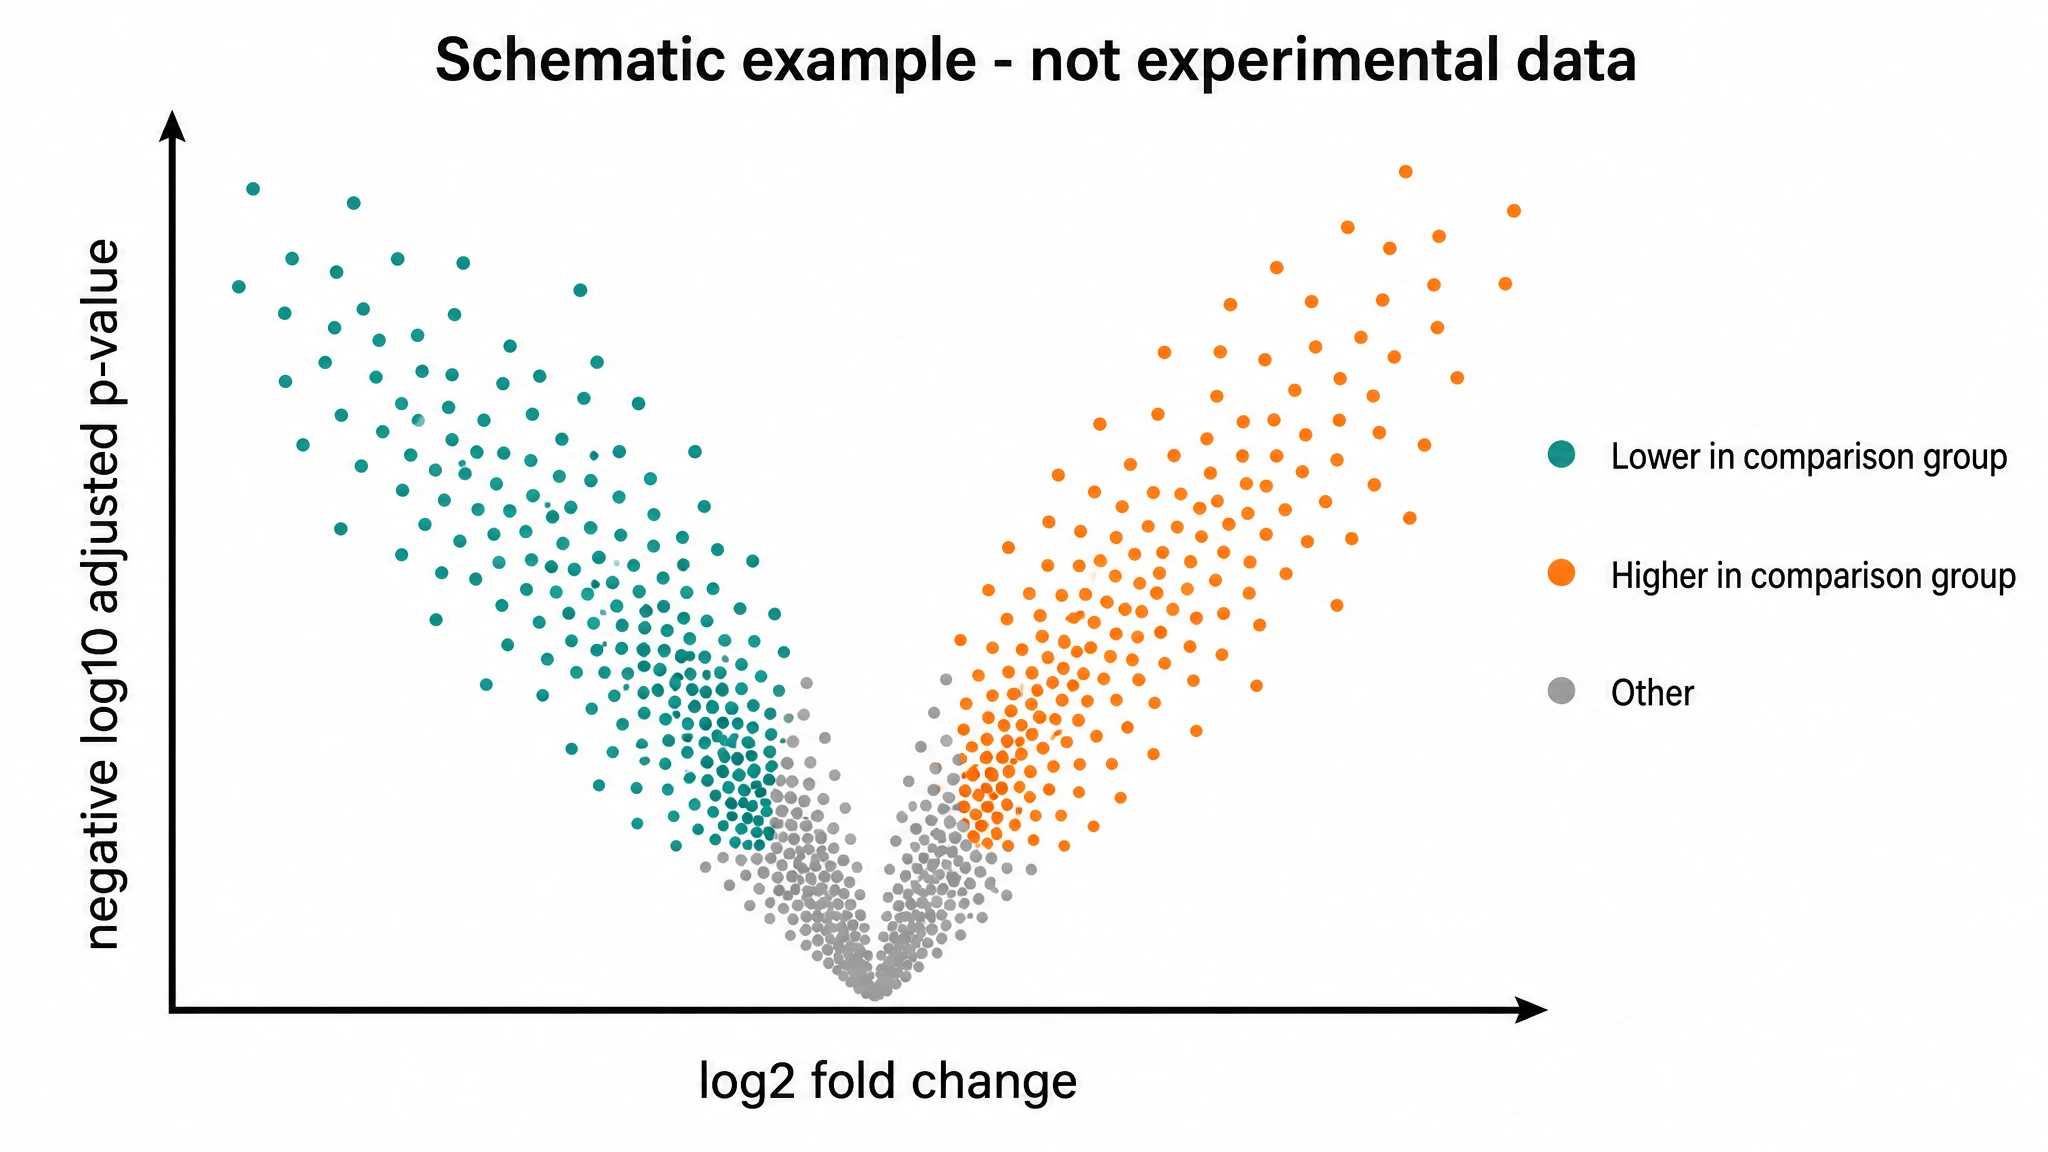 Volcano Plot Generator
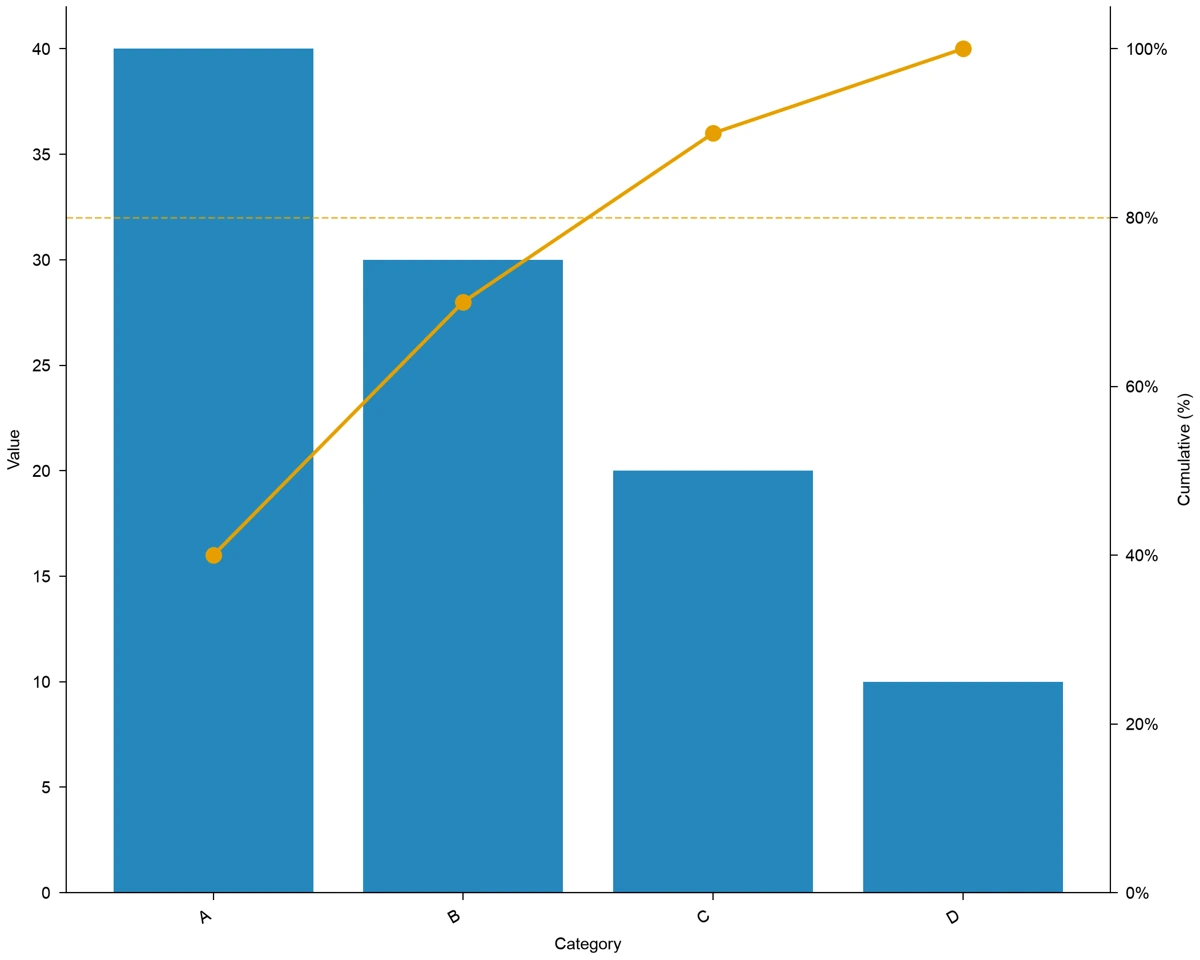 Pareto Chart Maker
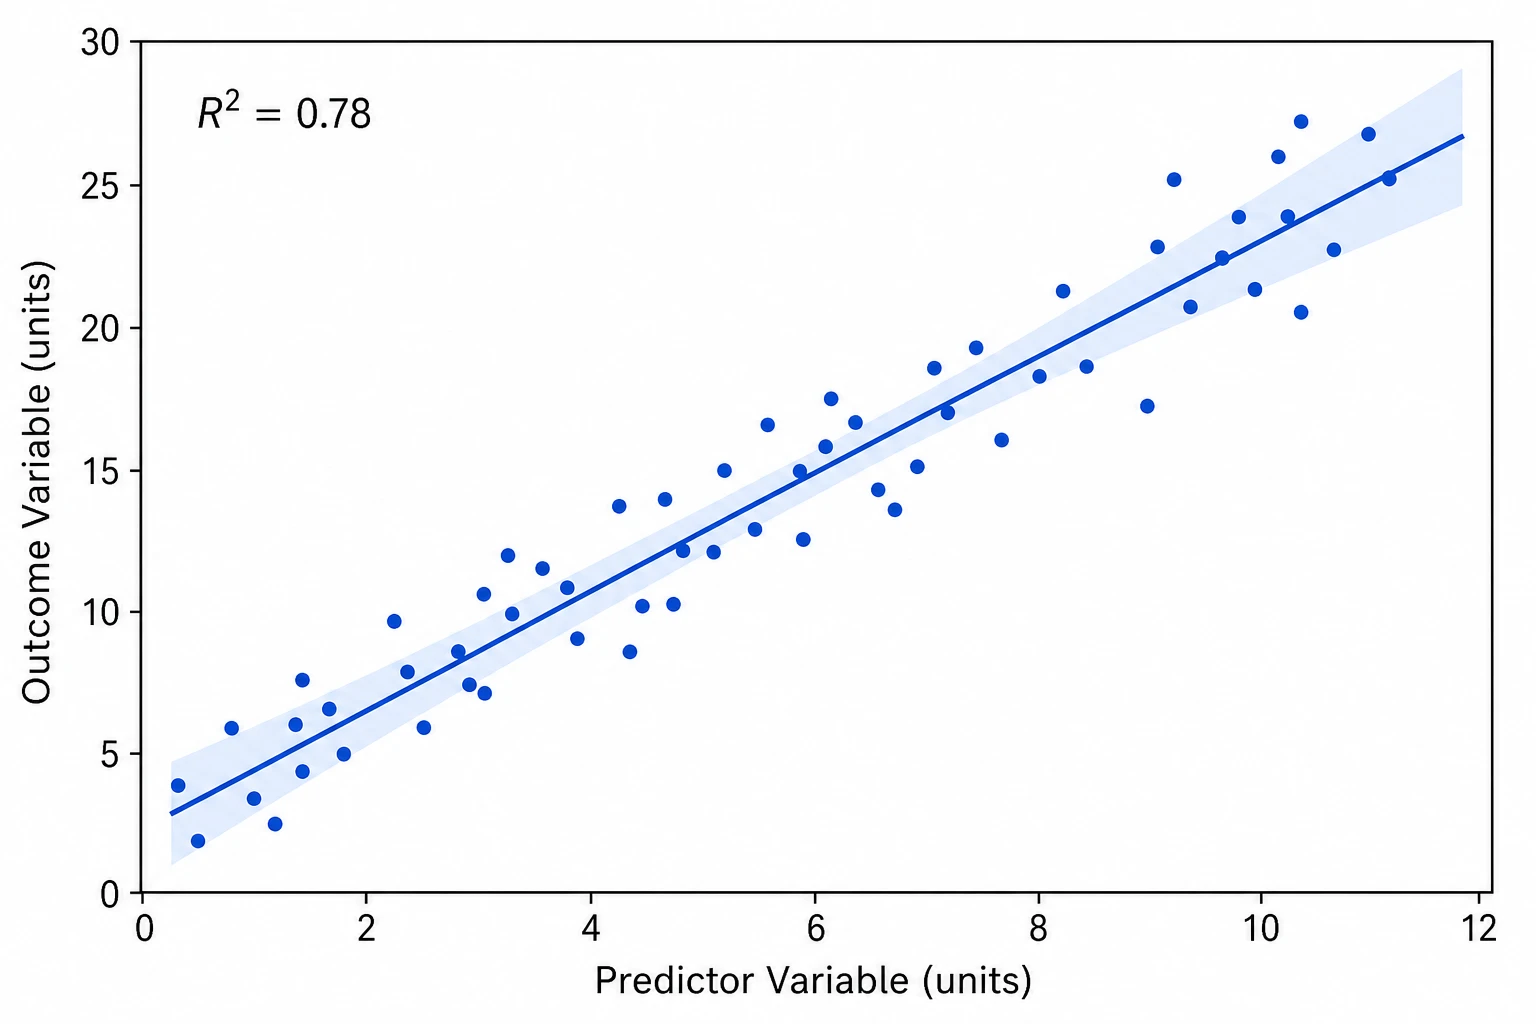 Scatter Plot Maker
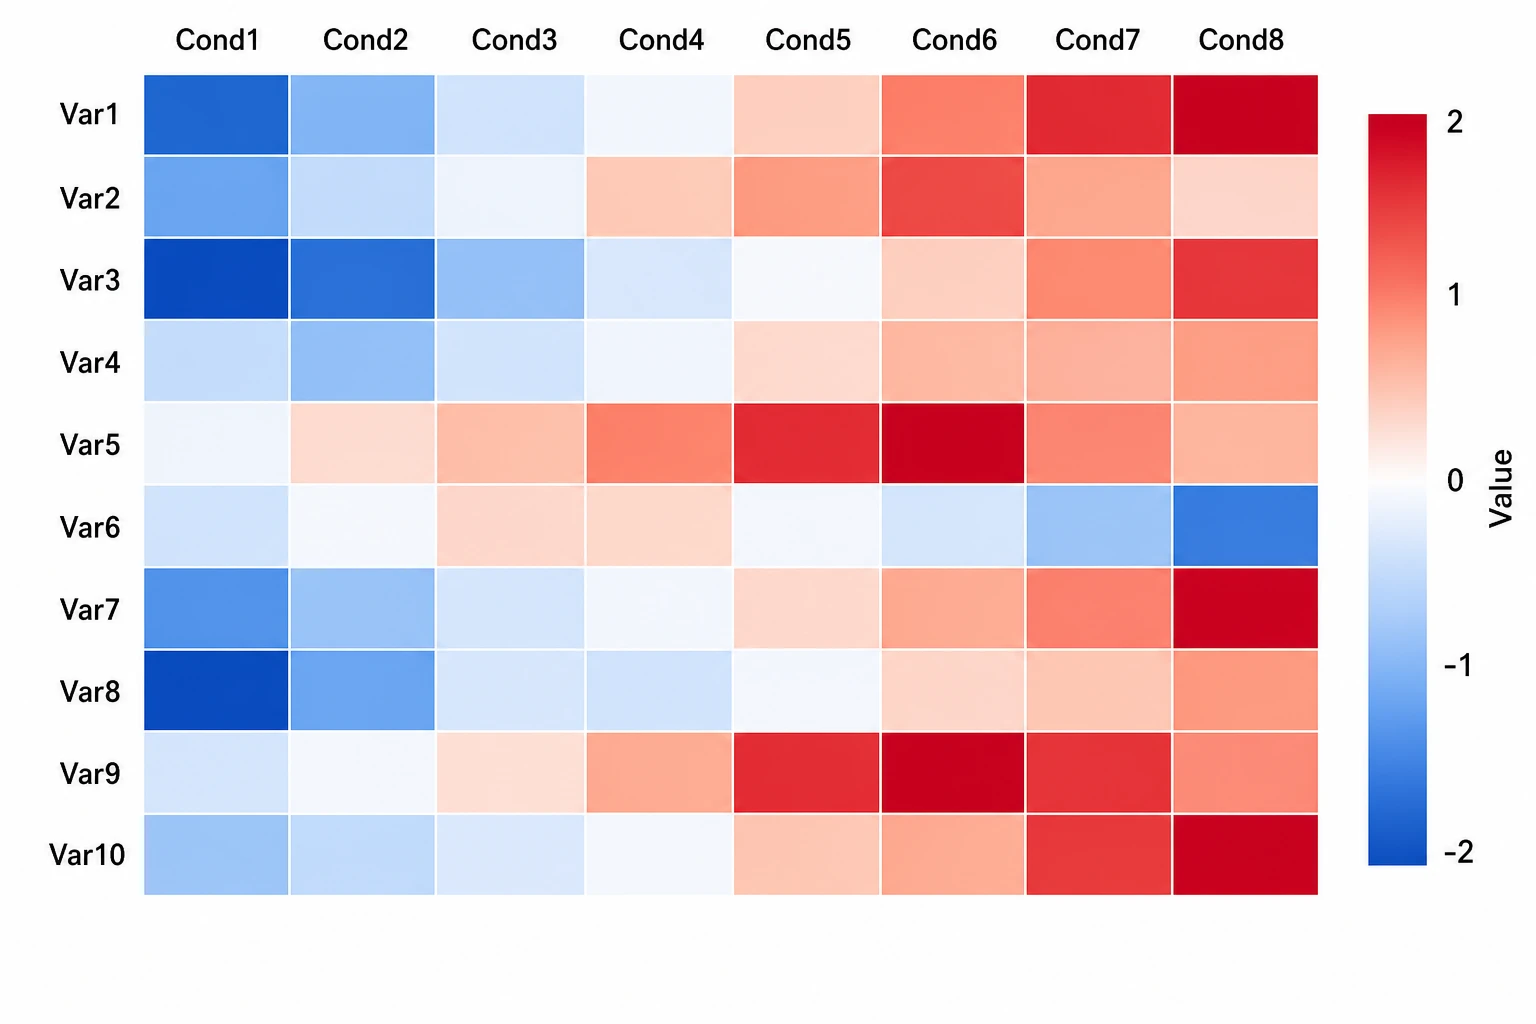 Heatmap Generator
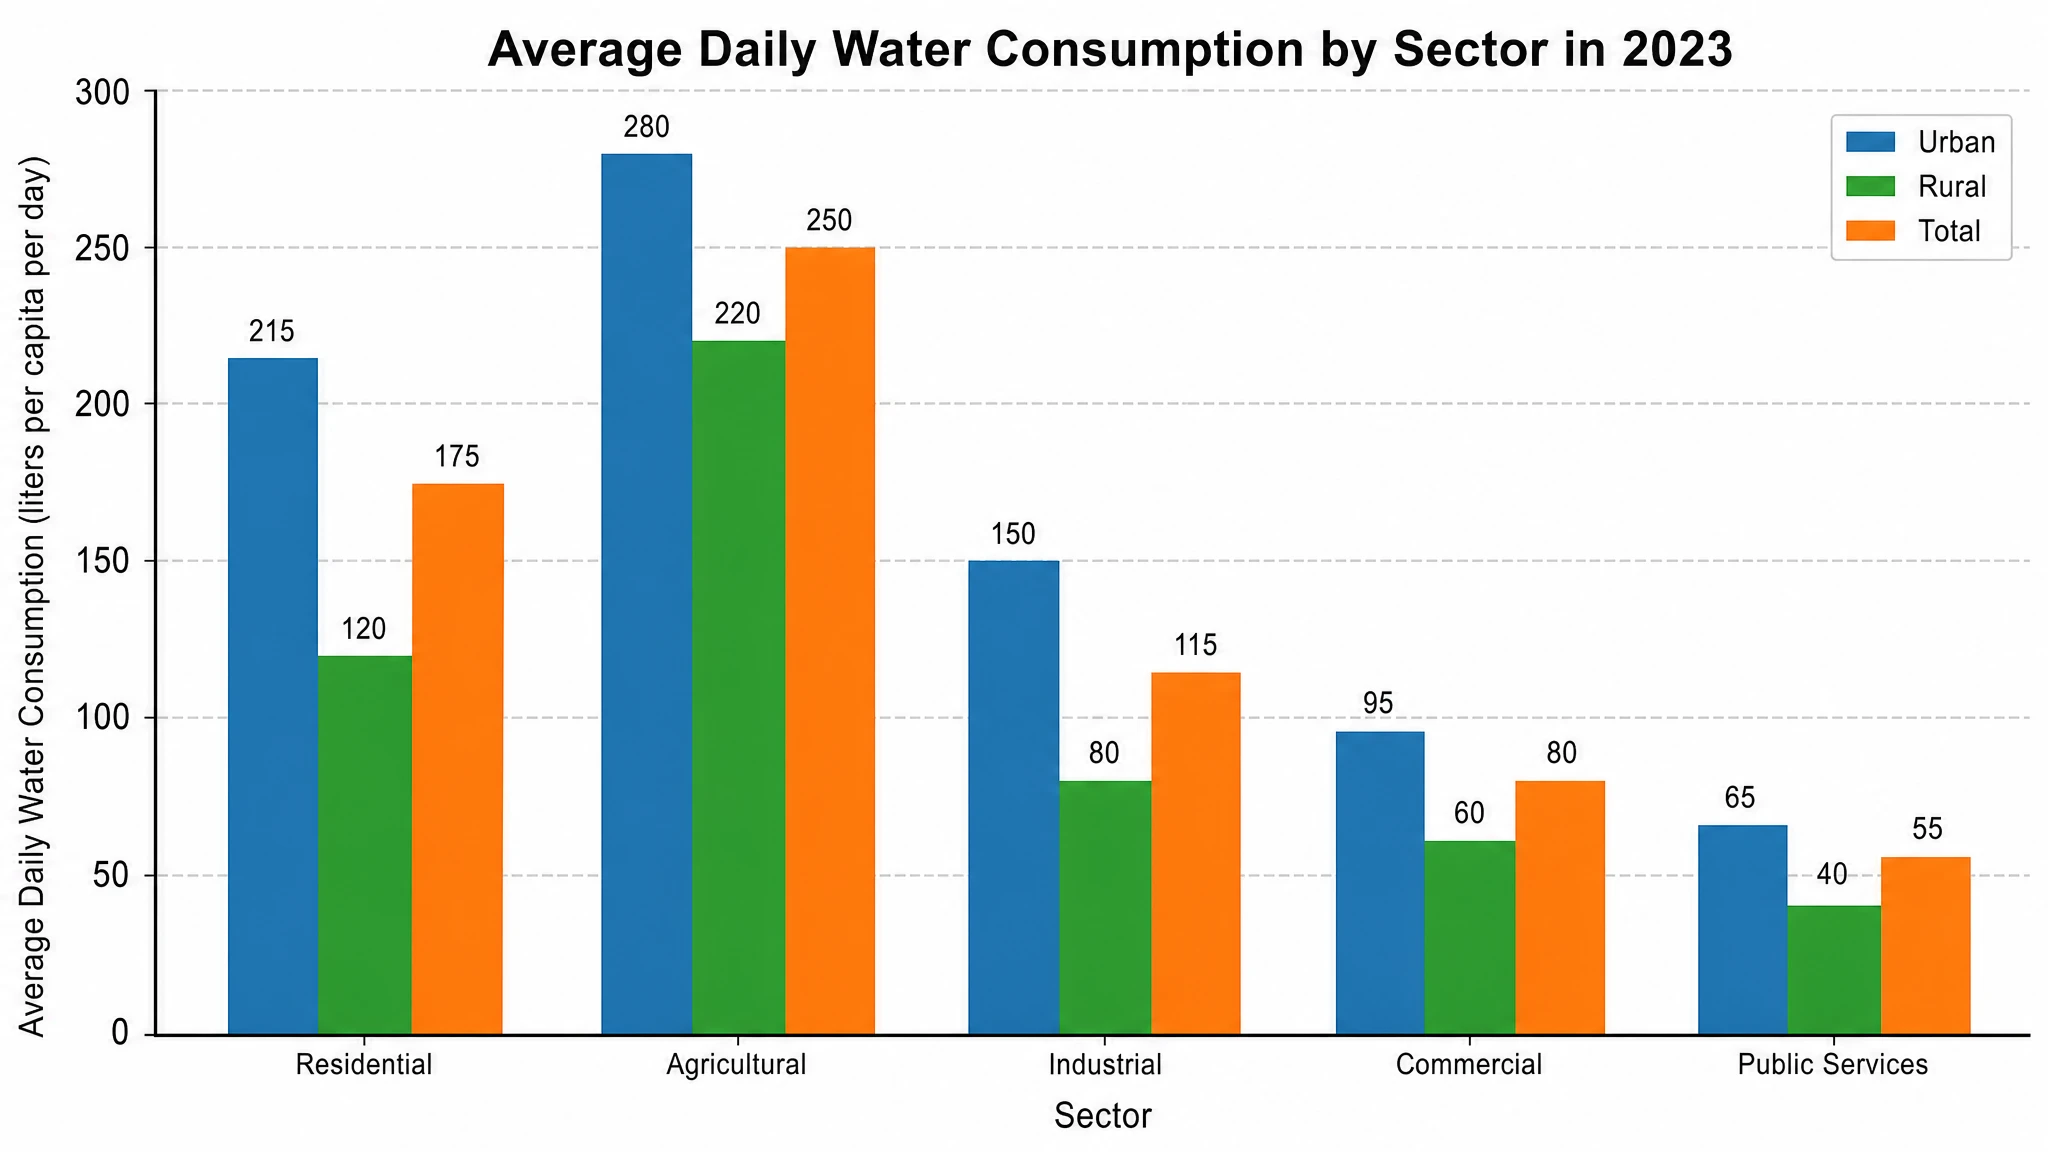 AI Chart Generator
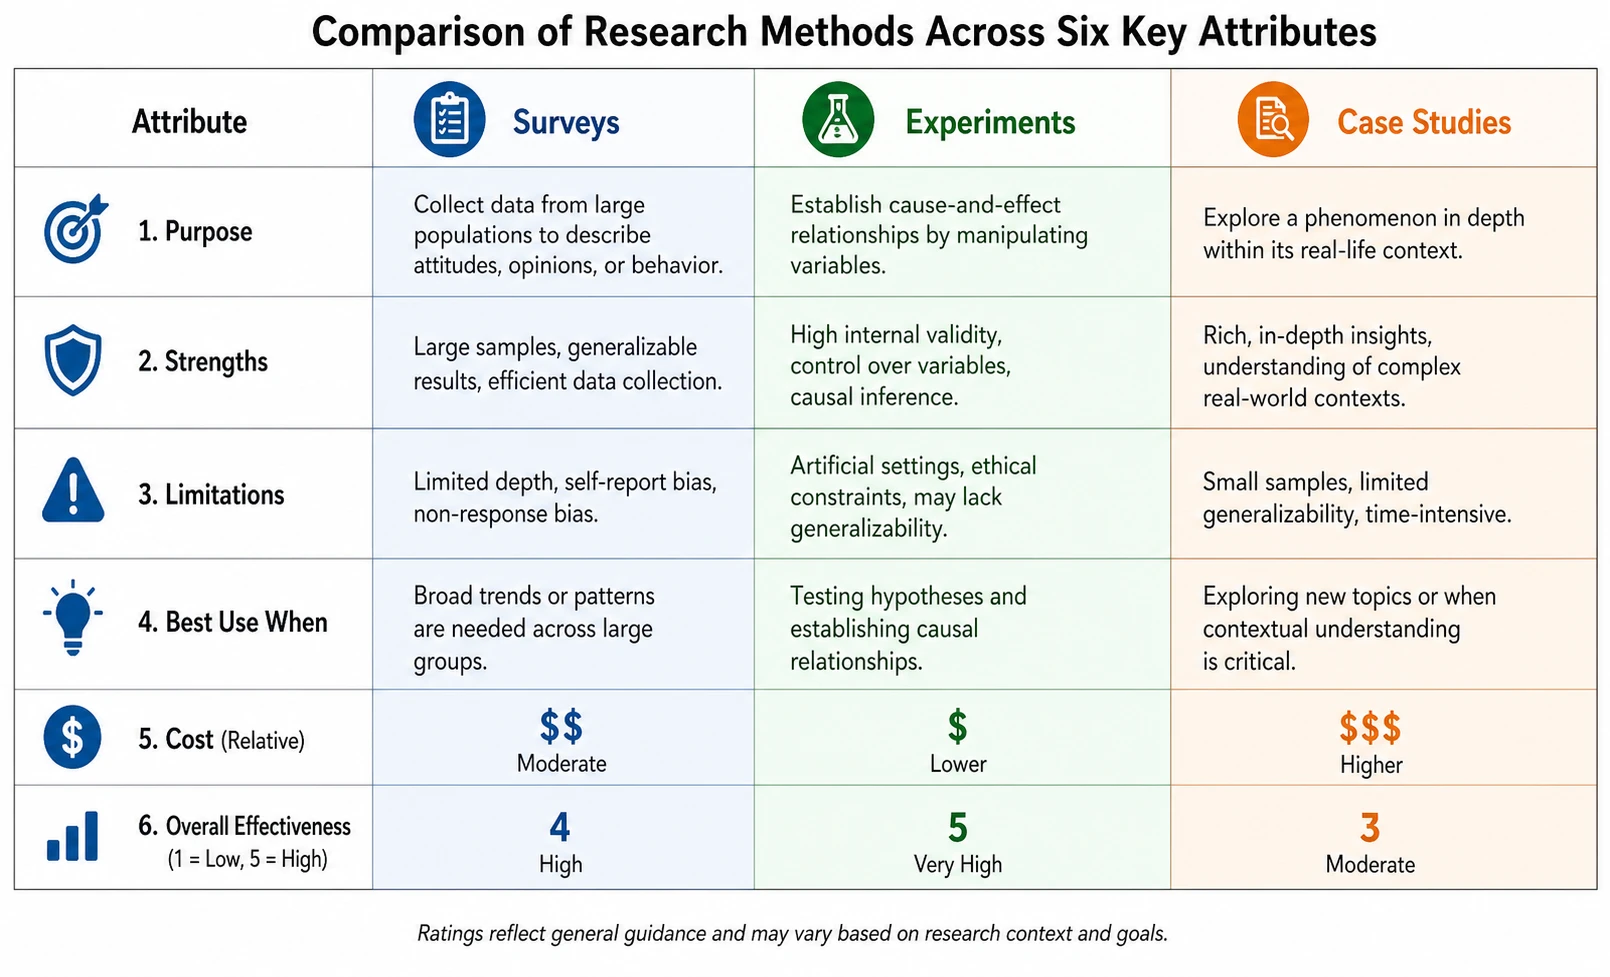 Comparison Chart Maker
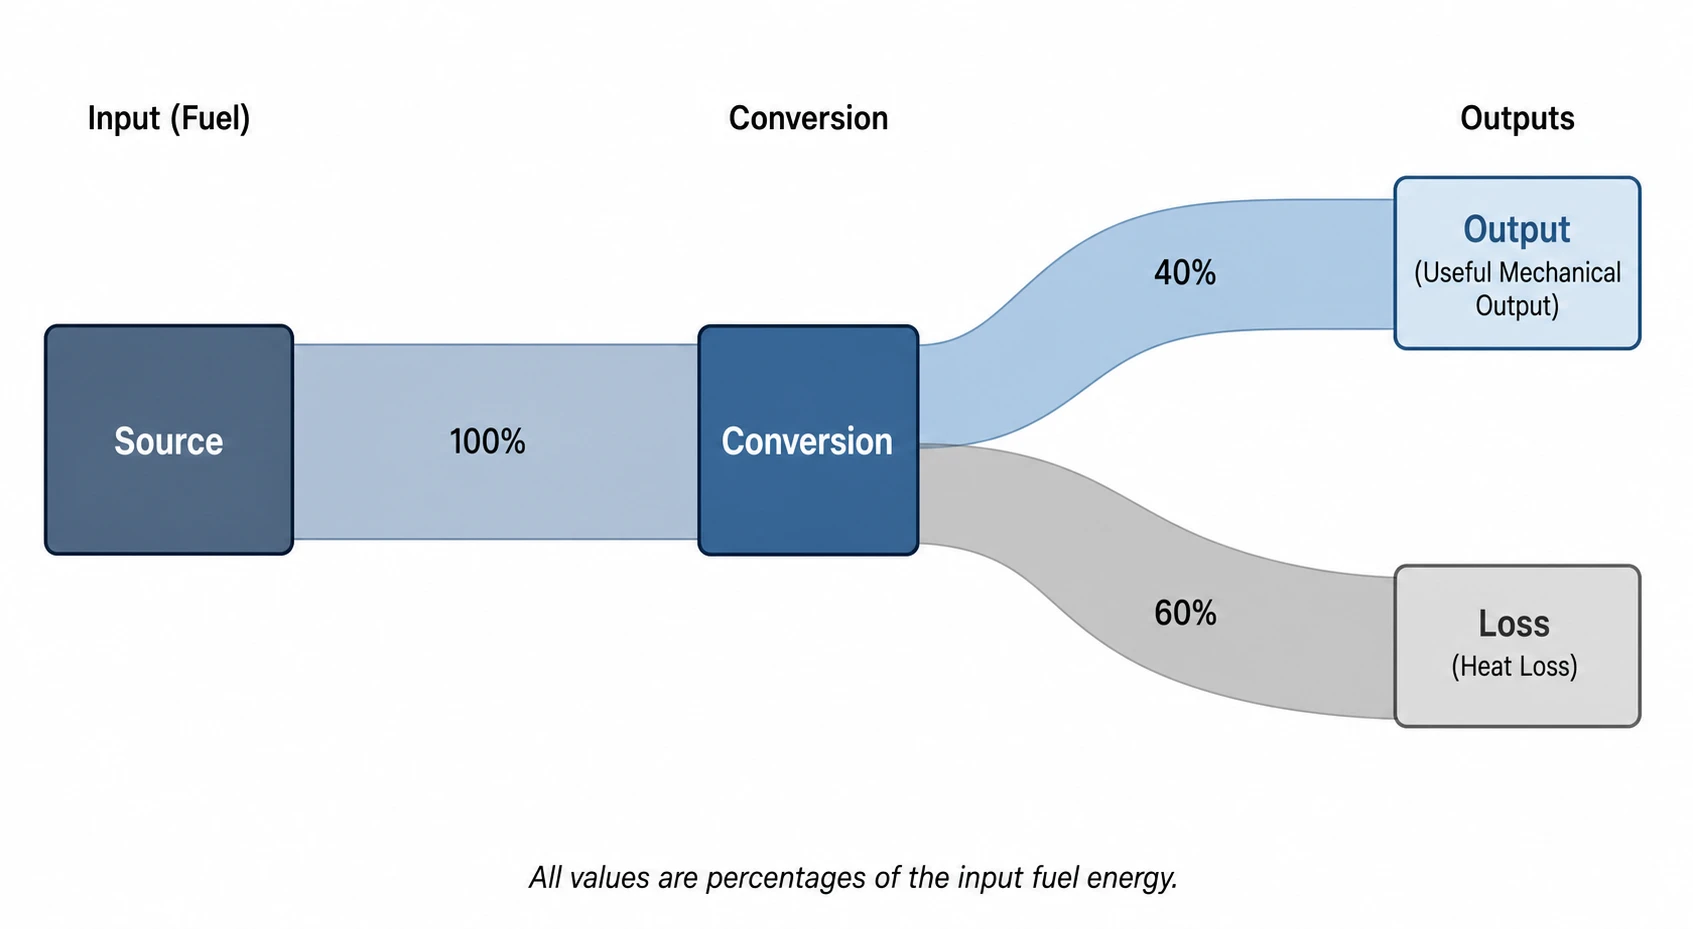 Sankey Diagram Generator
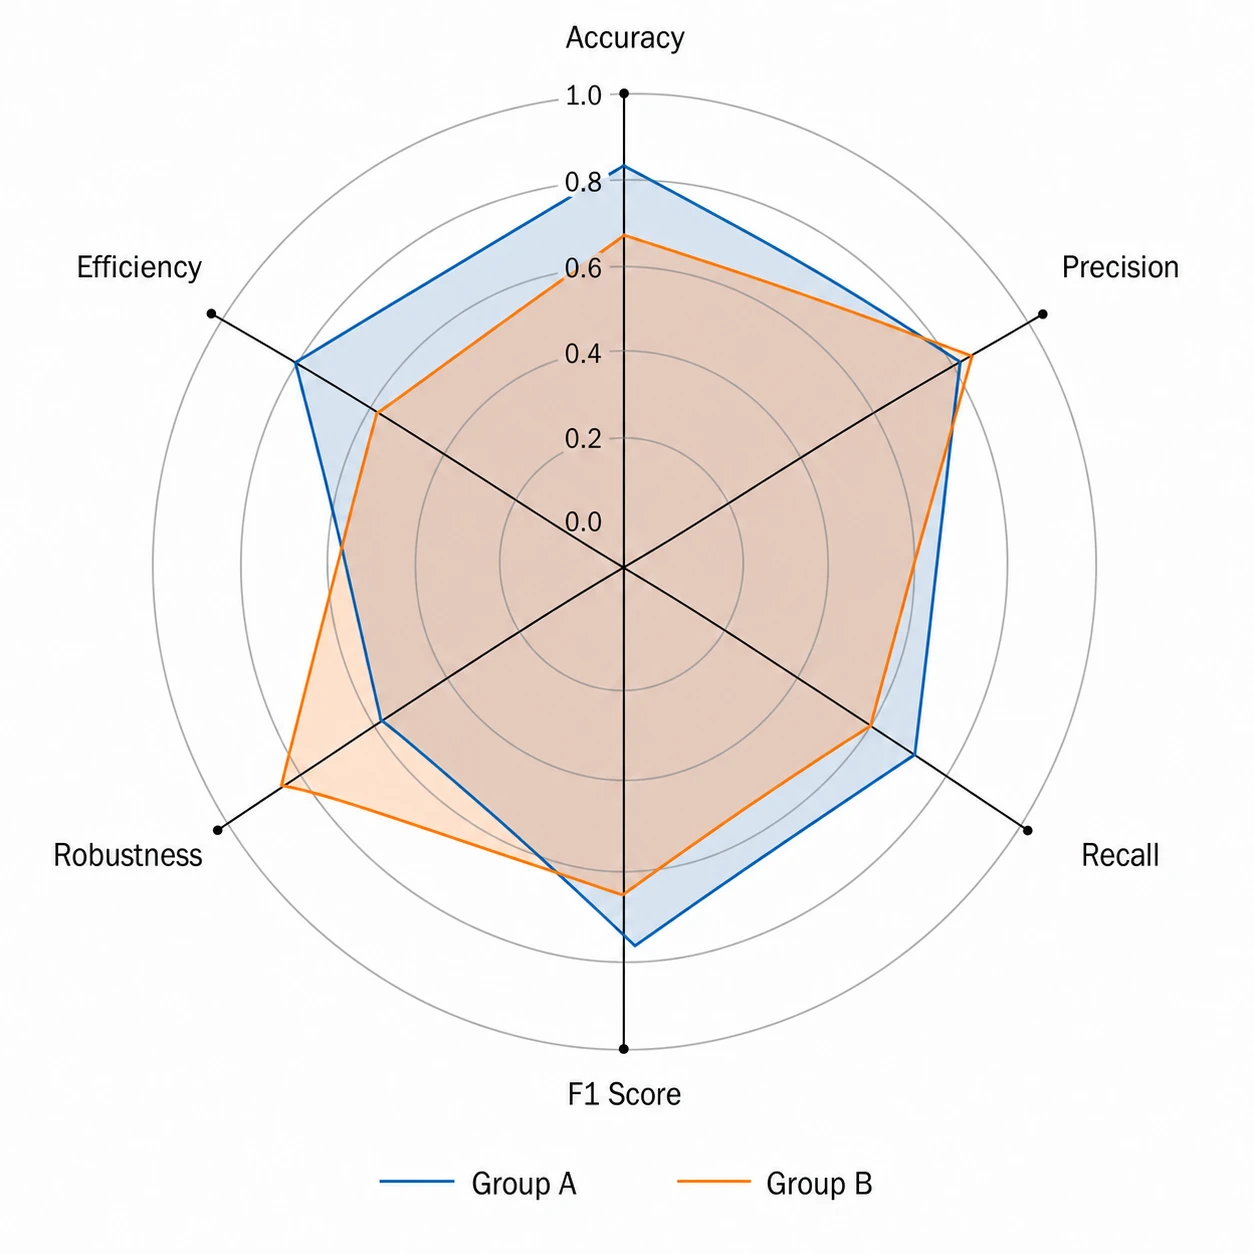 Radar Chart Generator
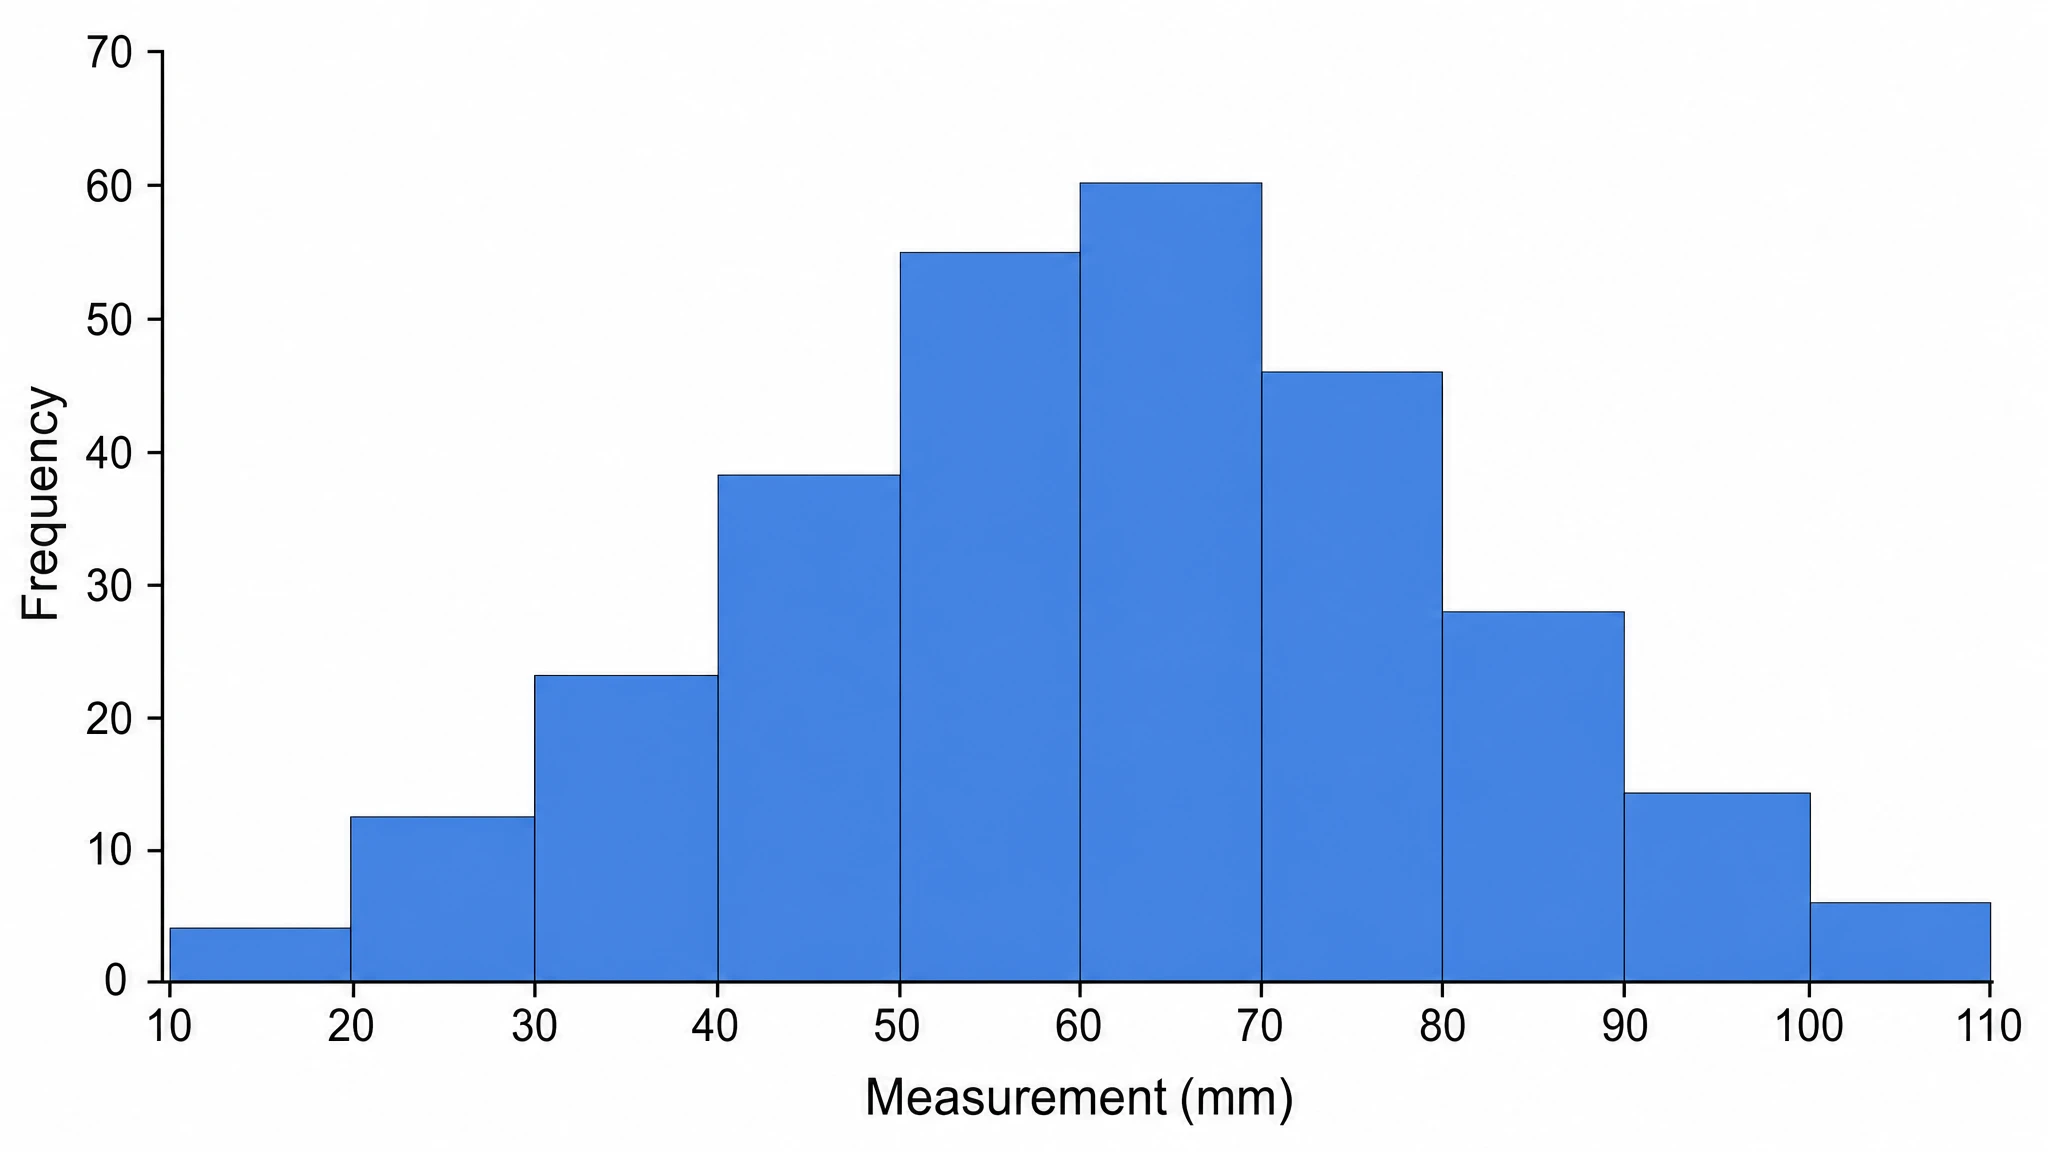 Histogram Maker
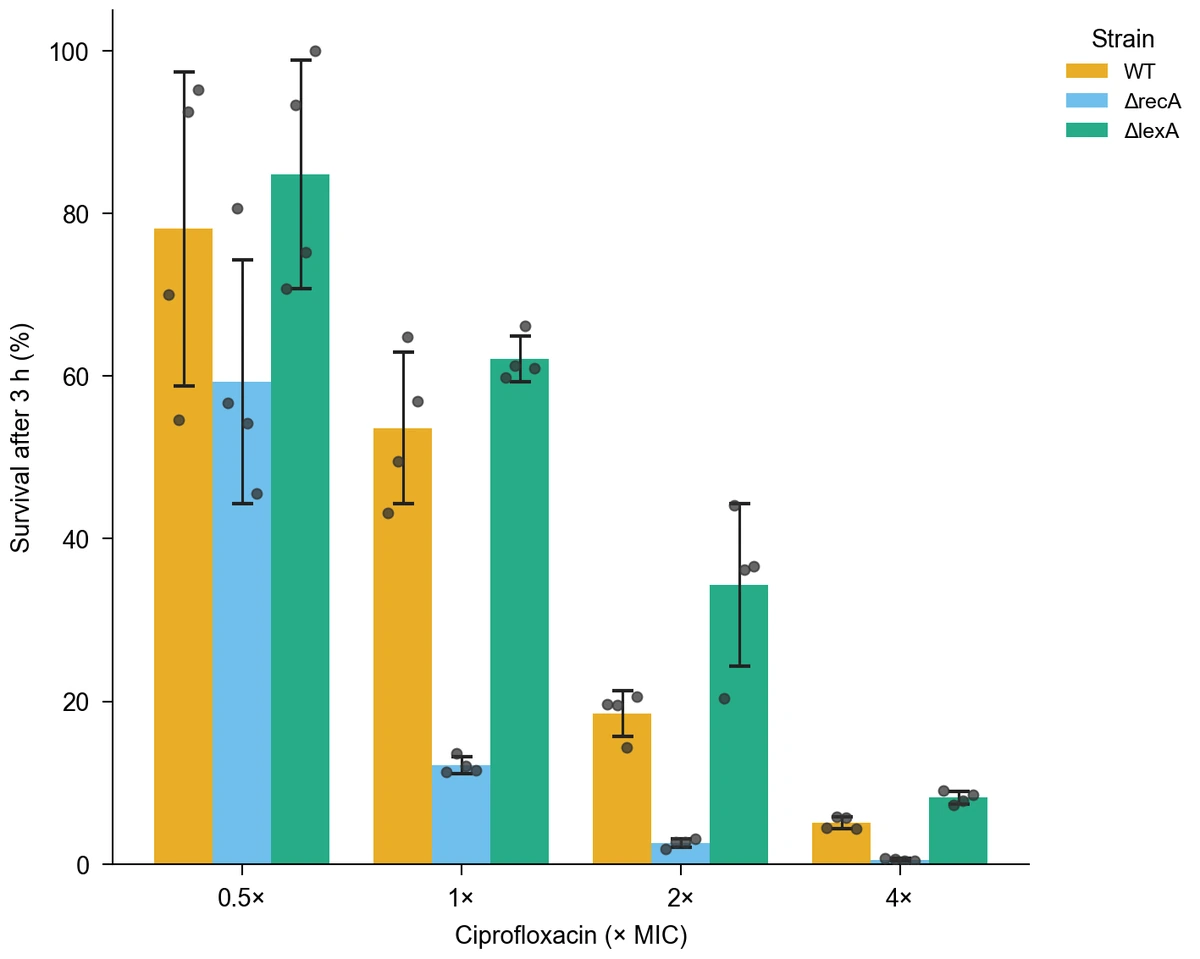 Bar Chart Generator
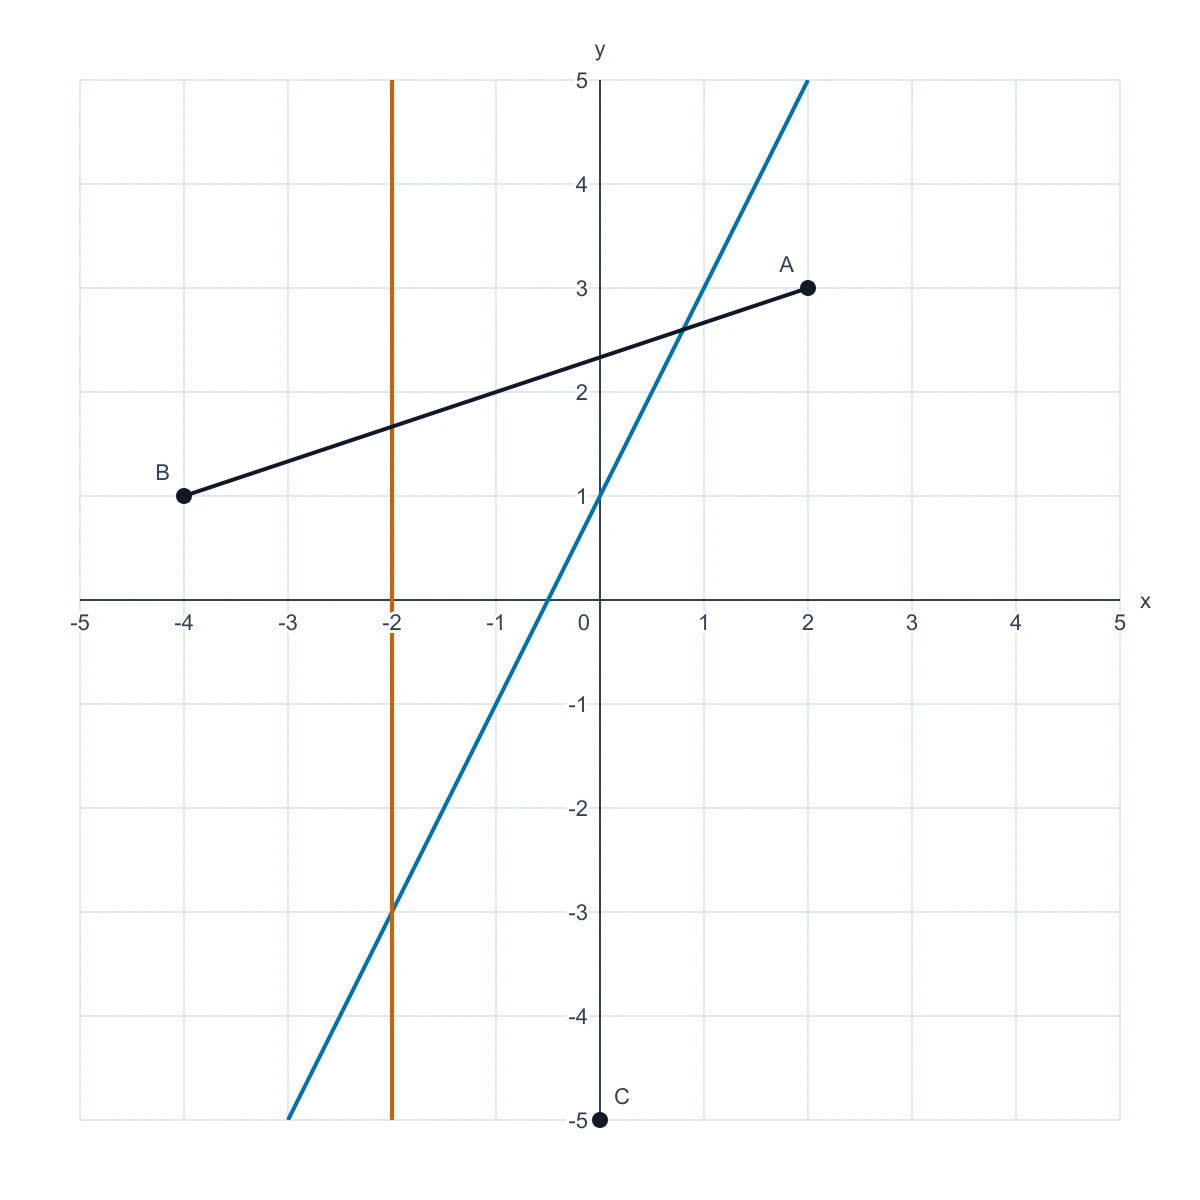 Coordinate Plane Generator
 Dot Plot Creator
 Water Heating Curve
 IC50 Calculator & Dose-Response Curves
 Image DPI Calculator
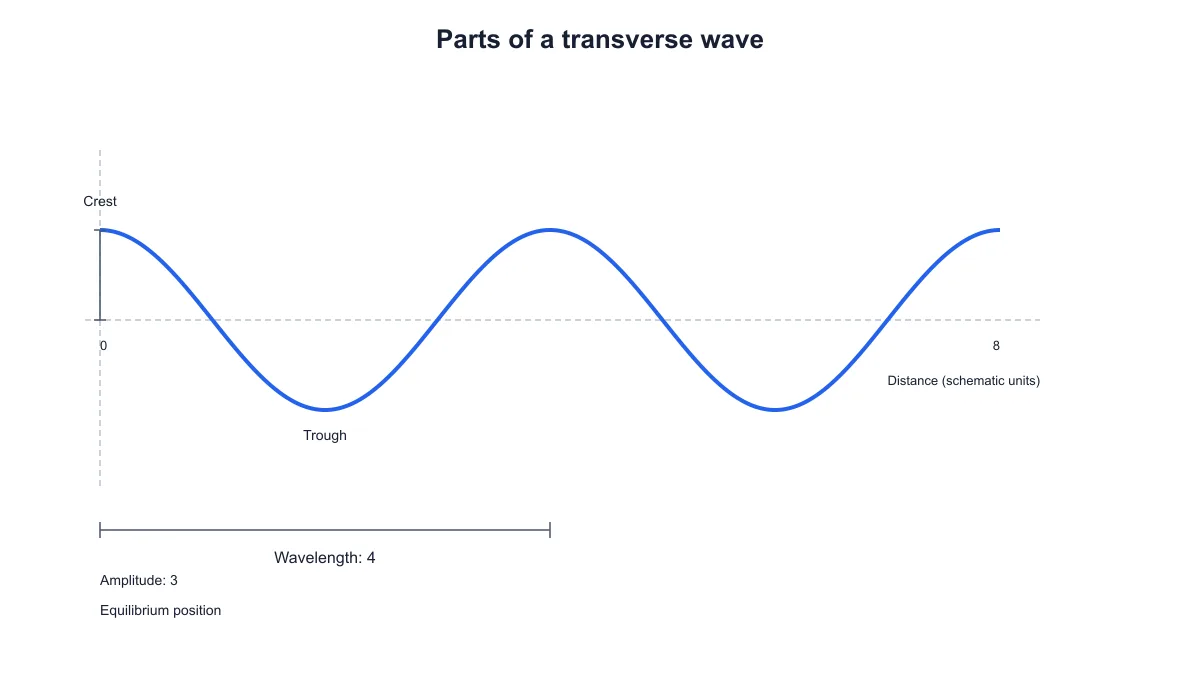 Transverse Wave Diagram Generator
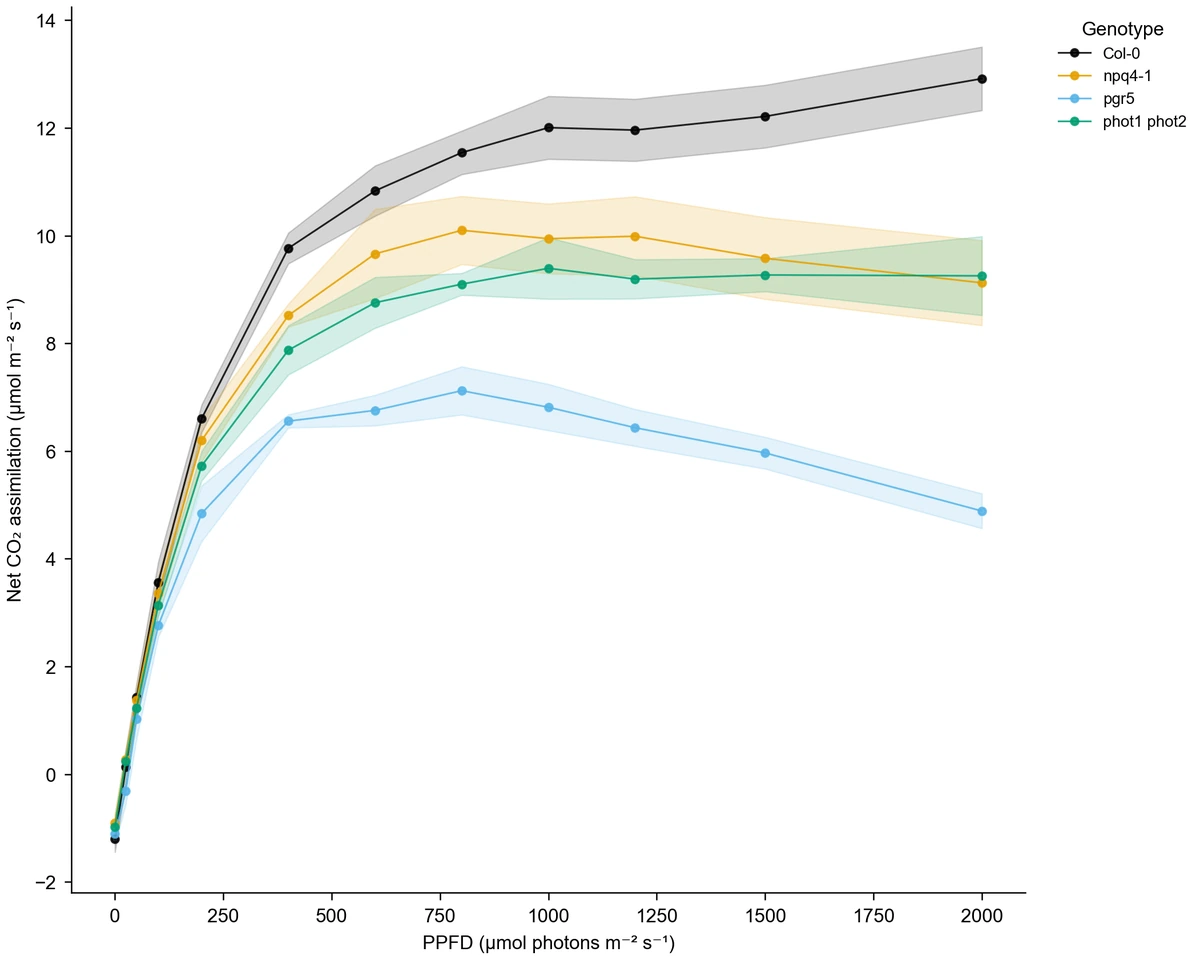 Line Chart Generator
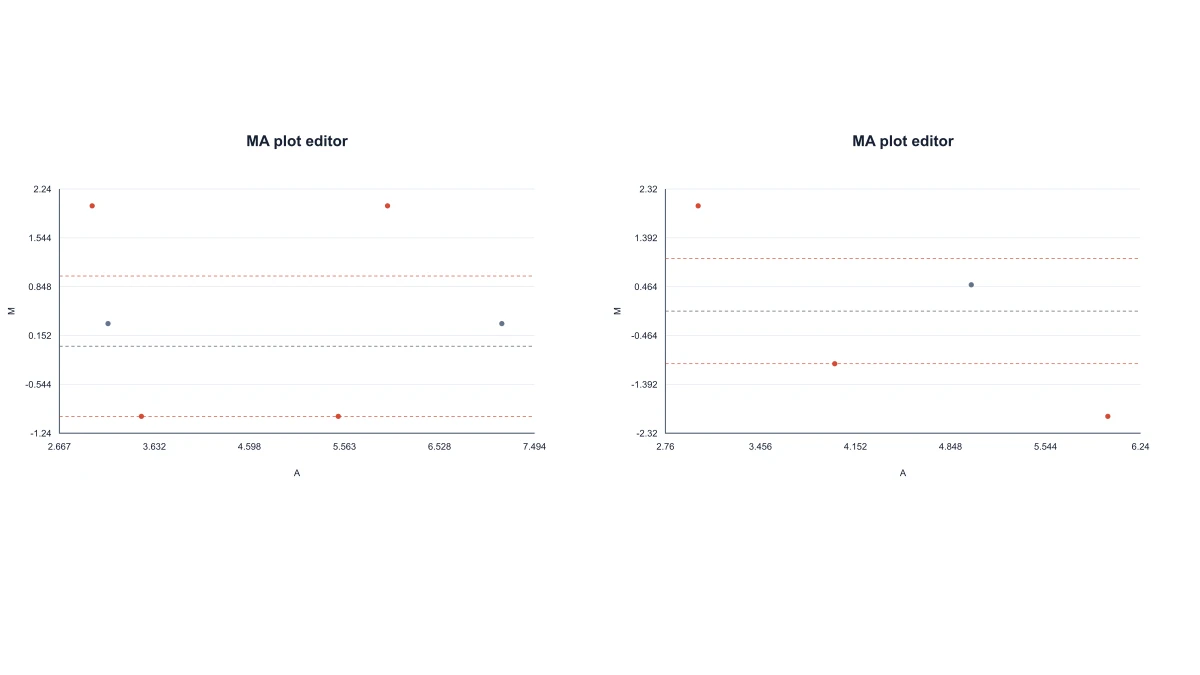 MA Plot
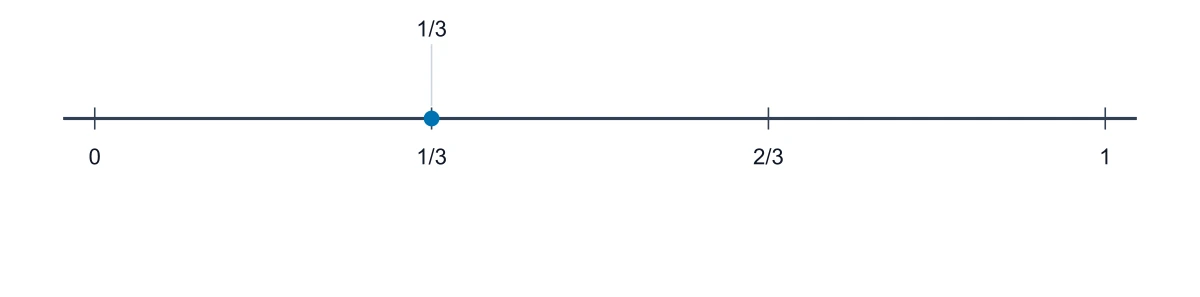 Number Line Generator
 Figure Checker
 Scientific Graph Maker
 Free Serial Dilution Calculator — Volumes & Diagram
 Supply and Demand Graph Maker
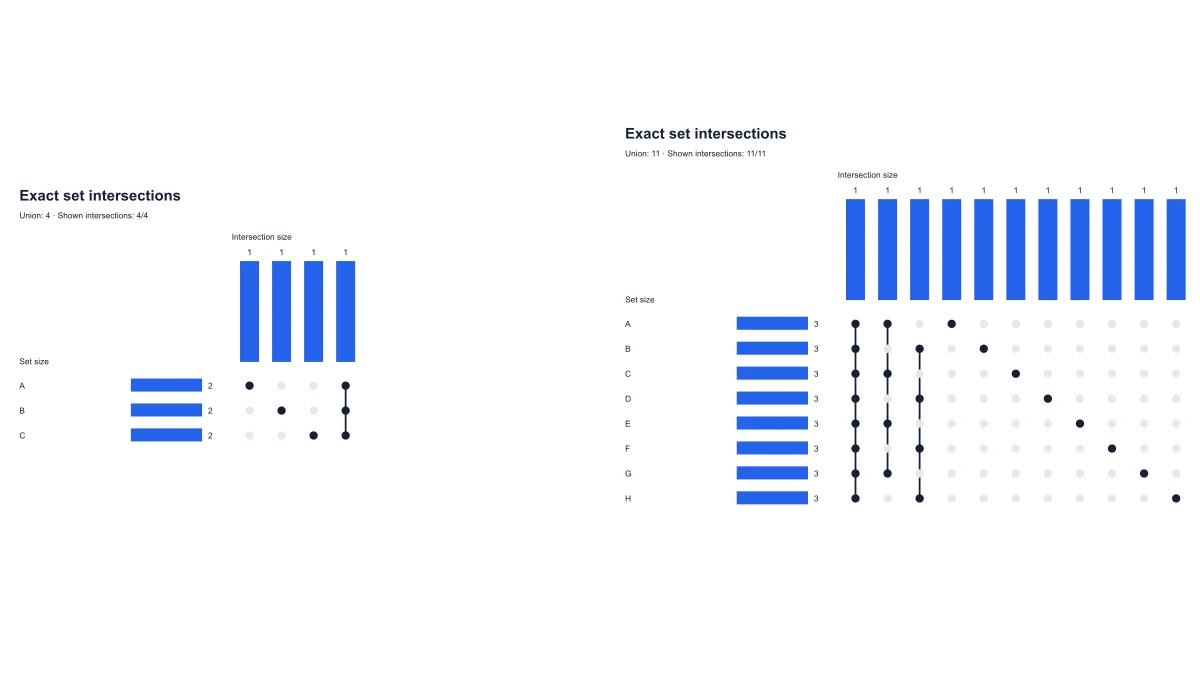 UpSet Plot Generator
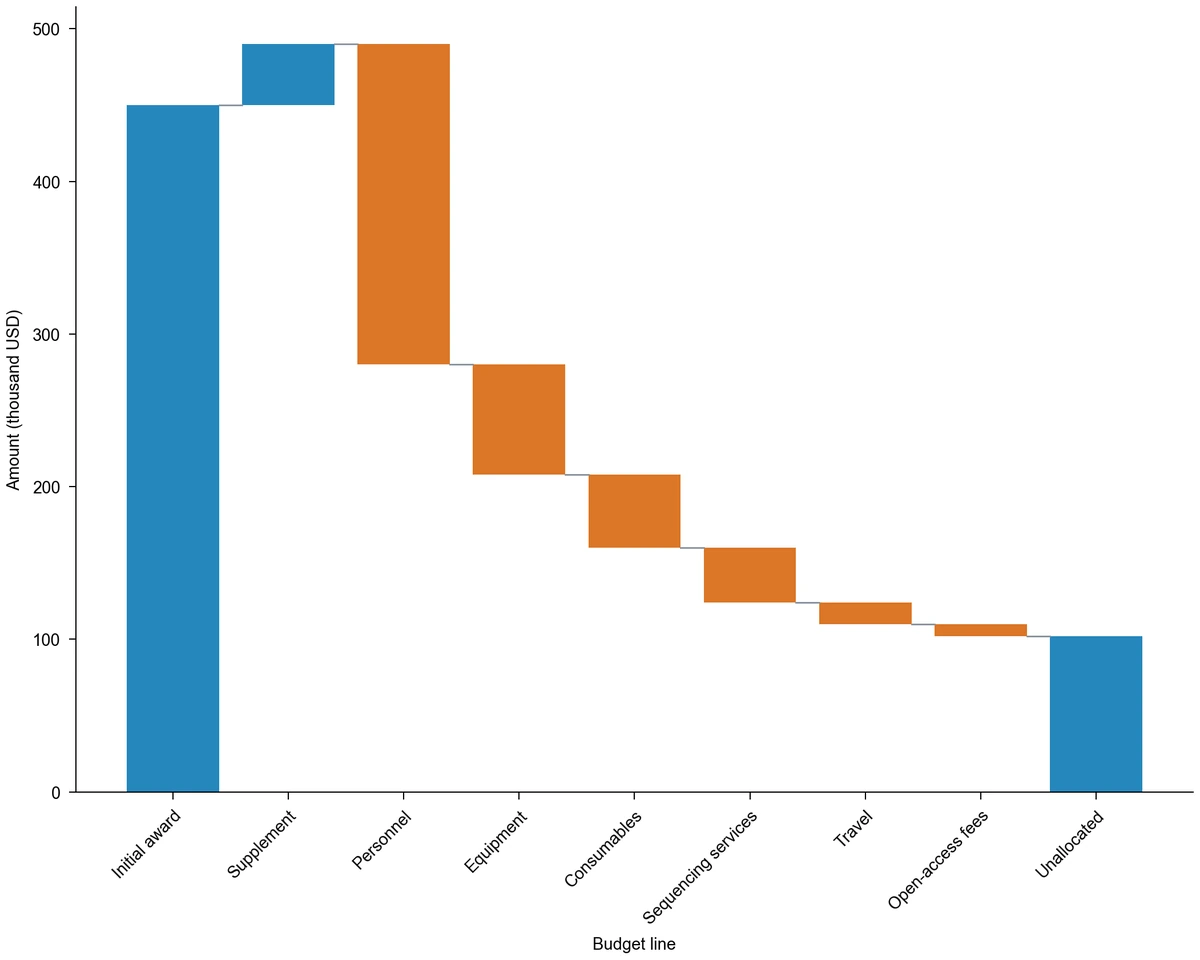 Waterfall Chart MakerPlace Value Chart
Flowcharts, frameworks and structure diagrams
33 tools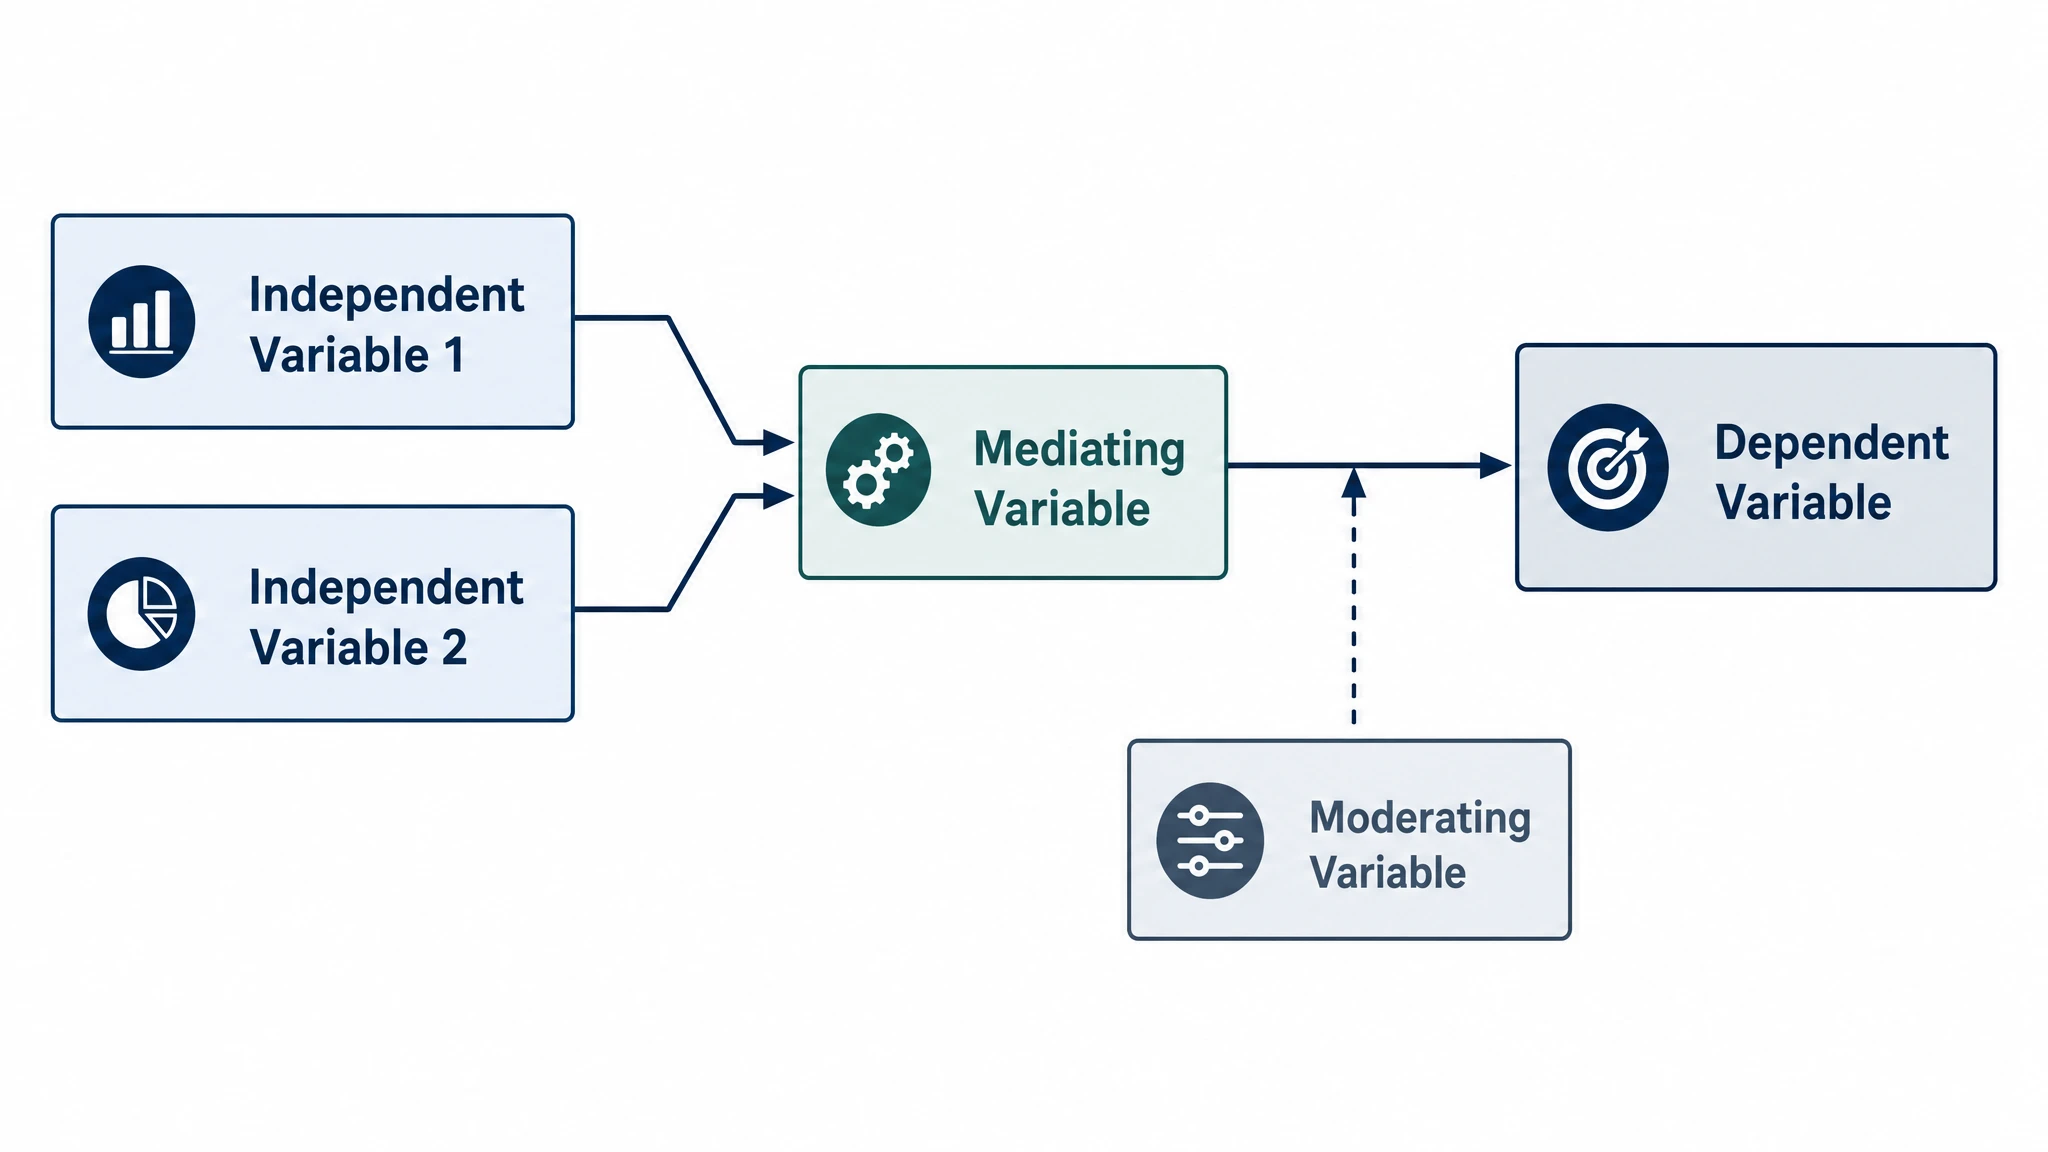 Conceptual Framework Generator
 Theoretical Framework Generator
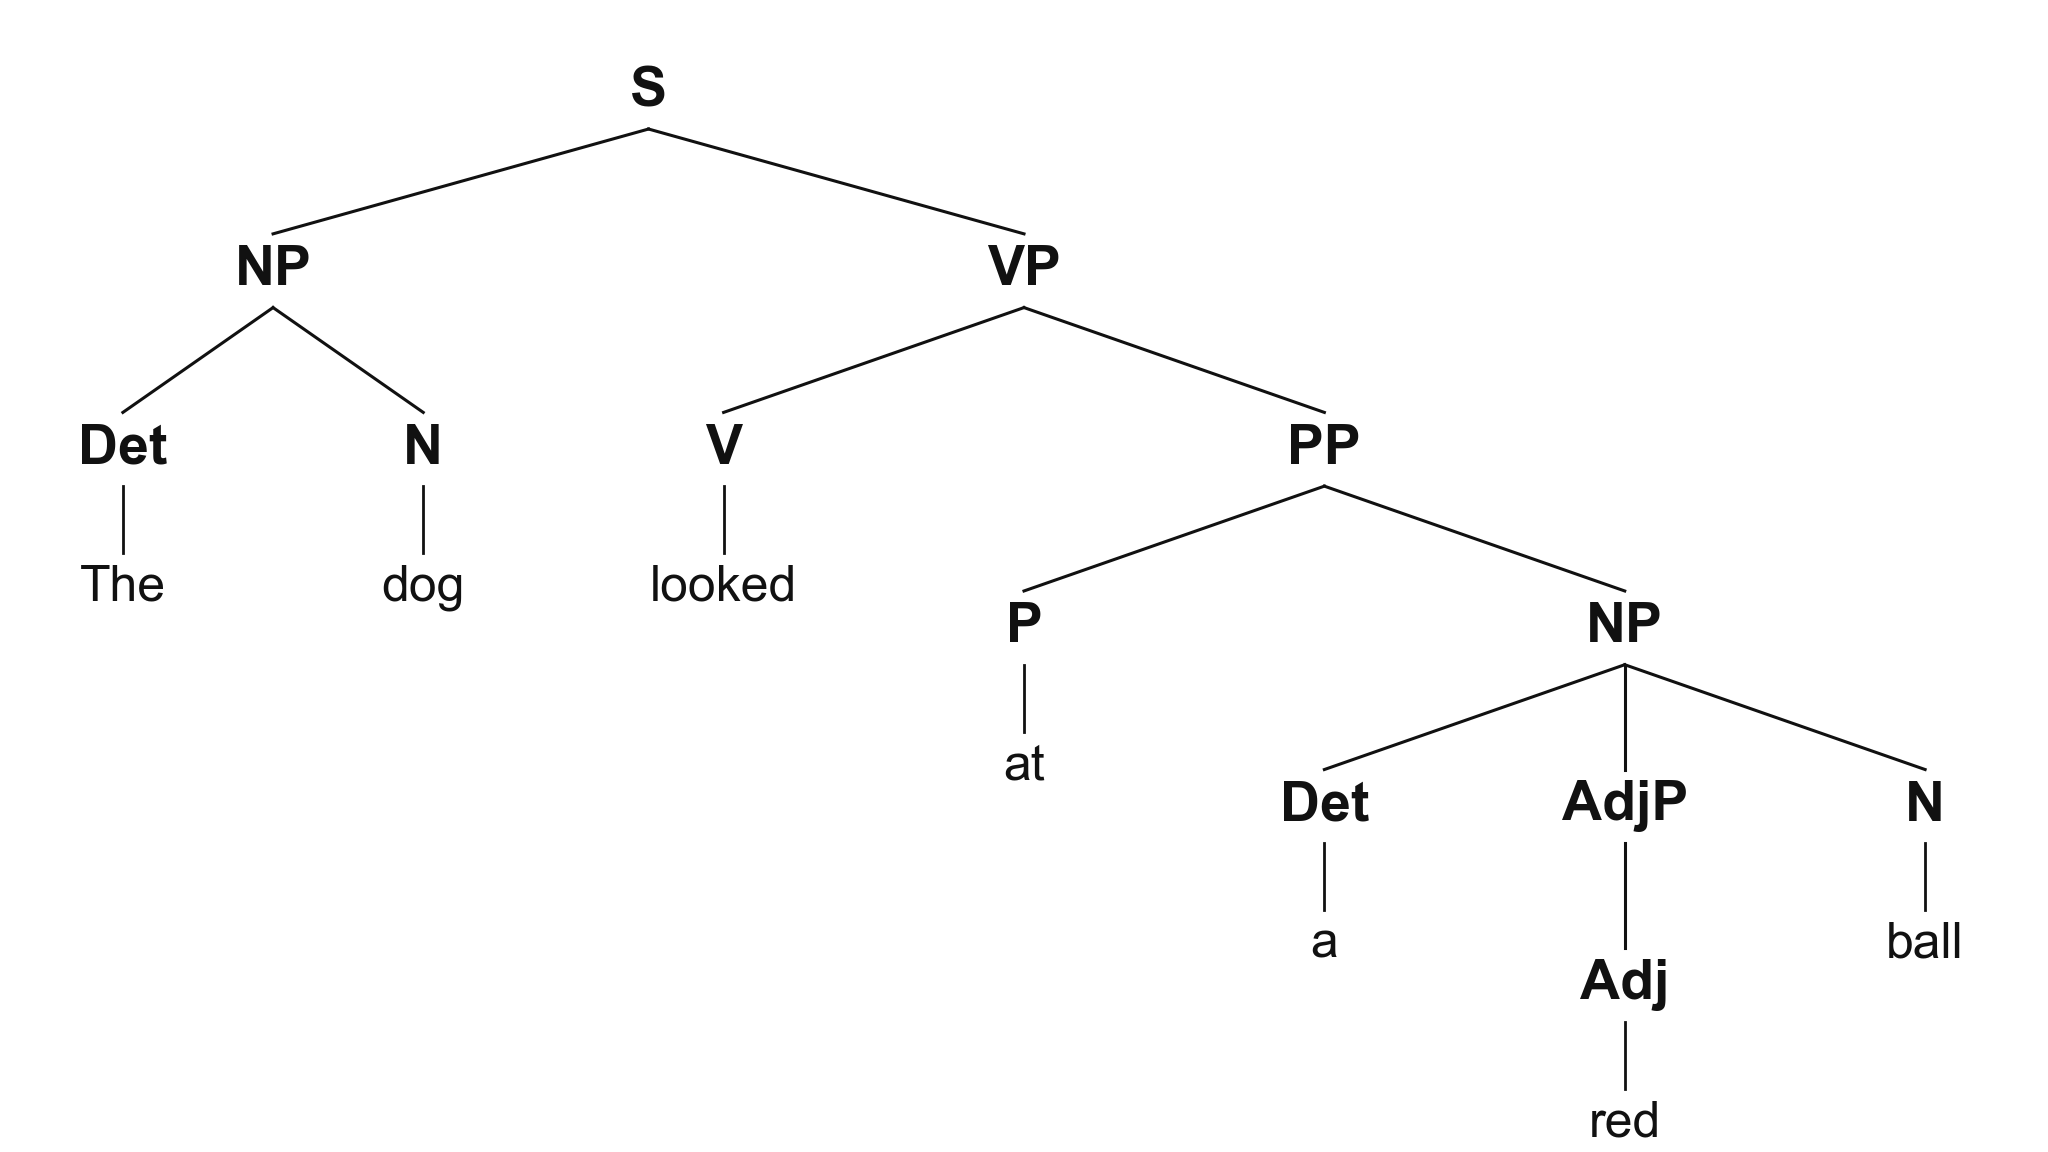 Syntactic Tree Generator
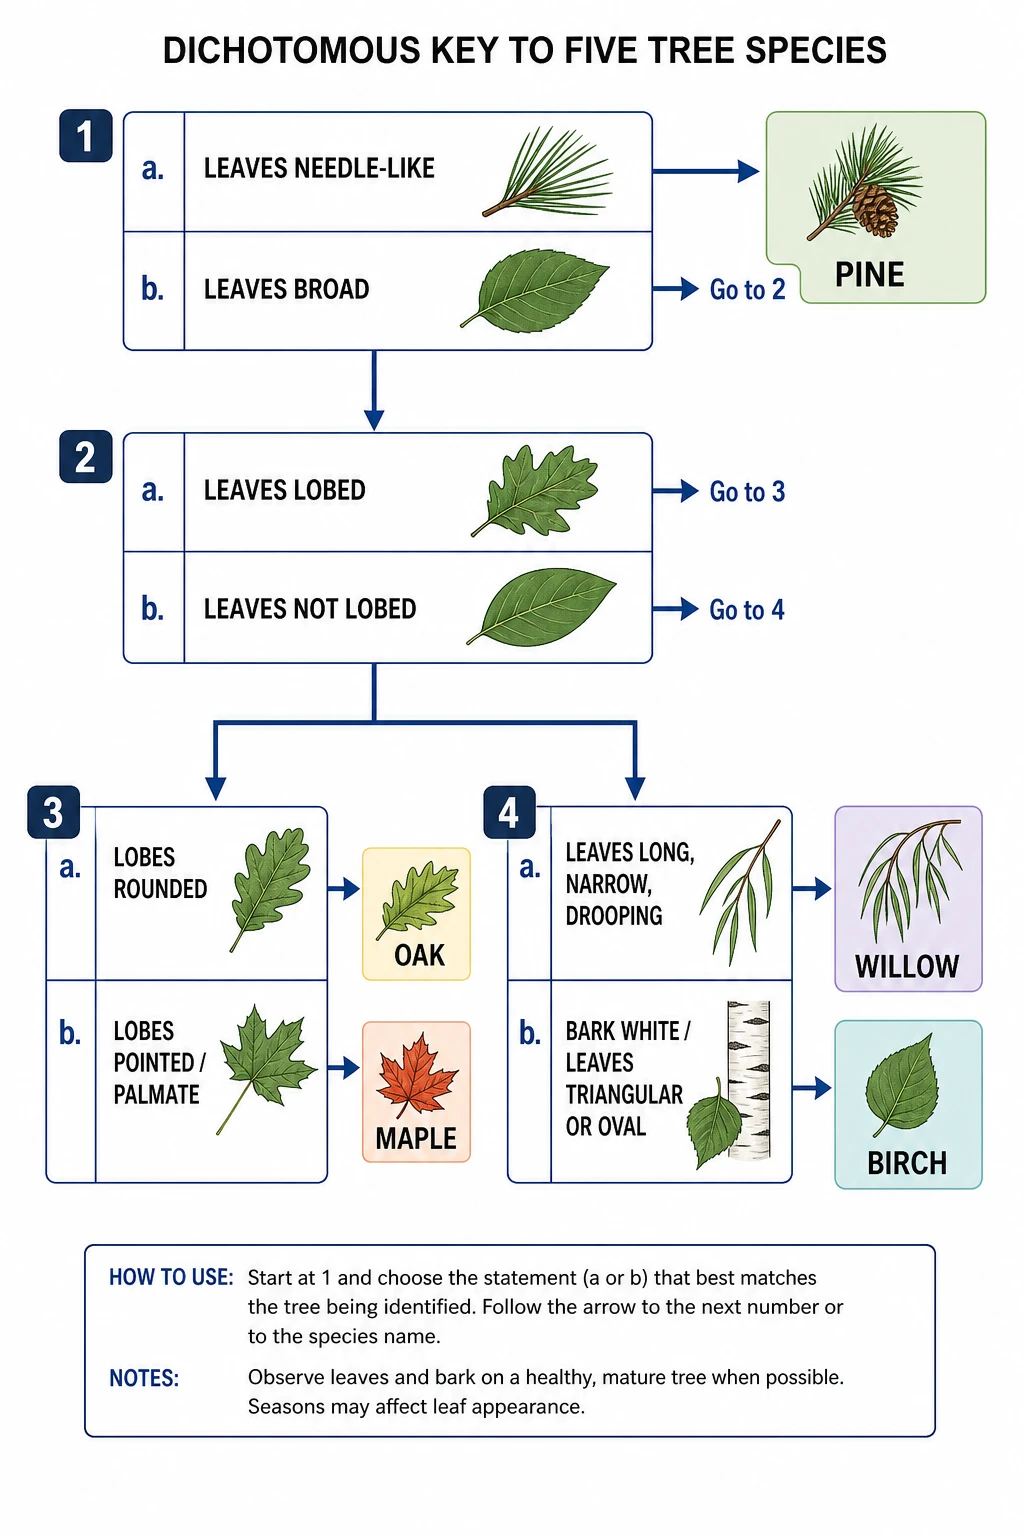 Dichotomous Key Maker
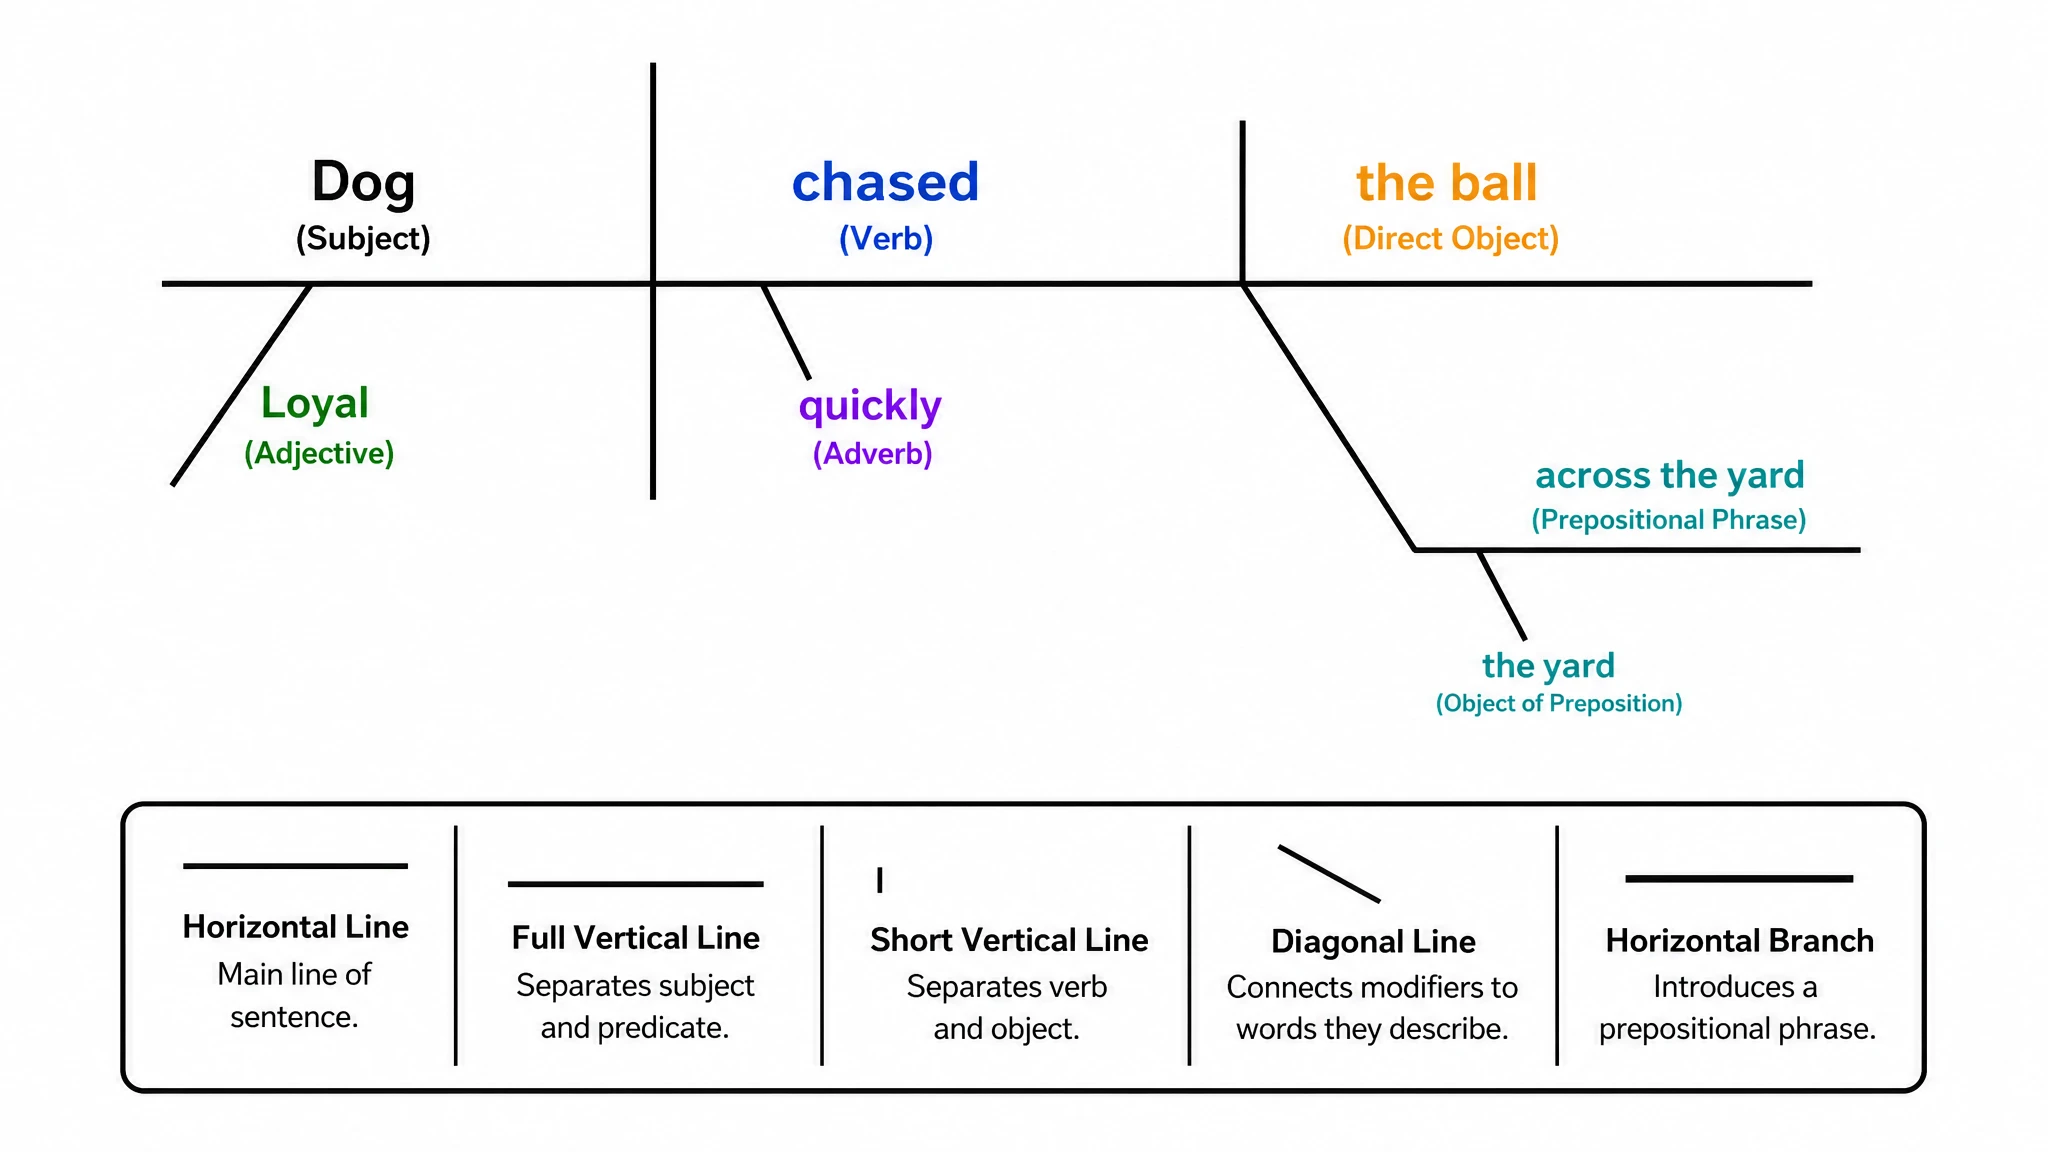 Sentence Diagram Generator
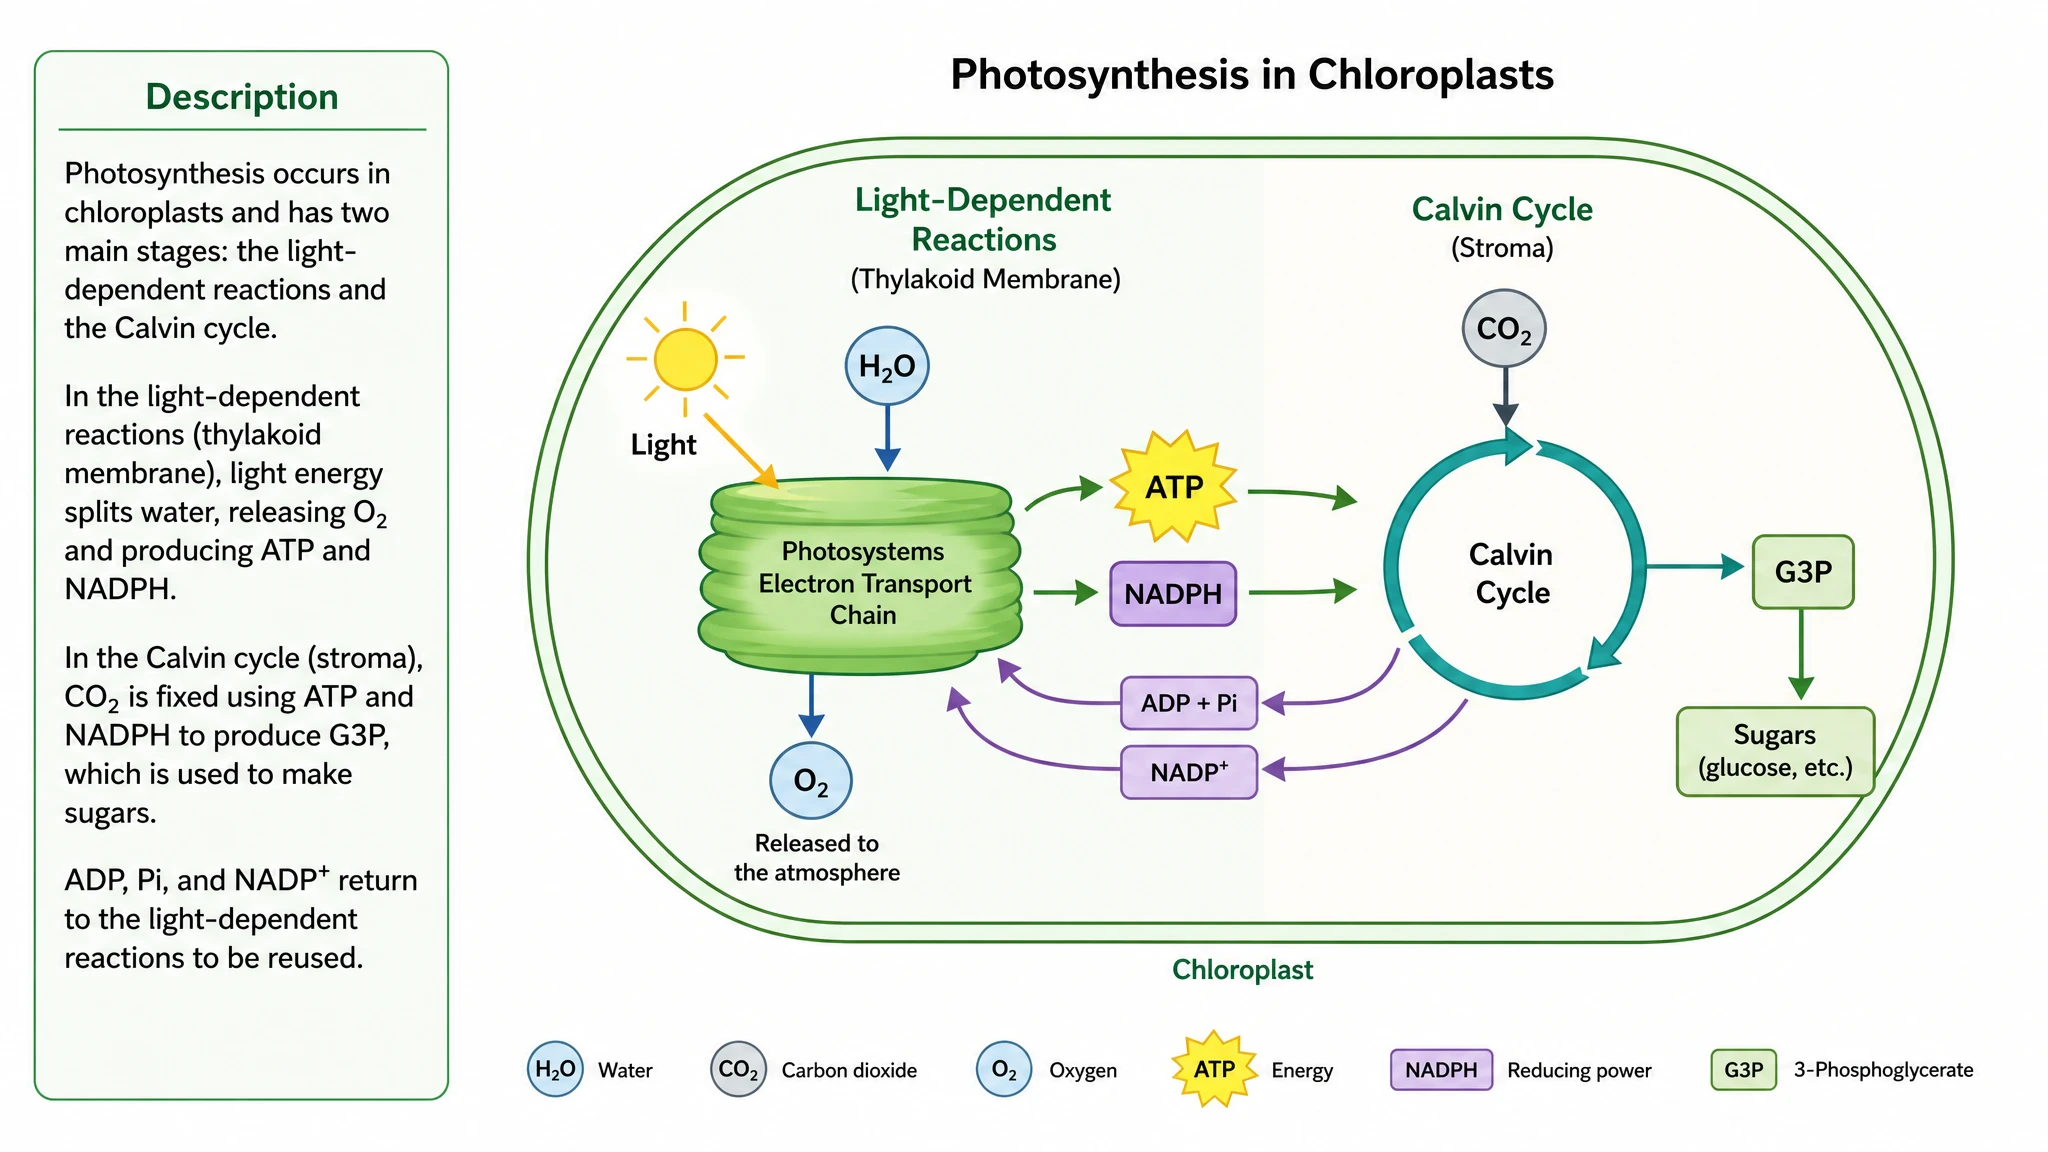 Text to Diagram Generator
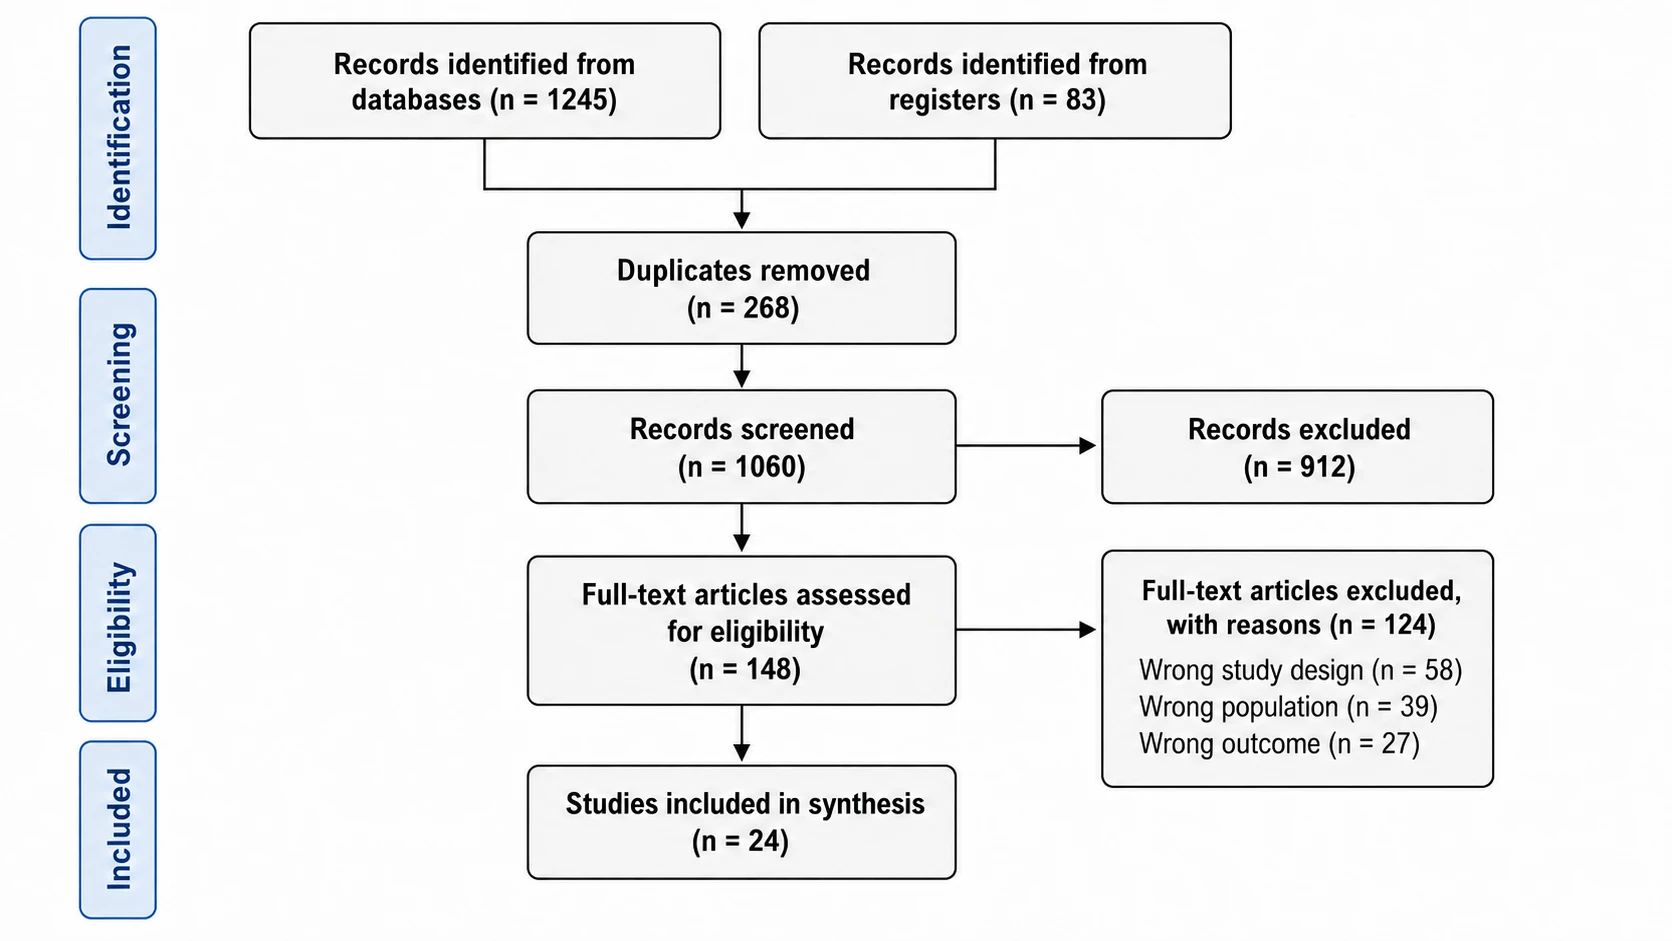 PRISMA Flow Diagram Generator
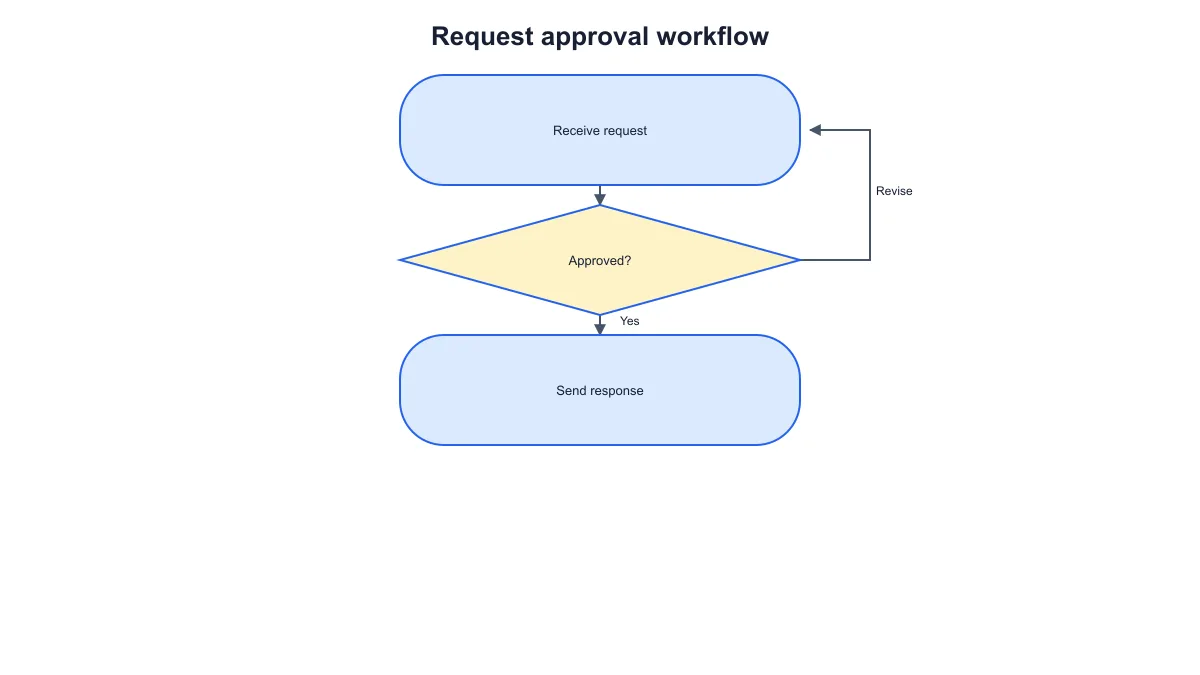 Workflow Diagram Generator
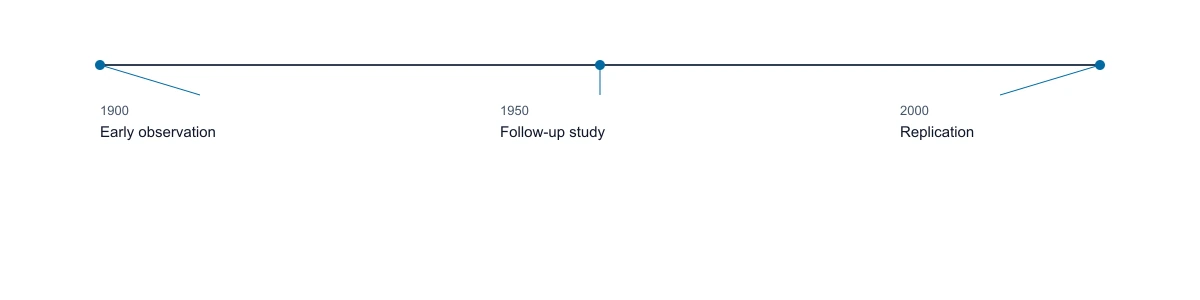 Timeline Generator
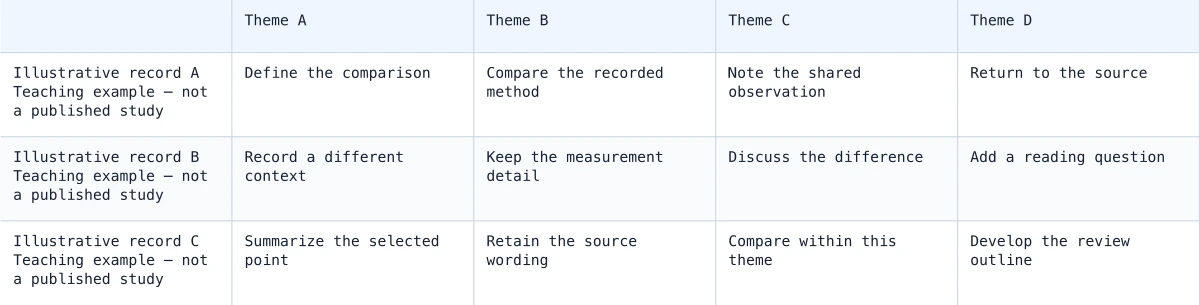 Synthesis Matrix Generator
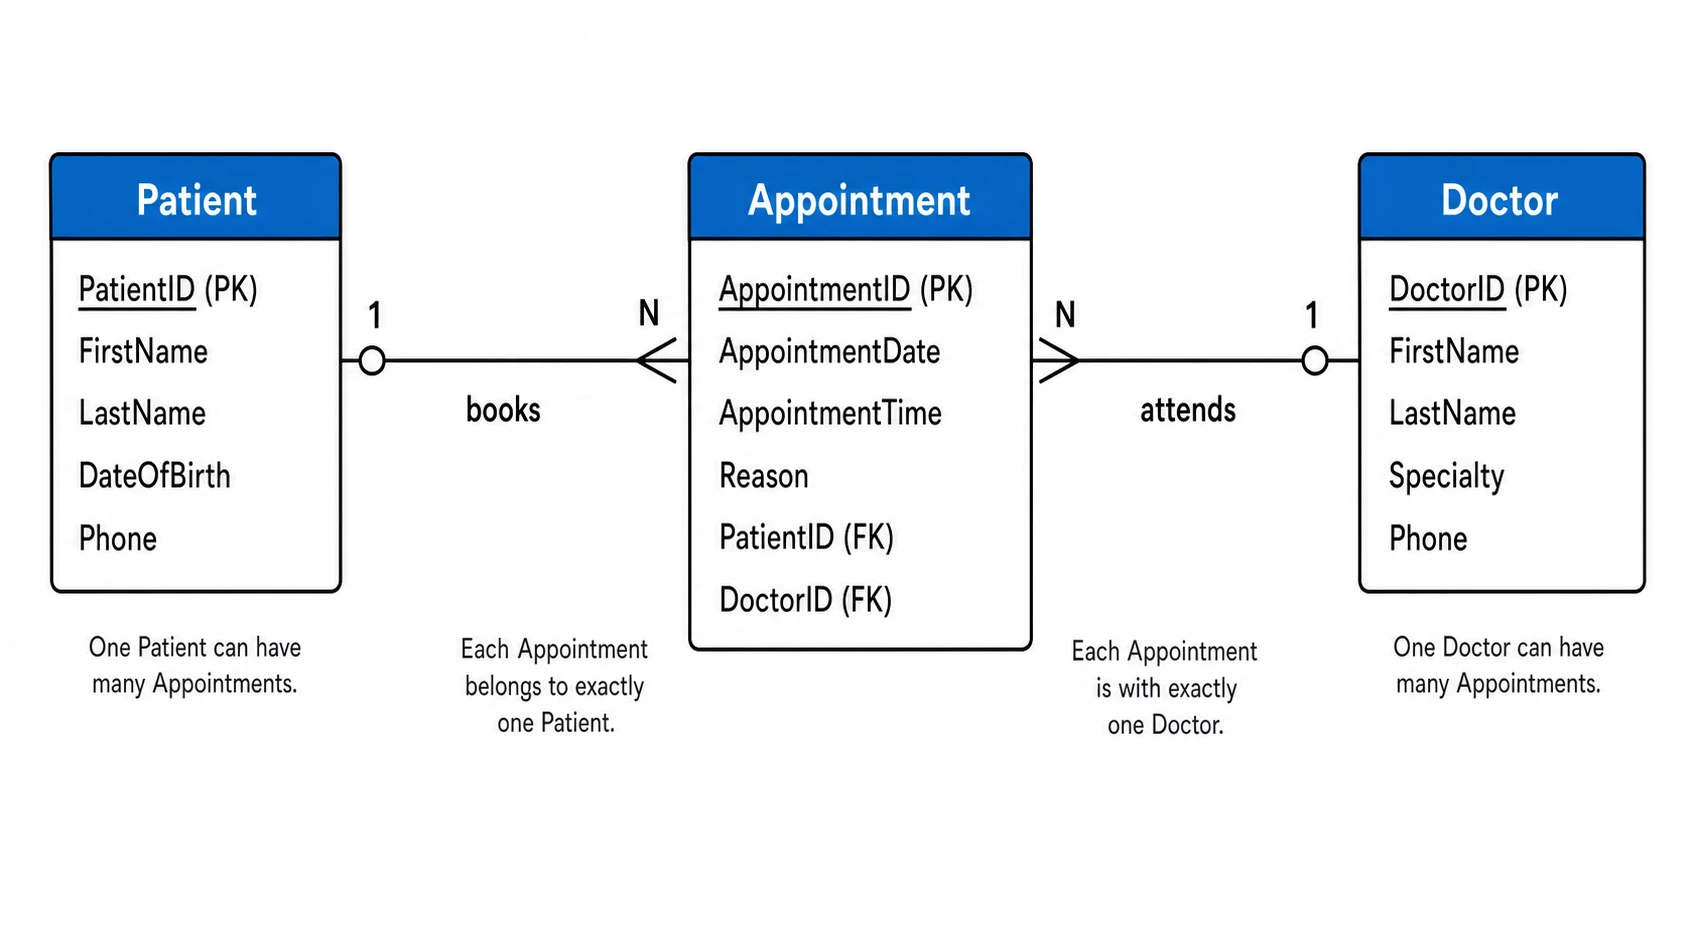 ER Diagram Generator
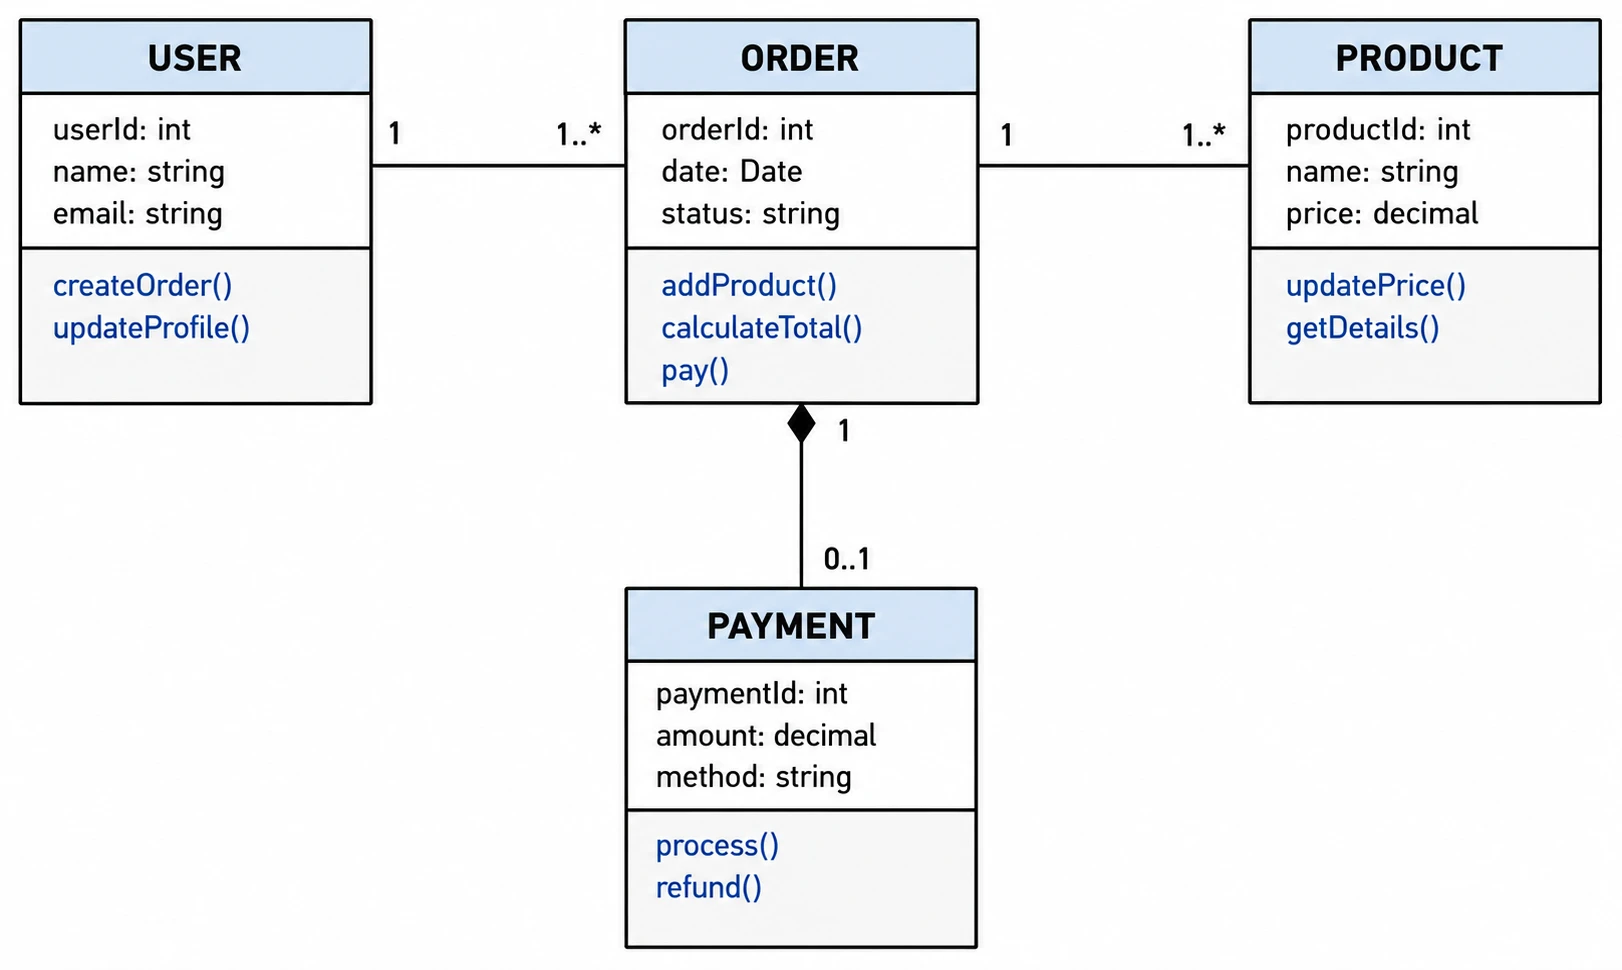 UML Diagram Generator
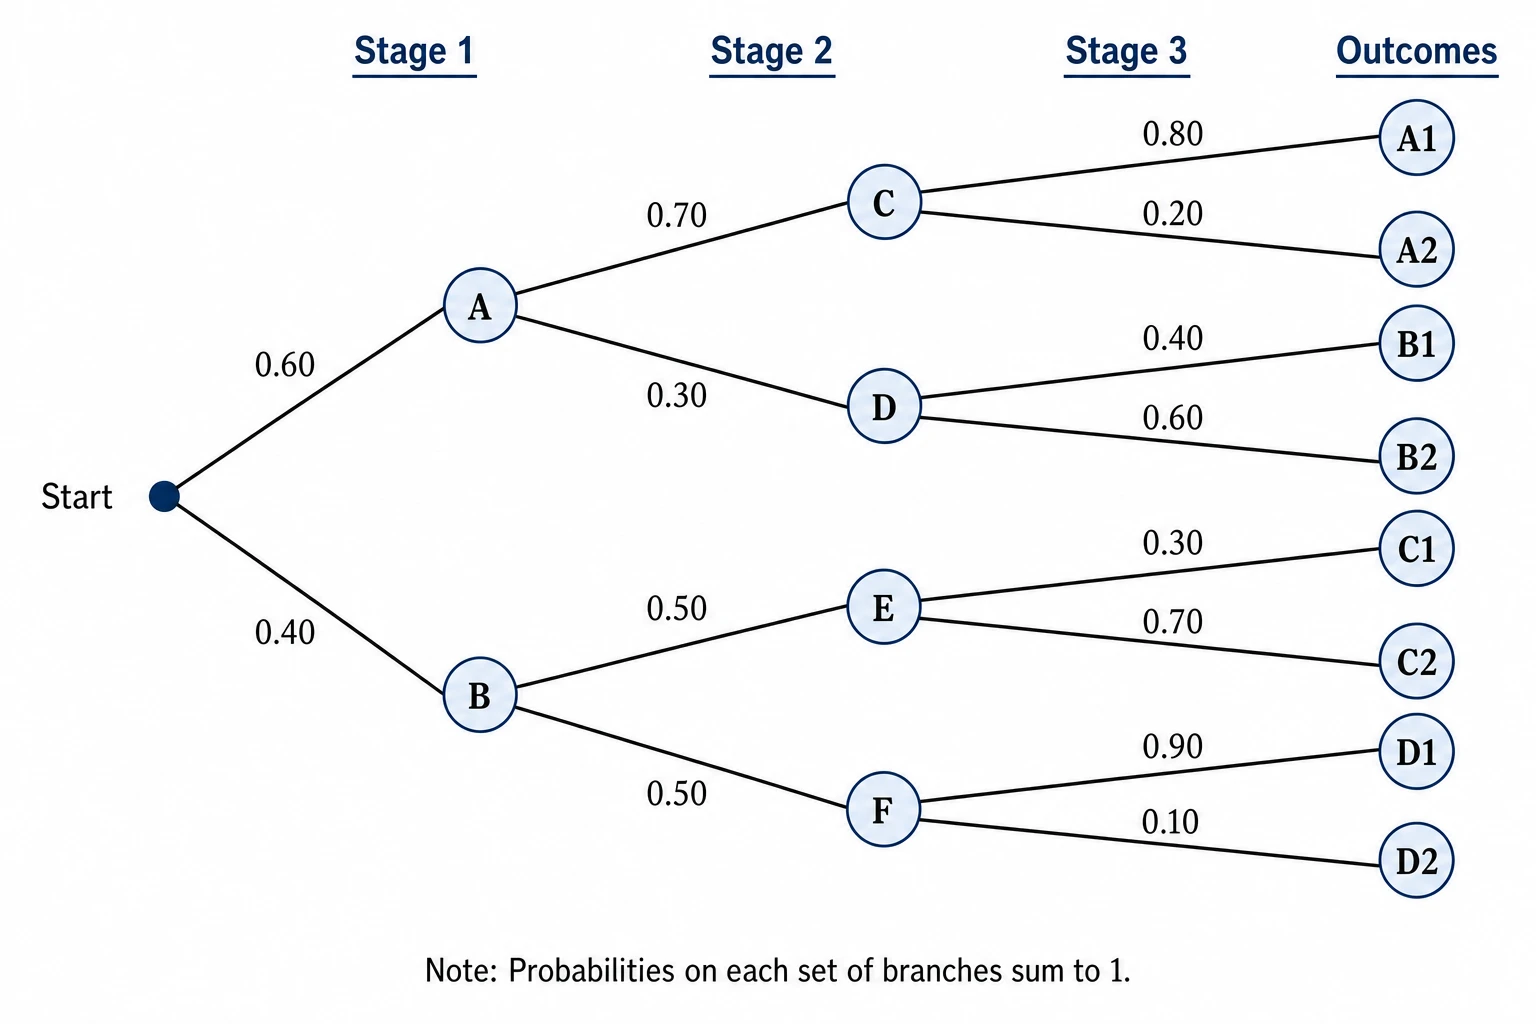 Tree Diagram Generator
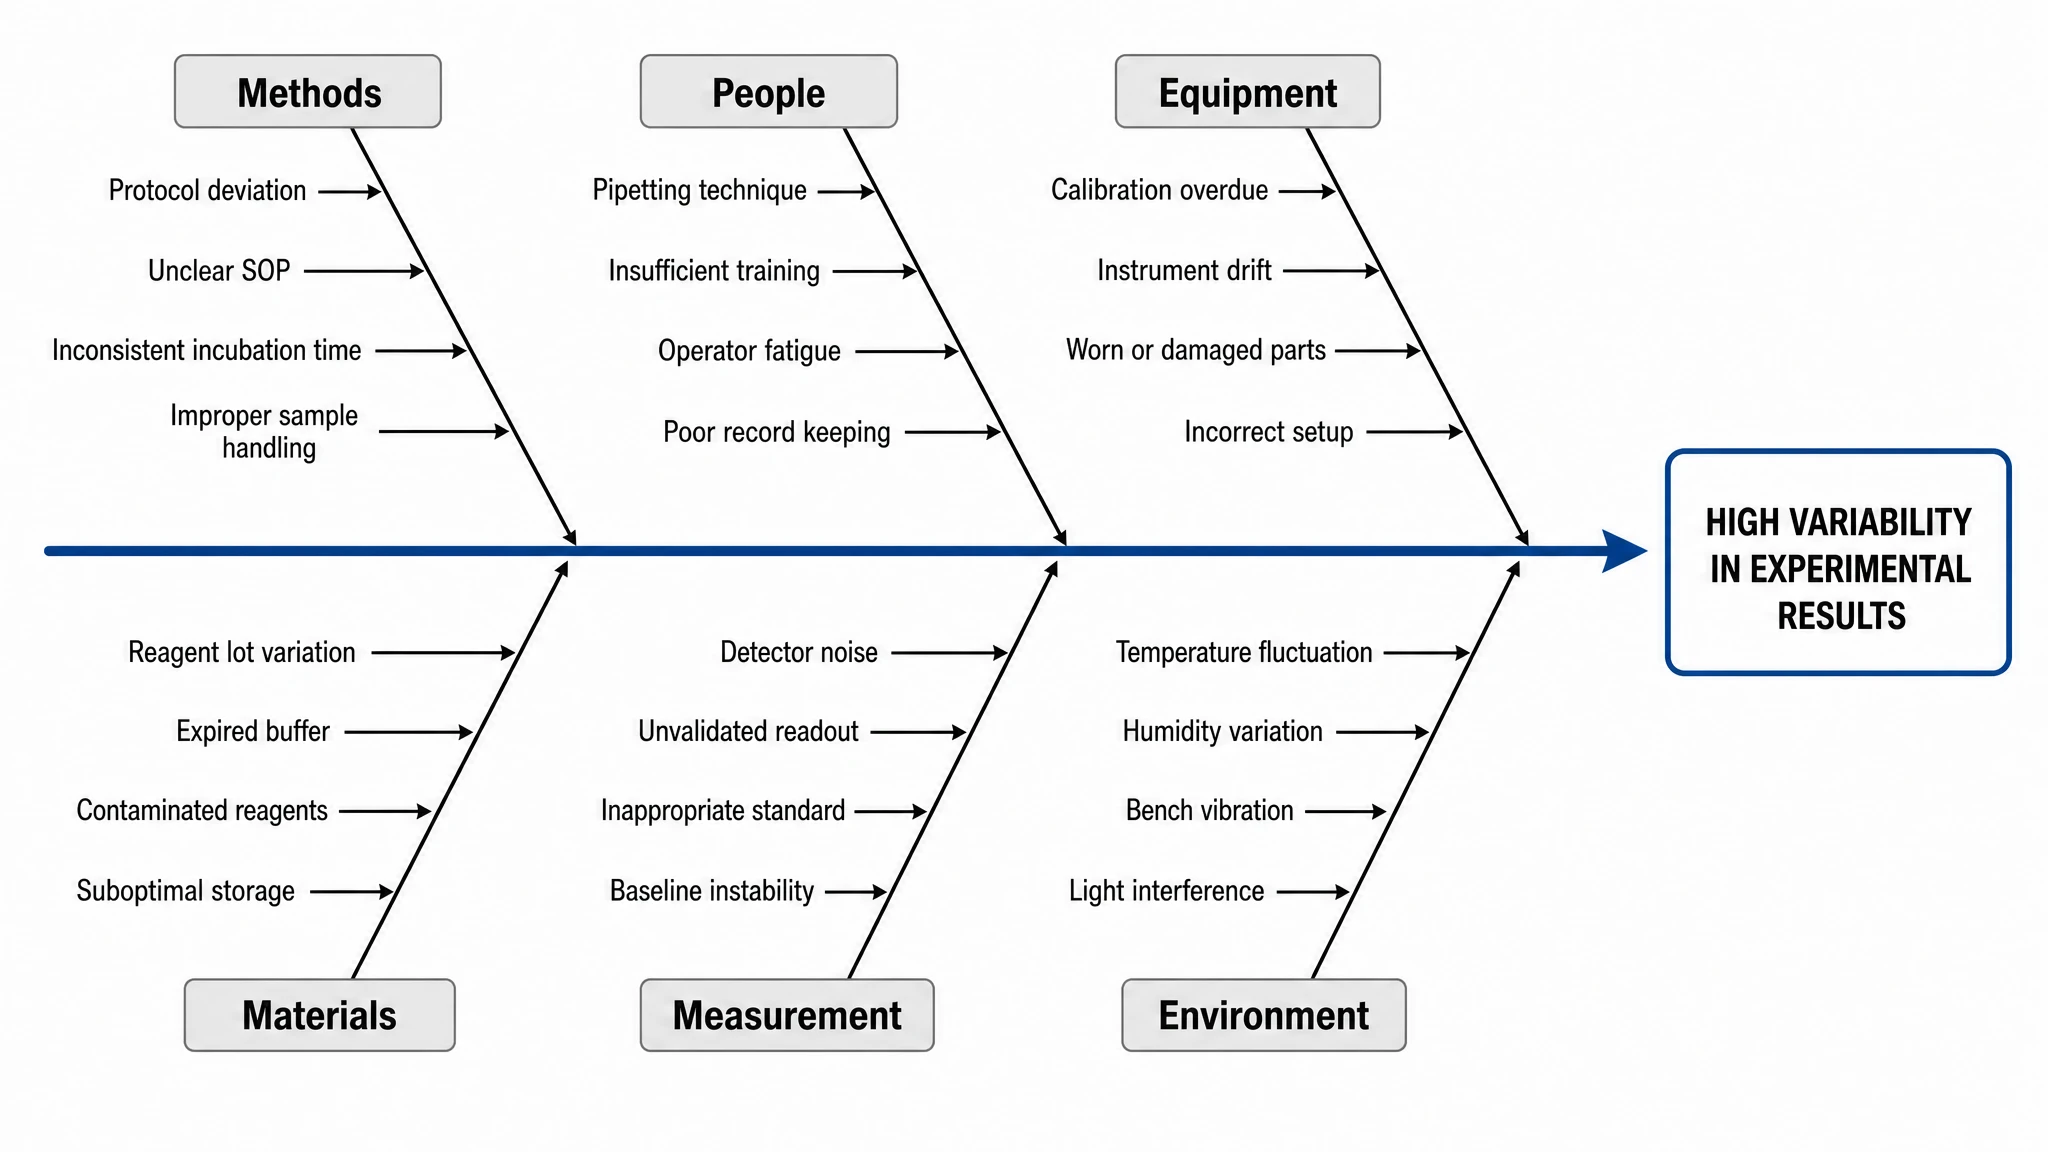 Fishbone Diagram Generator
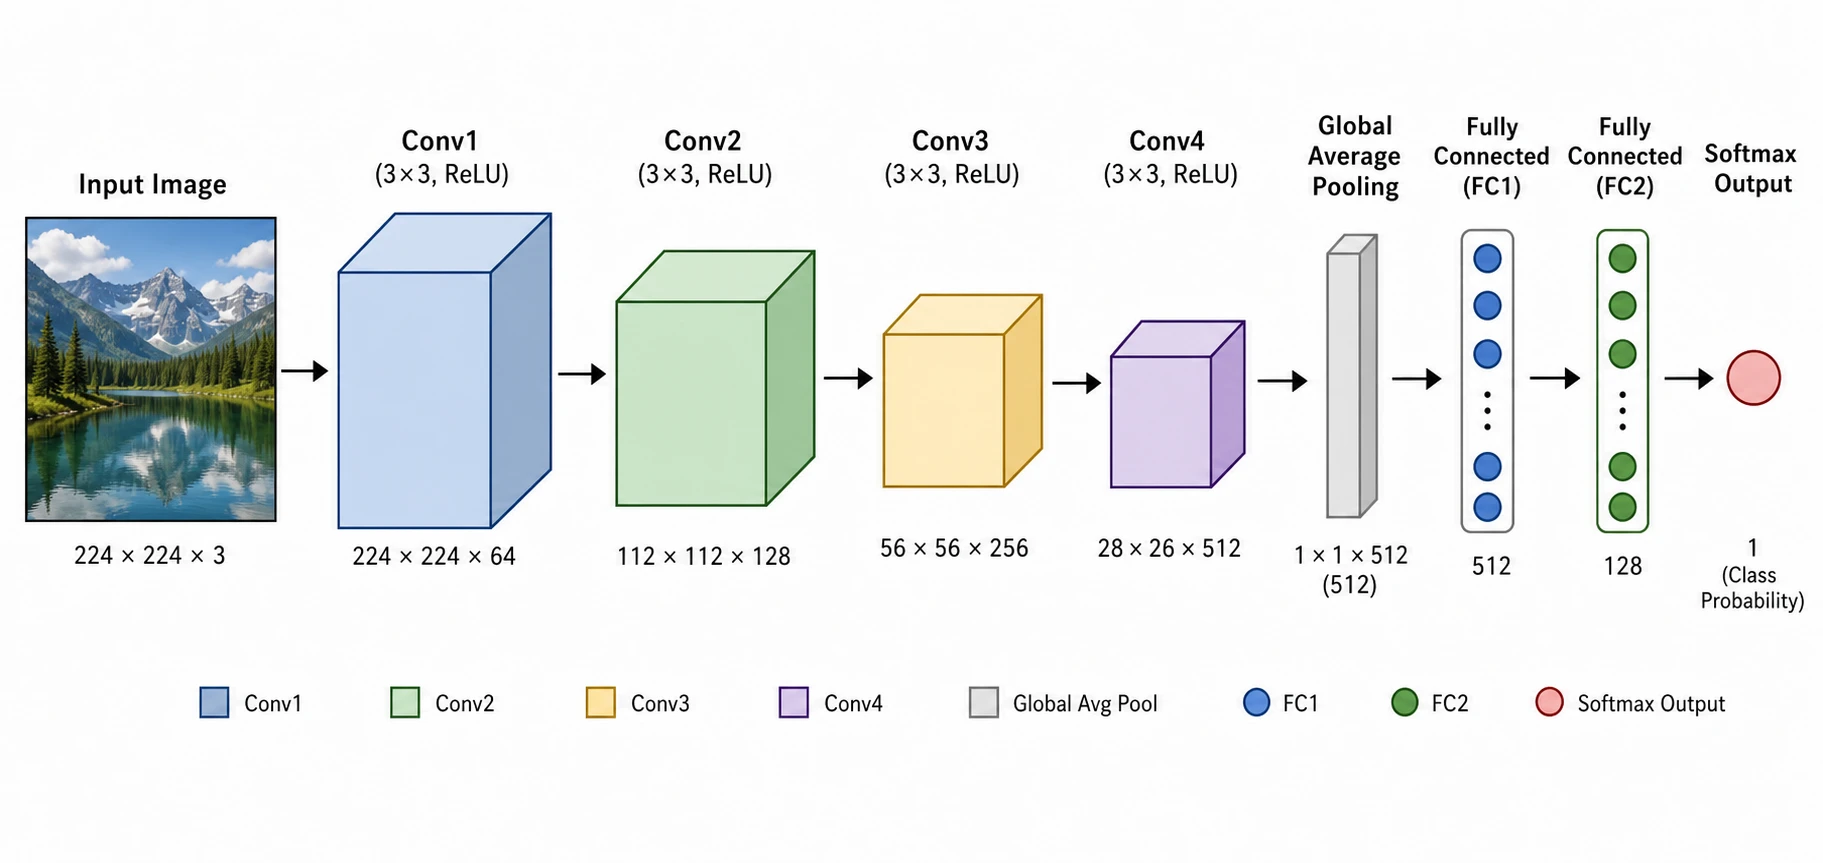 Neural Network Diagram Generator
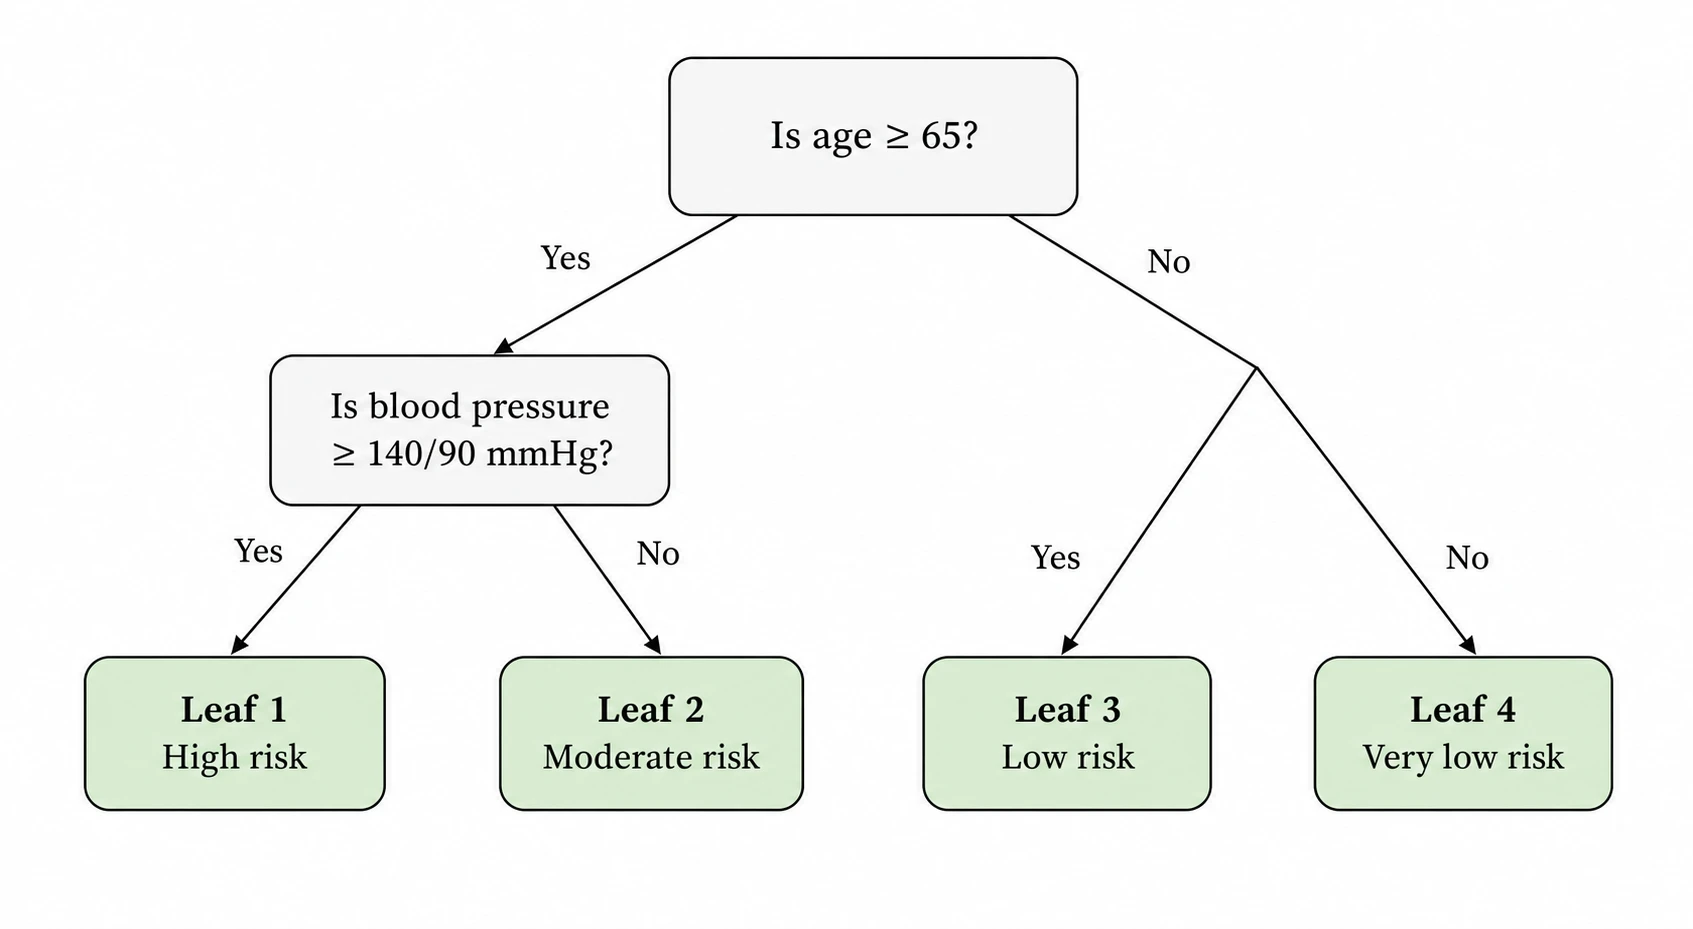 Decision Tree Generator
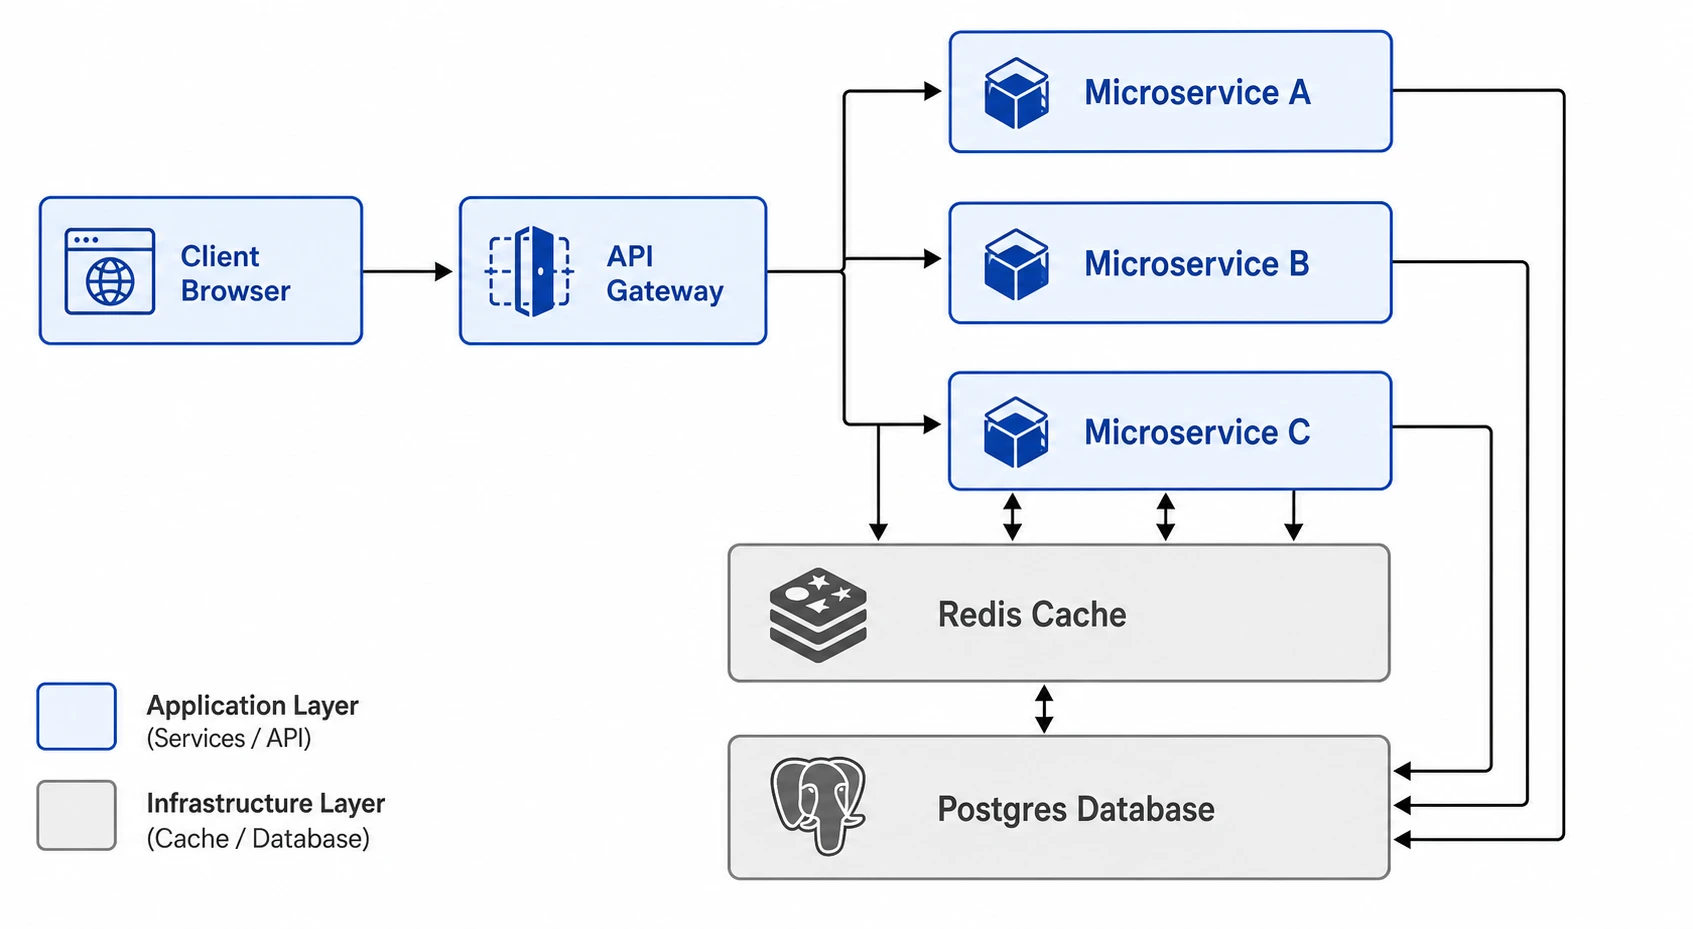 Software Architecture Diagram Generator
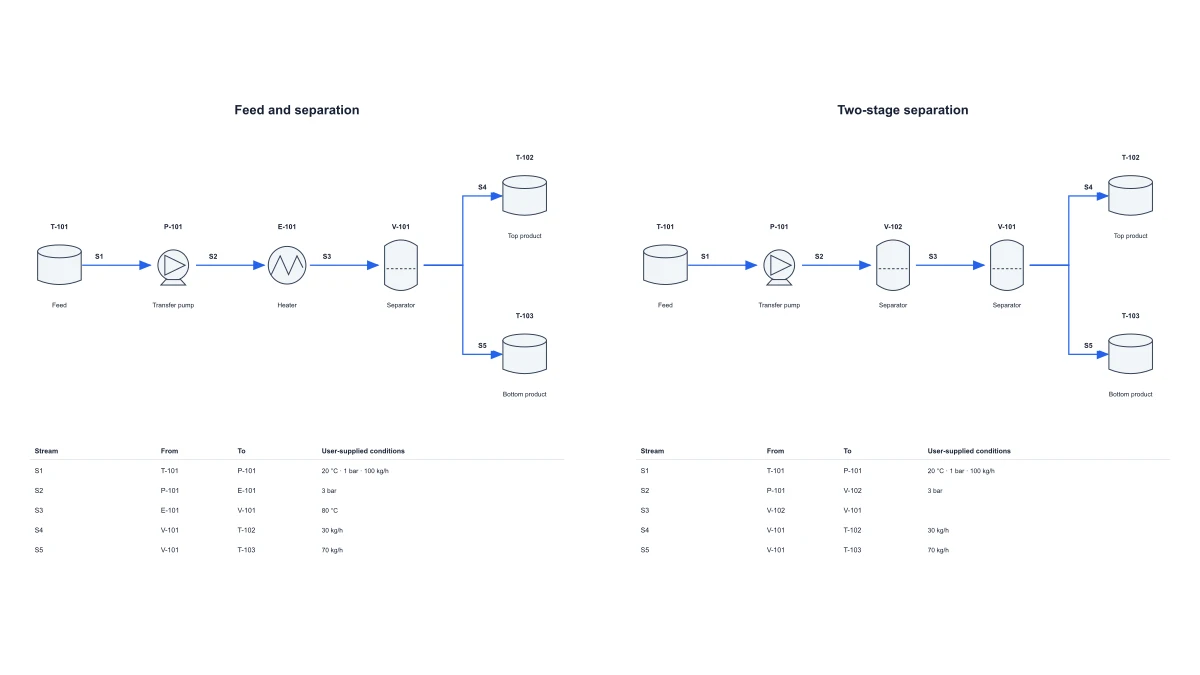 Chemical Process Flow Diagram Maker
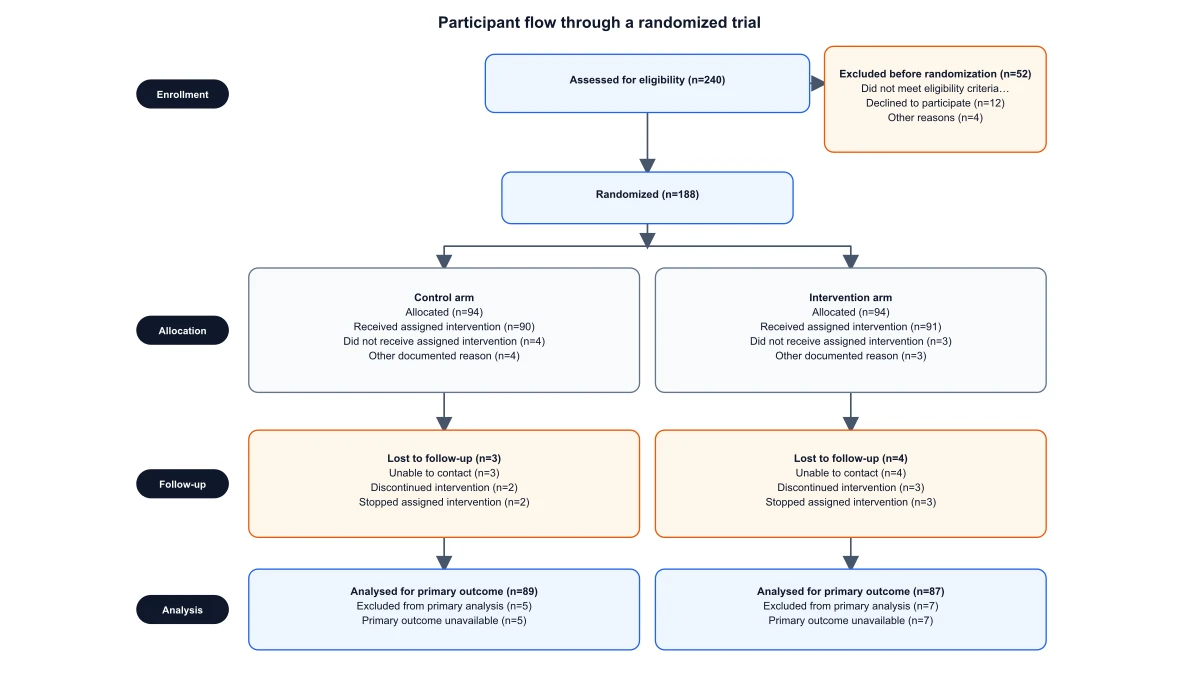 CONSORT Flow Diagram Generator
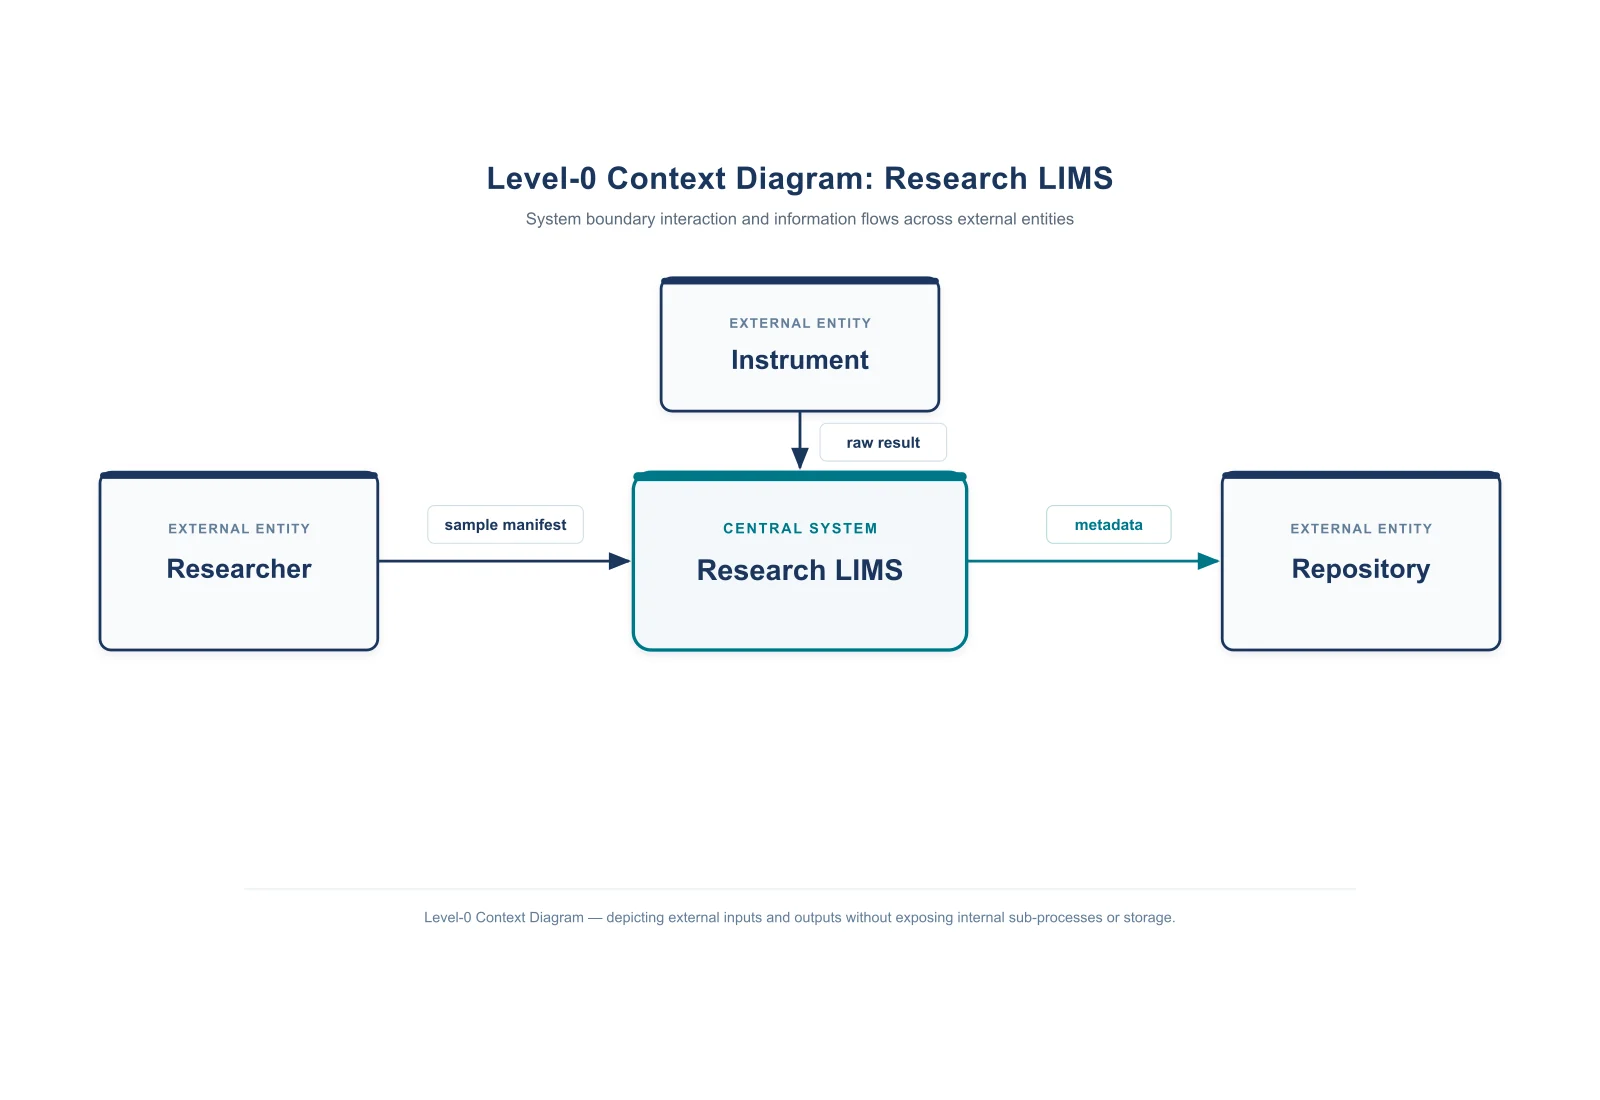 Context Diagram Creator
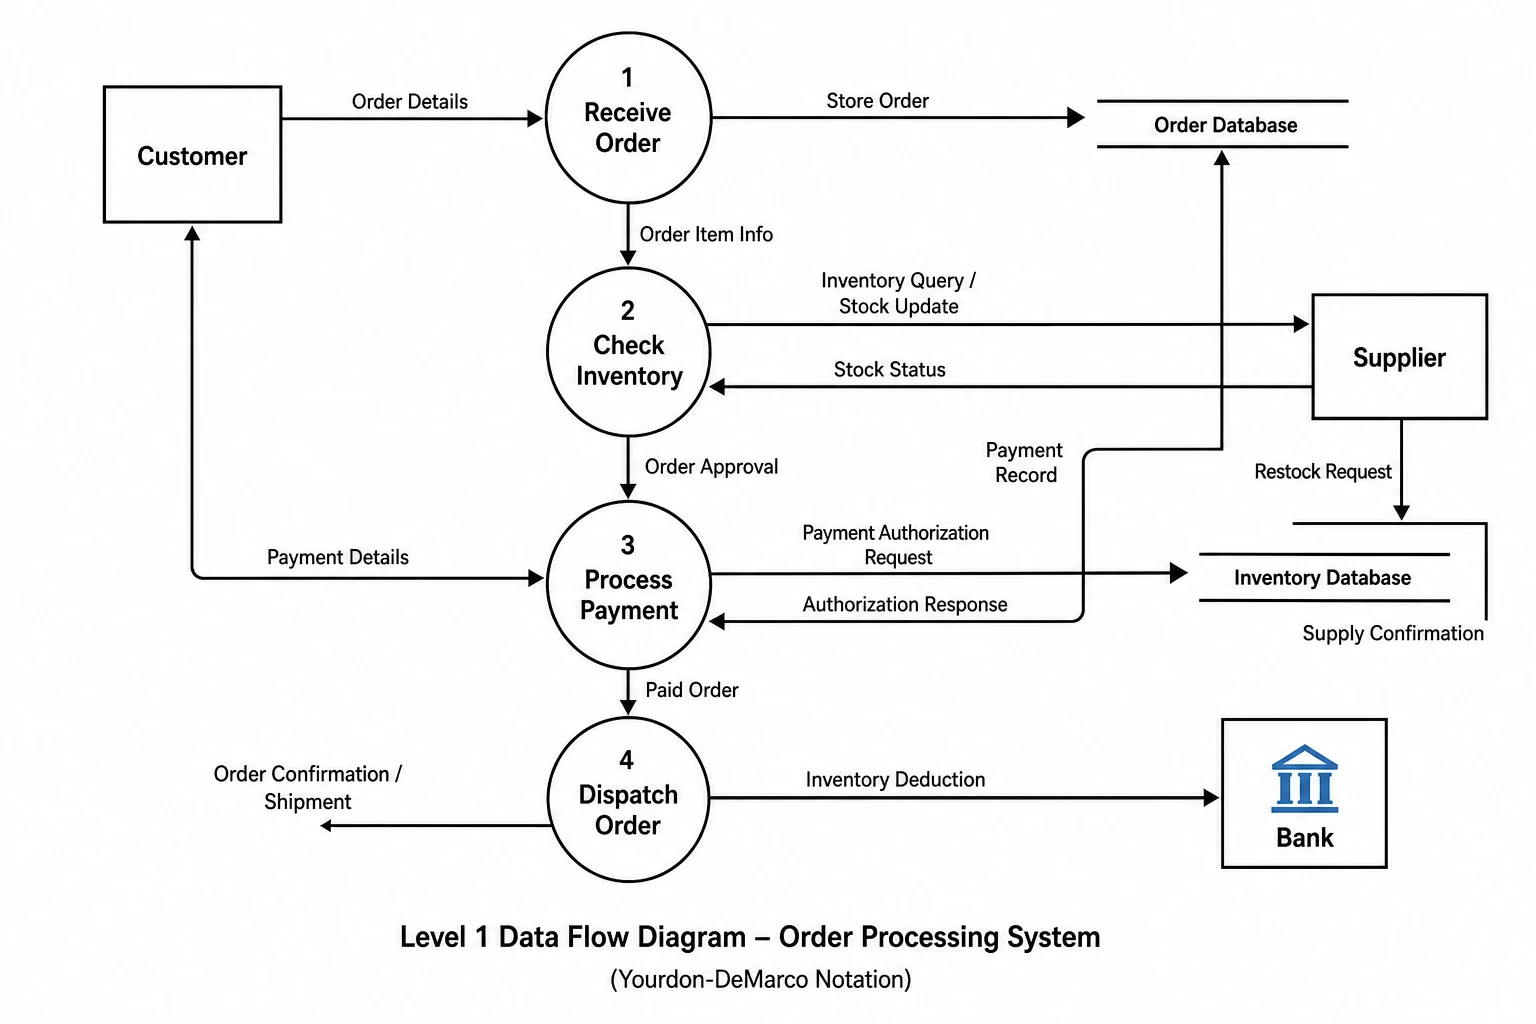 Data Flow Diagram Generator
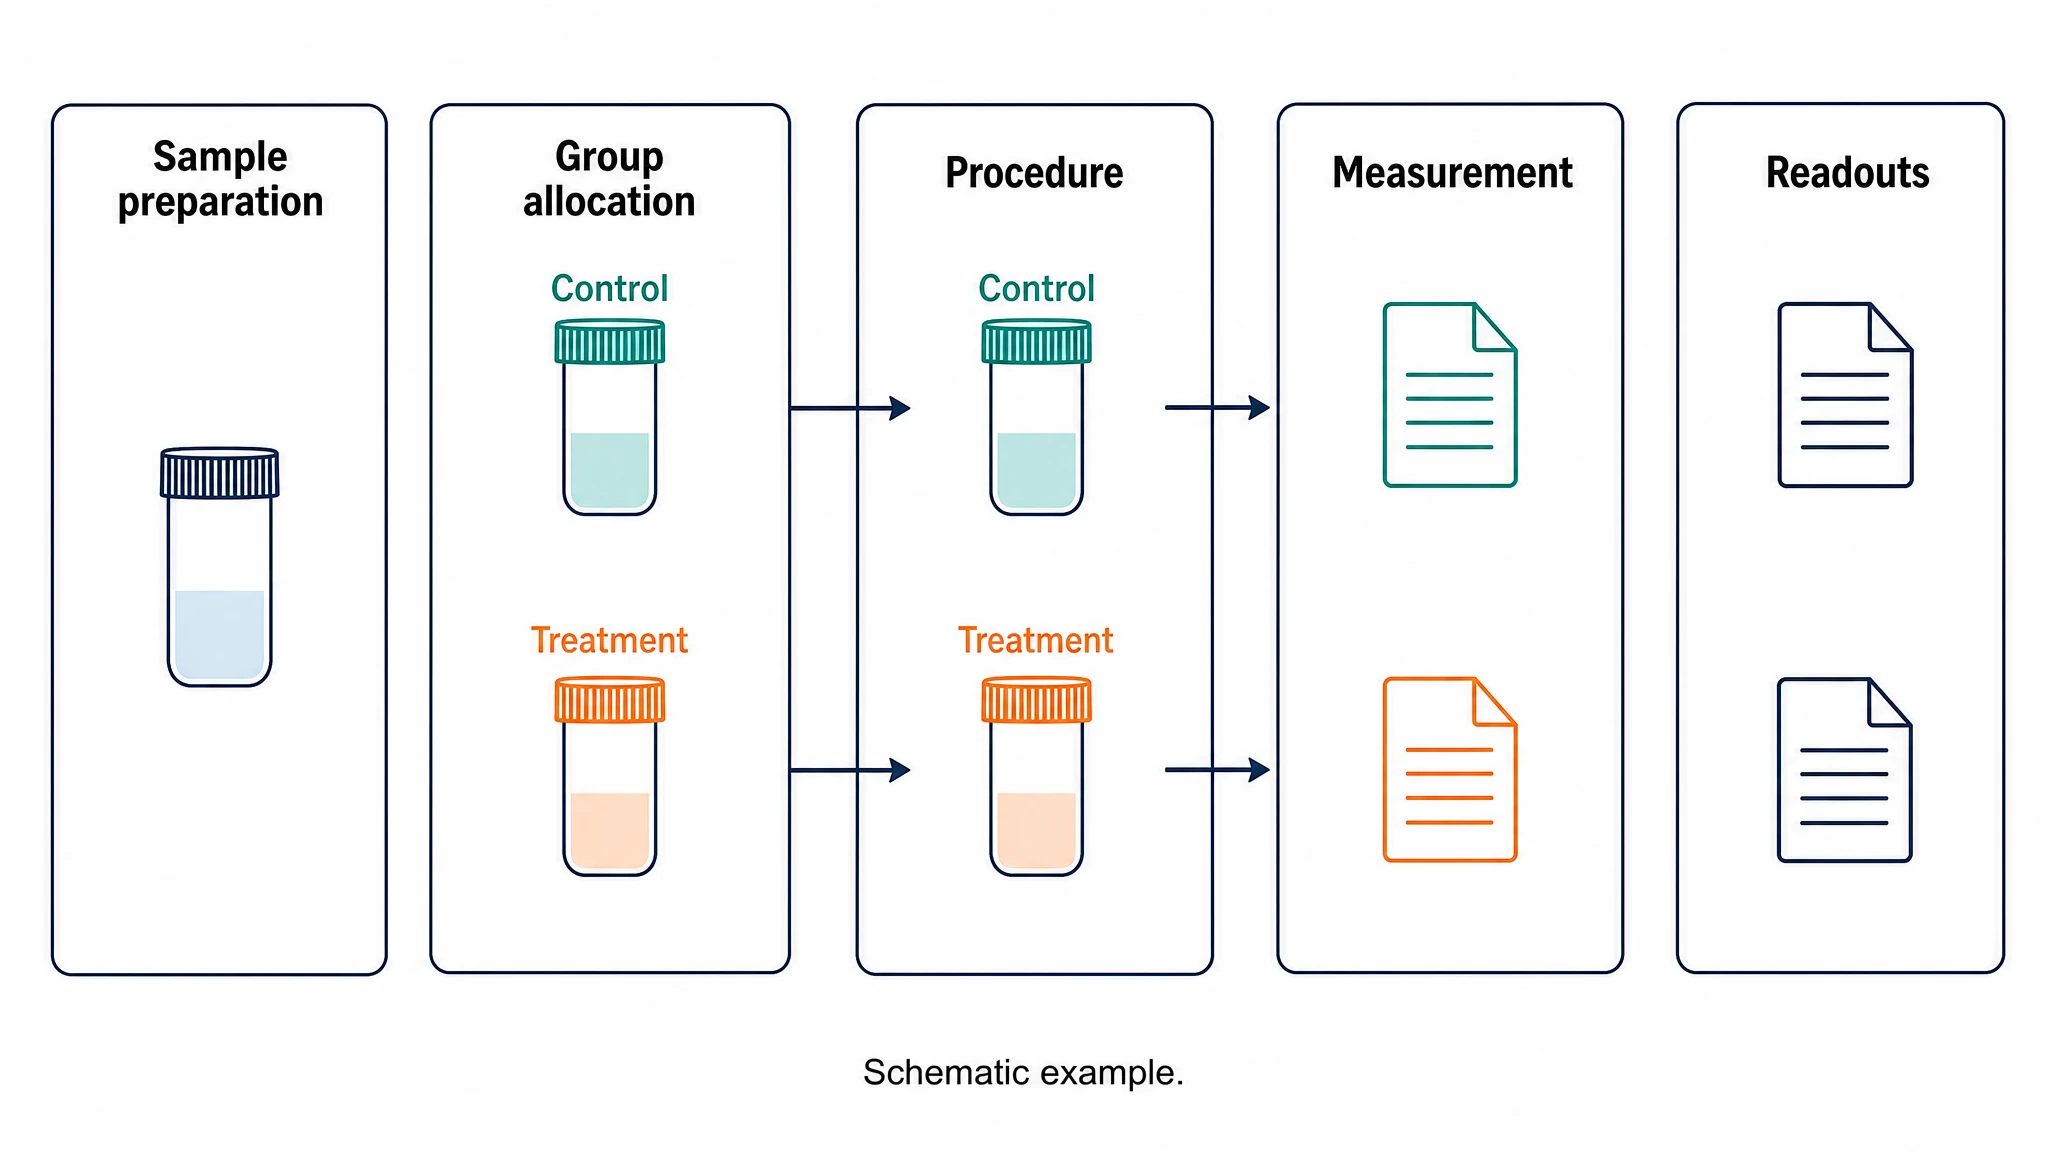 Experimental Workflow Diagram
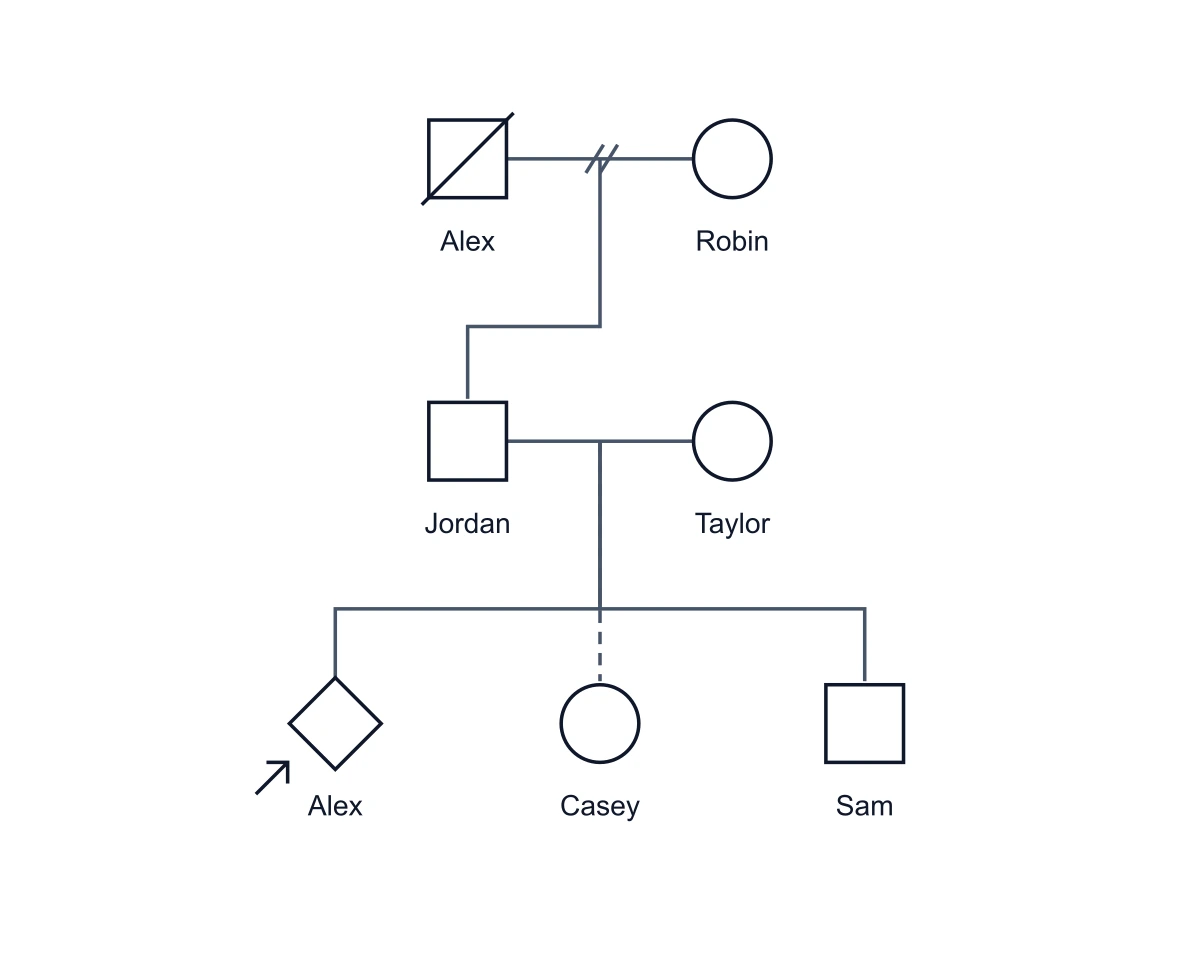 Genogram Maker
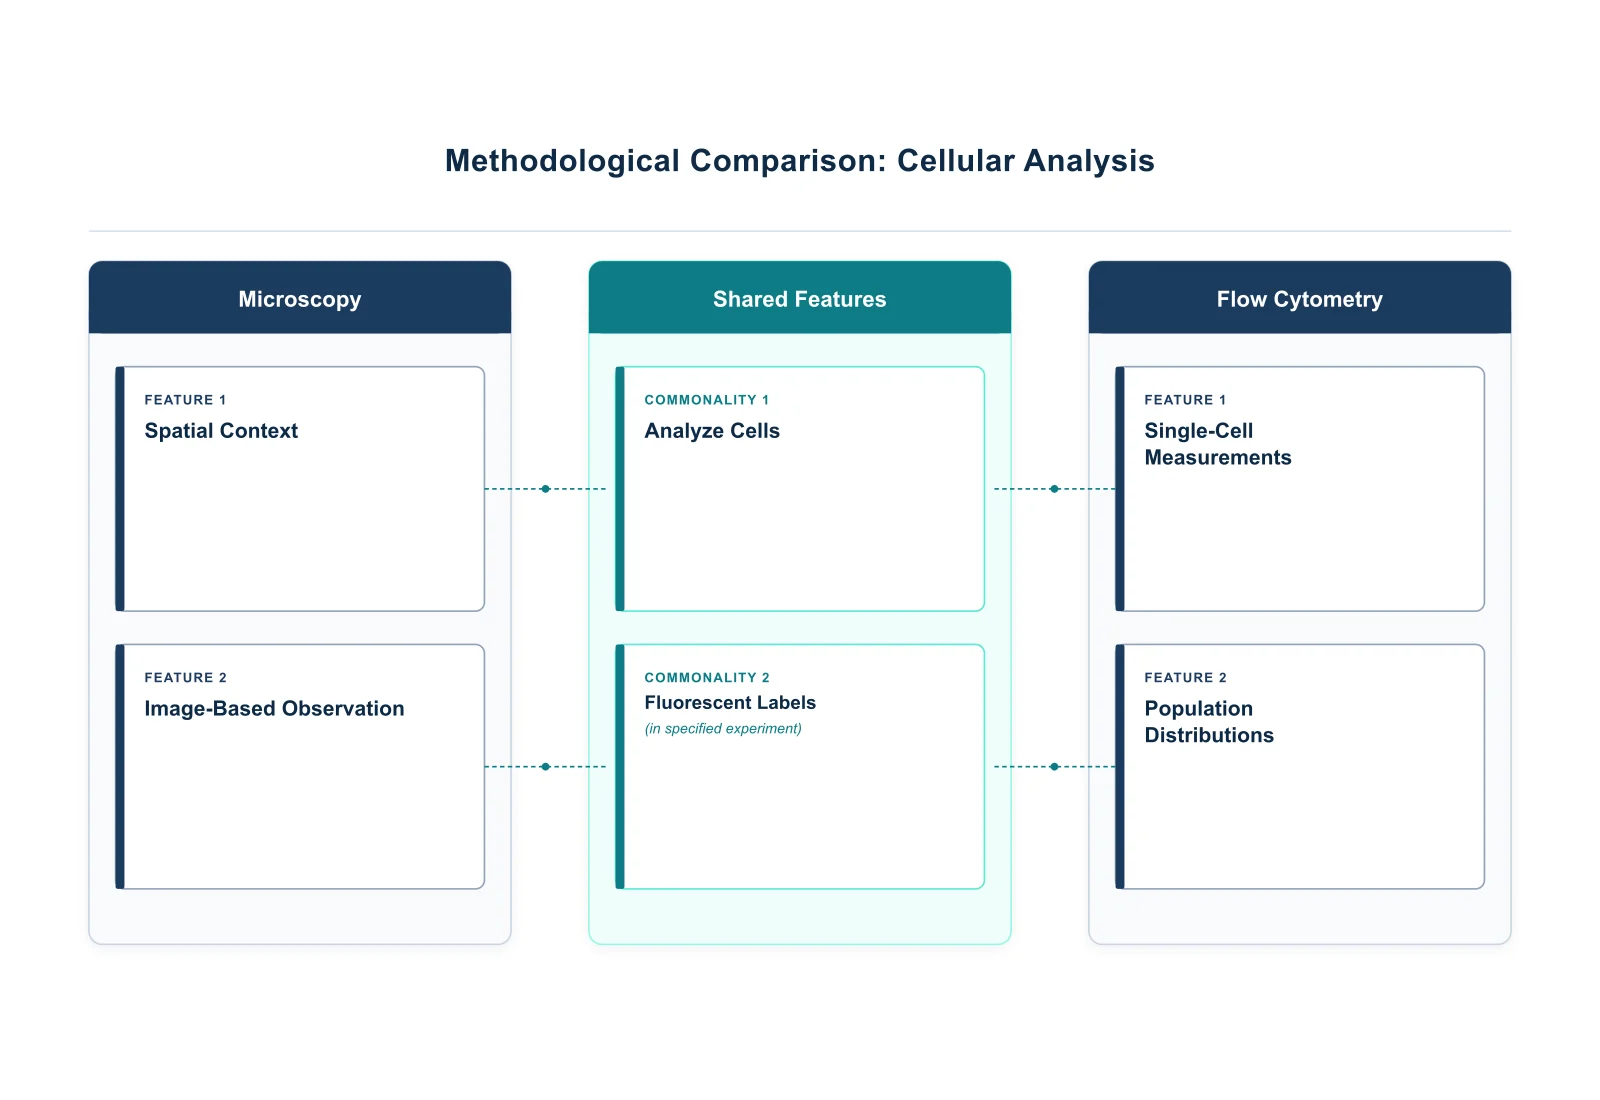 Graphic Organizer Generator
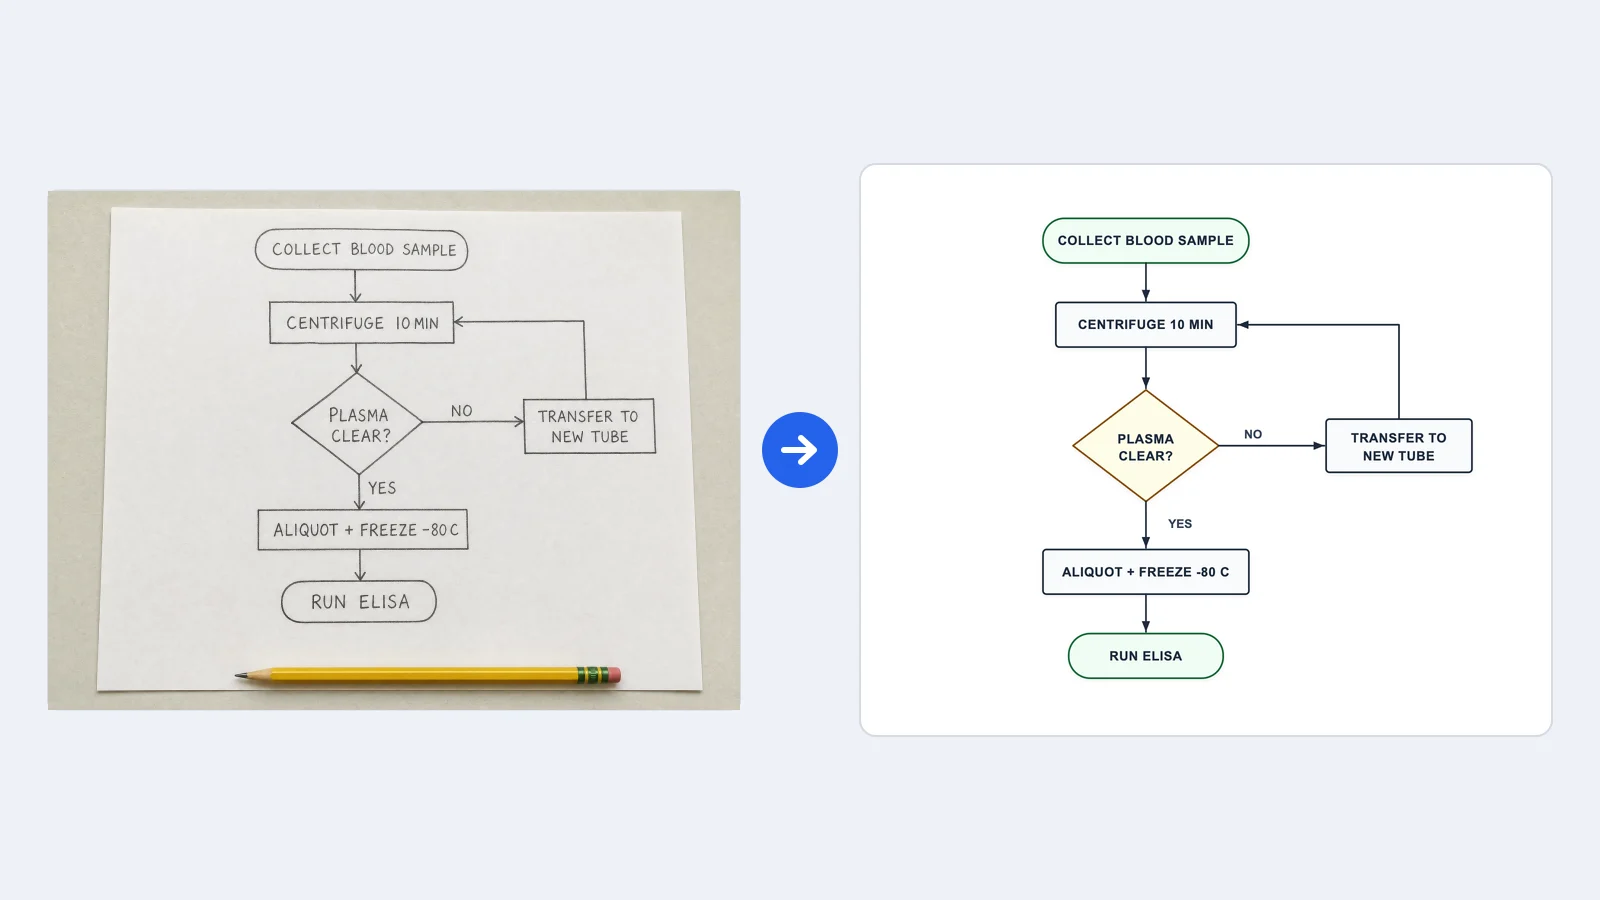 Image to Flowchart Converter
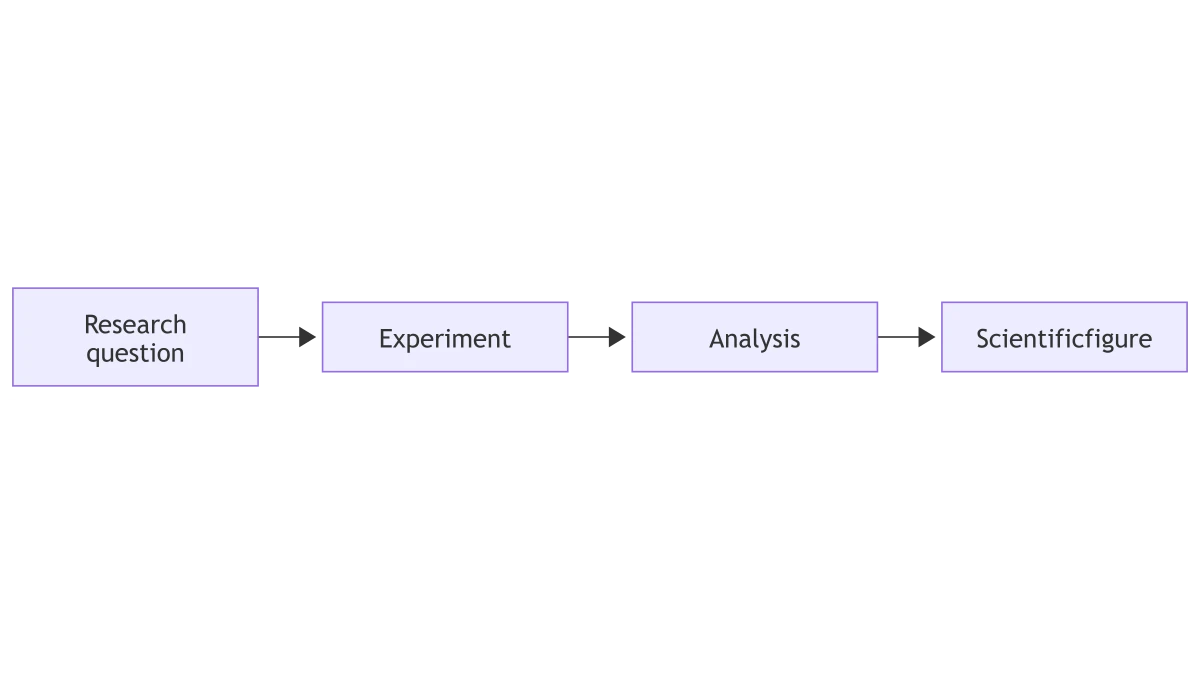 Mermaid to PNG Converter
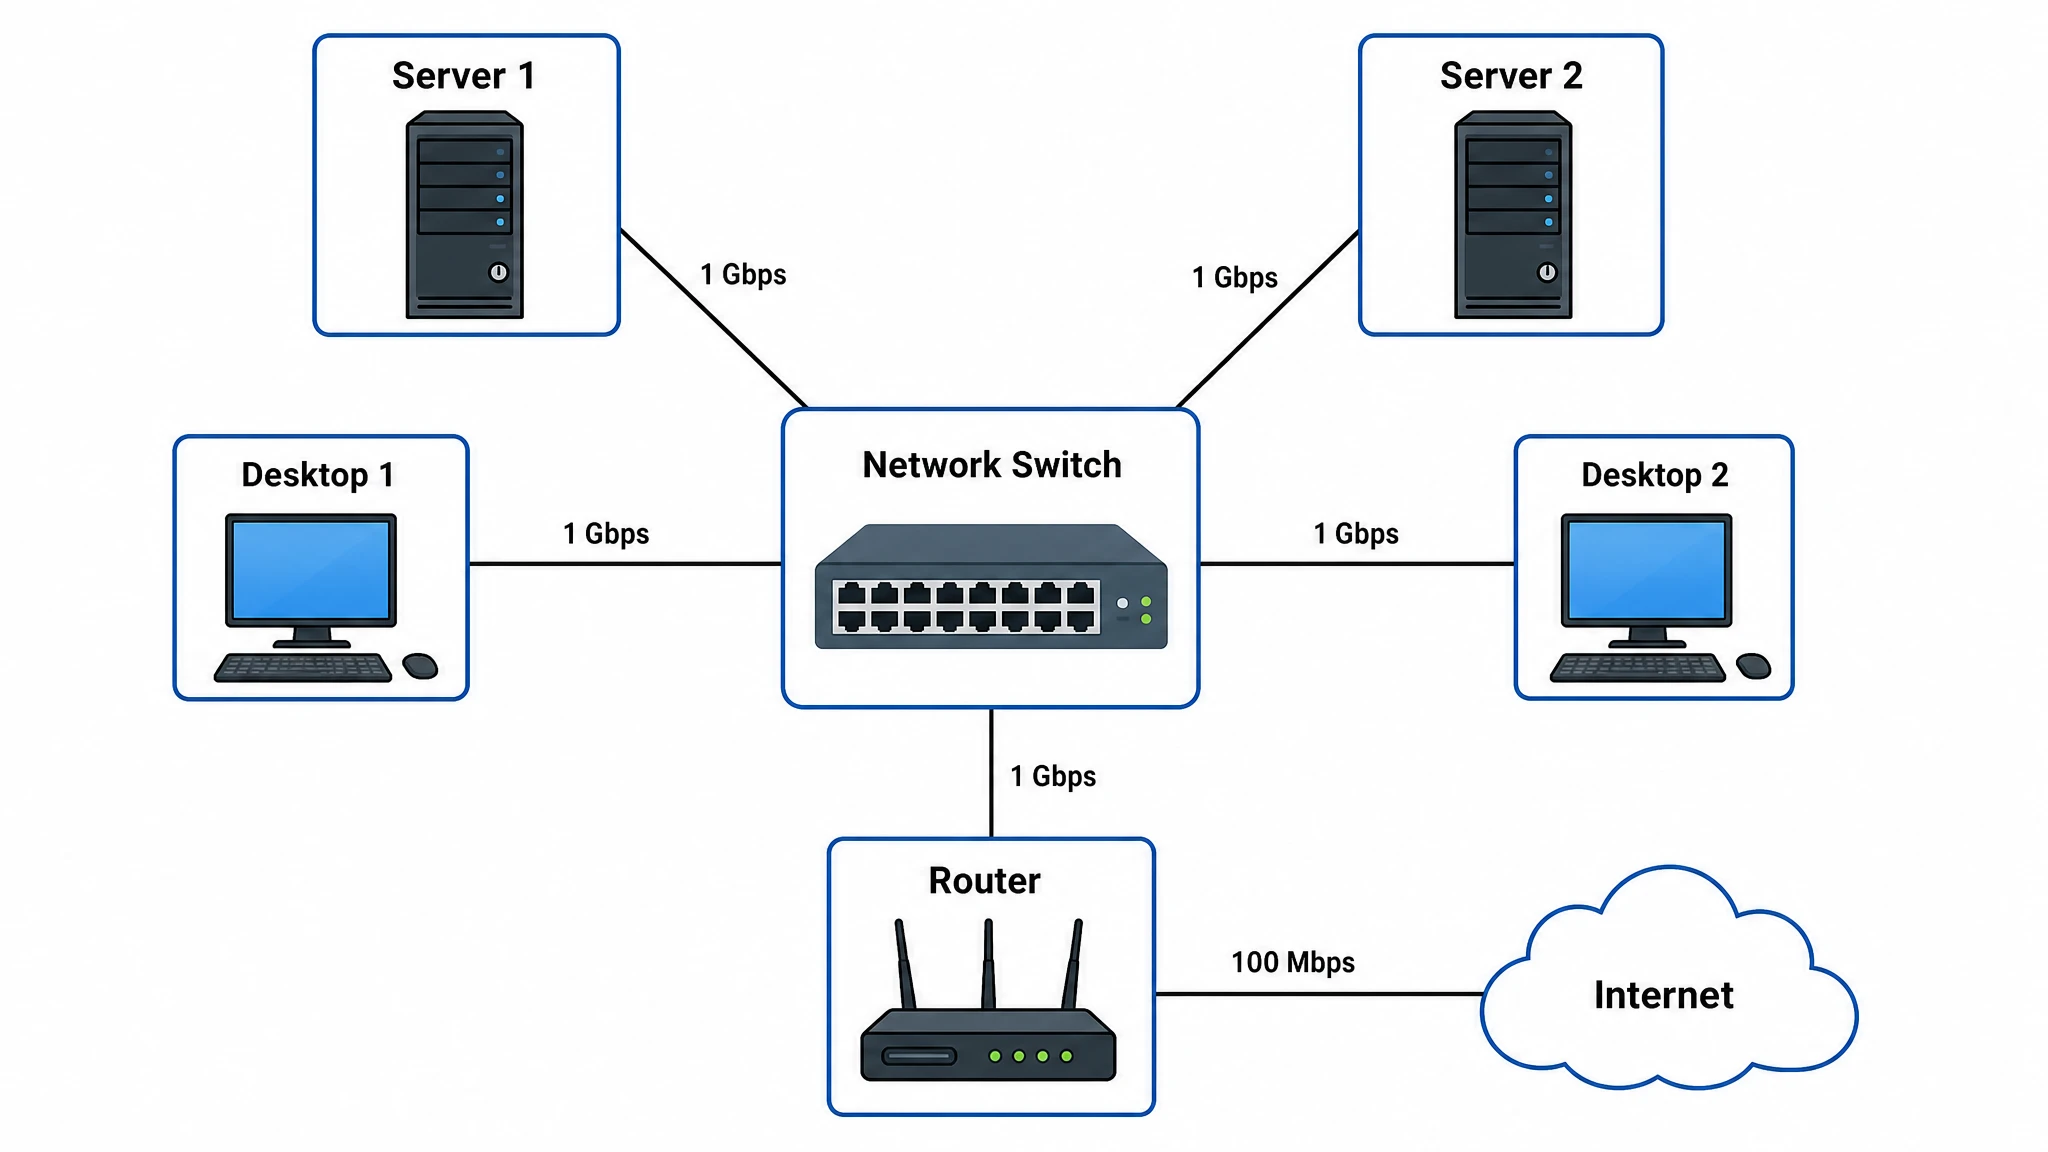 Network Diagram Generator
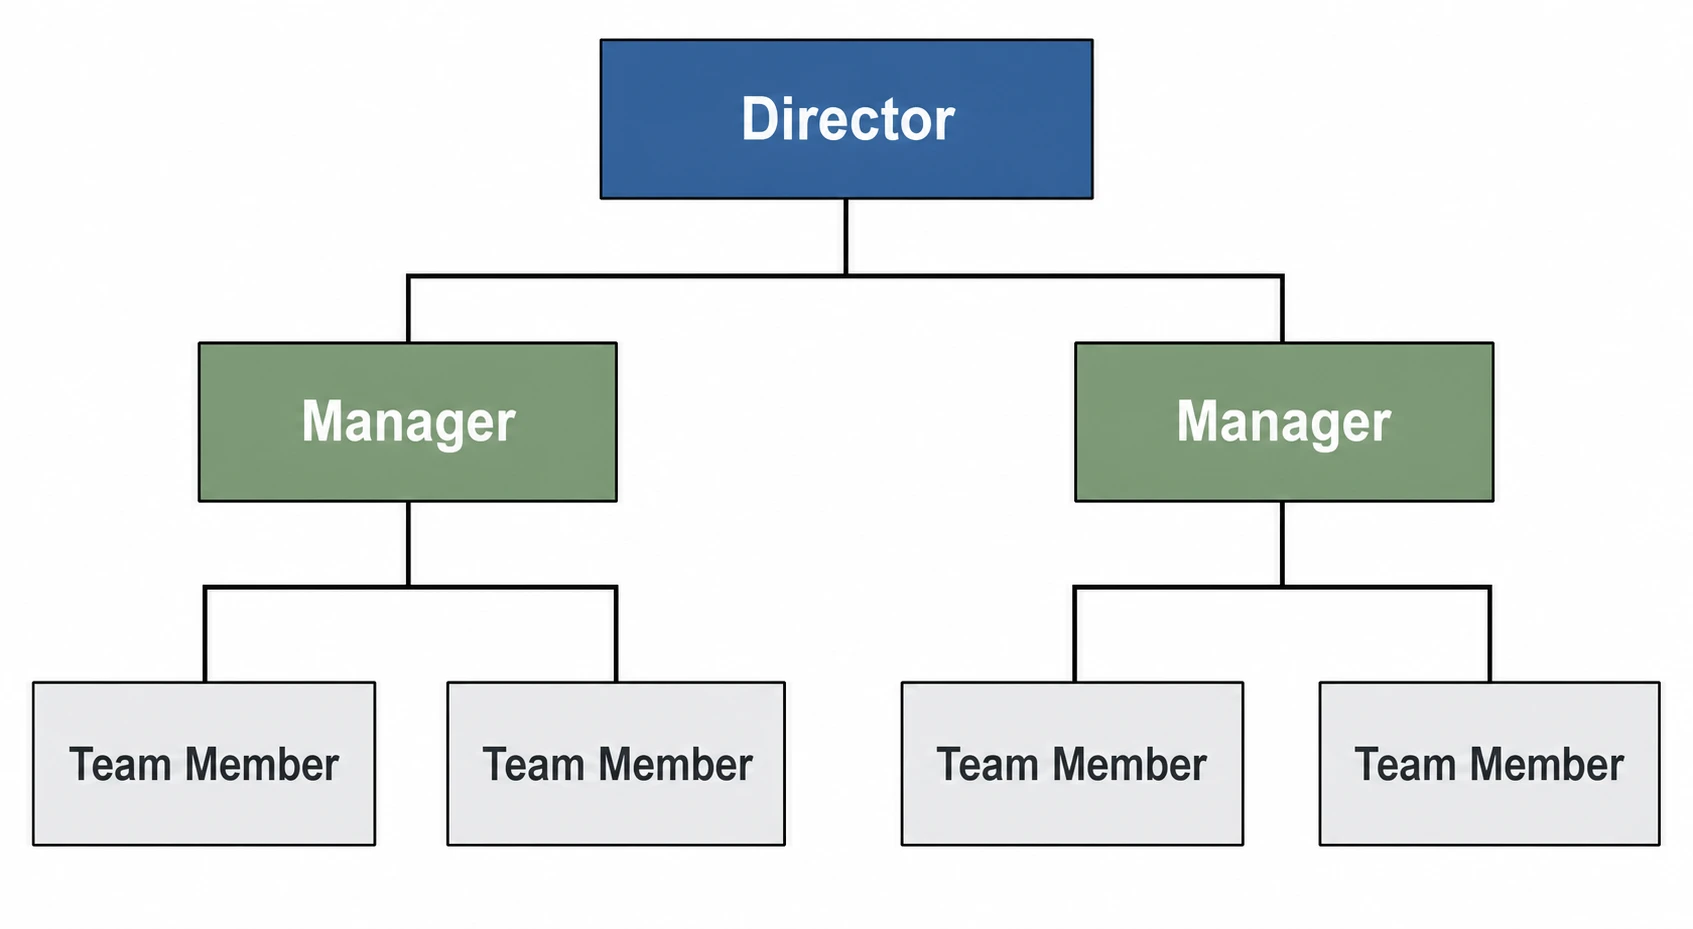 Org Chart Maker
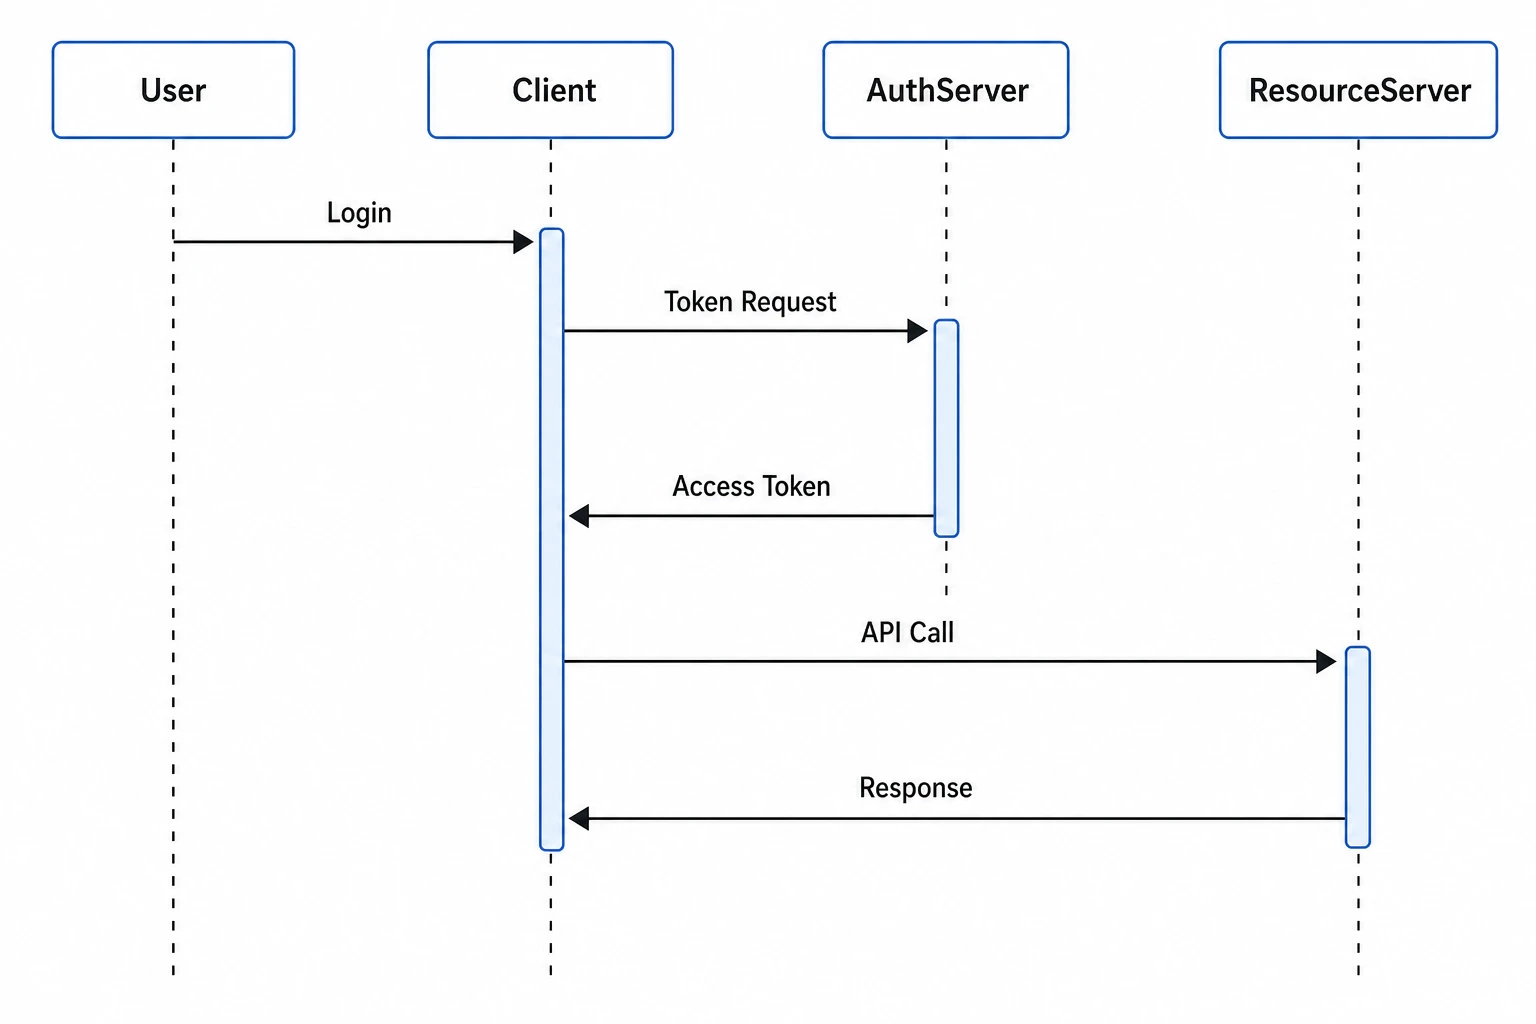 Sequence Diagram Generator
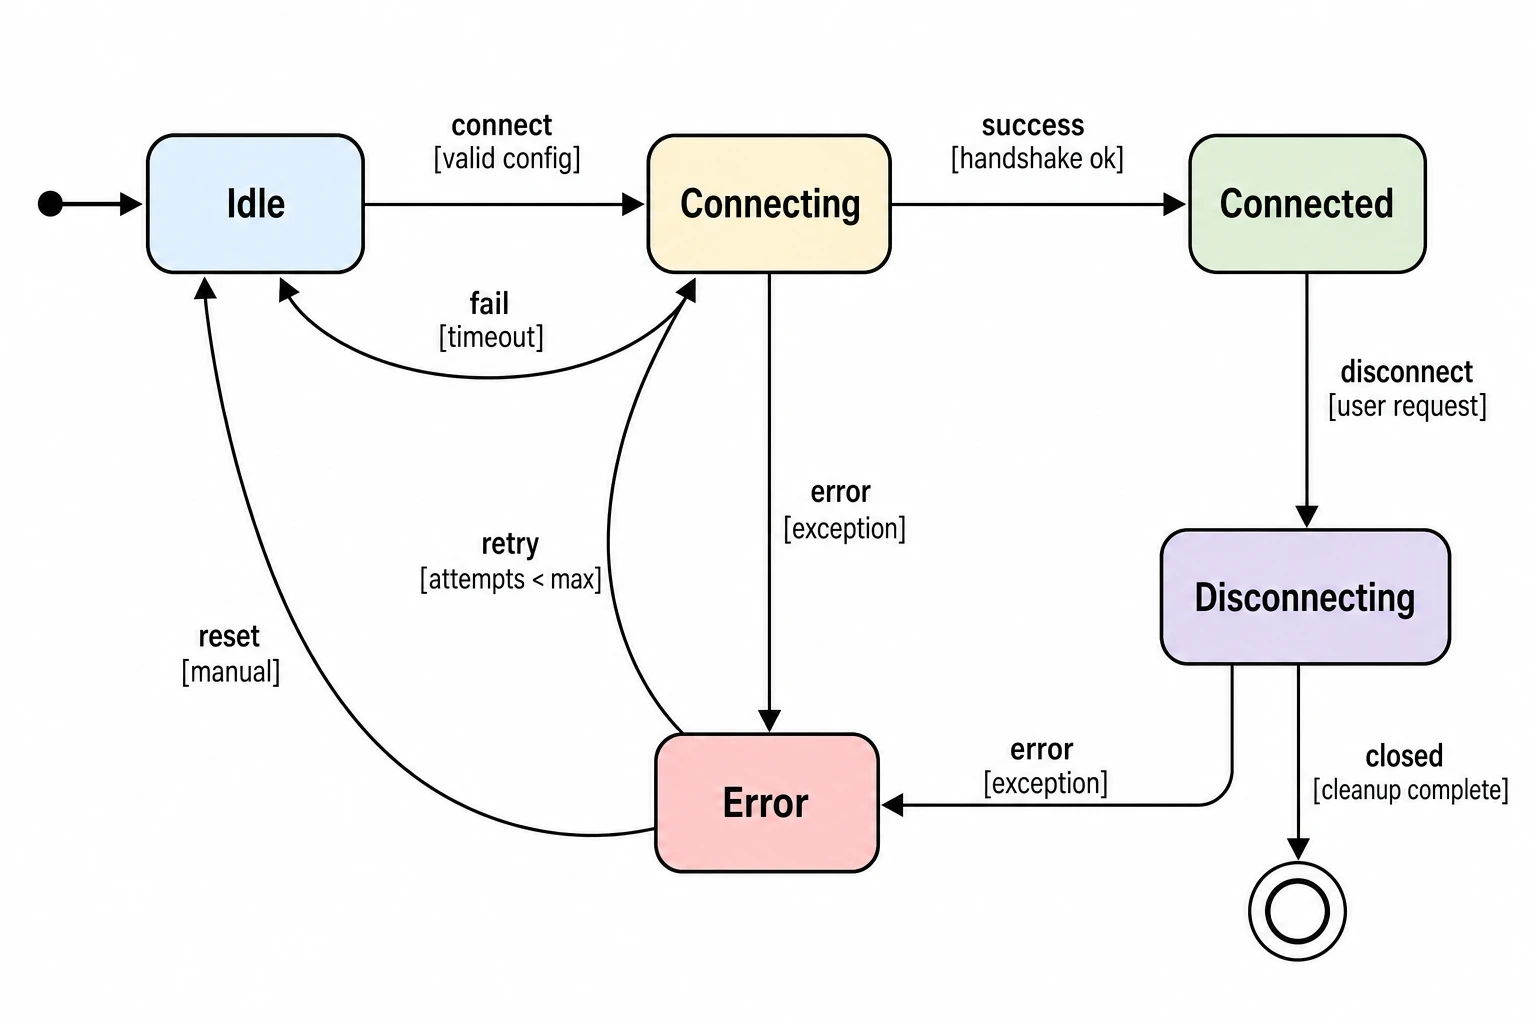 State Diagram Generator
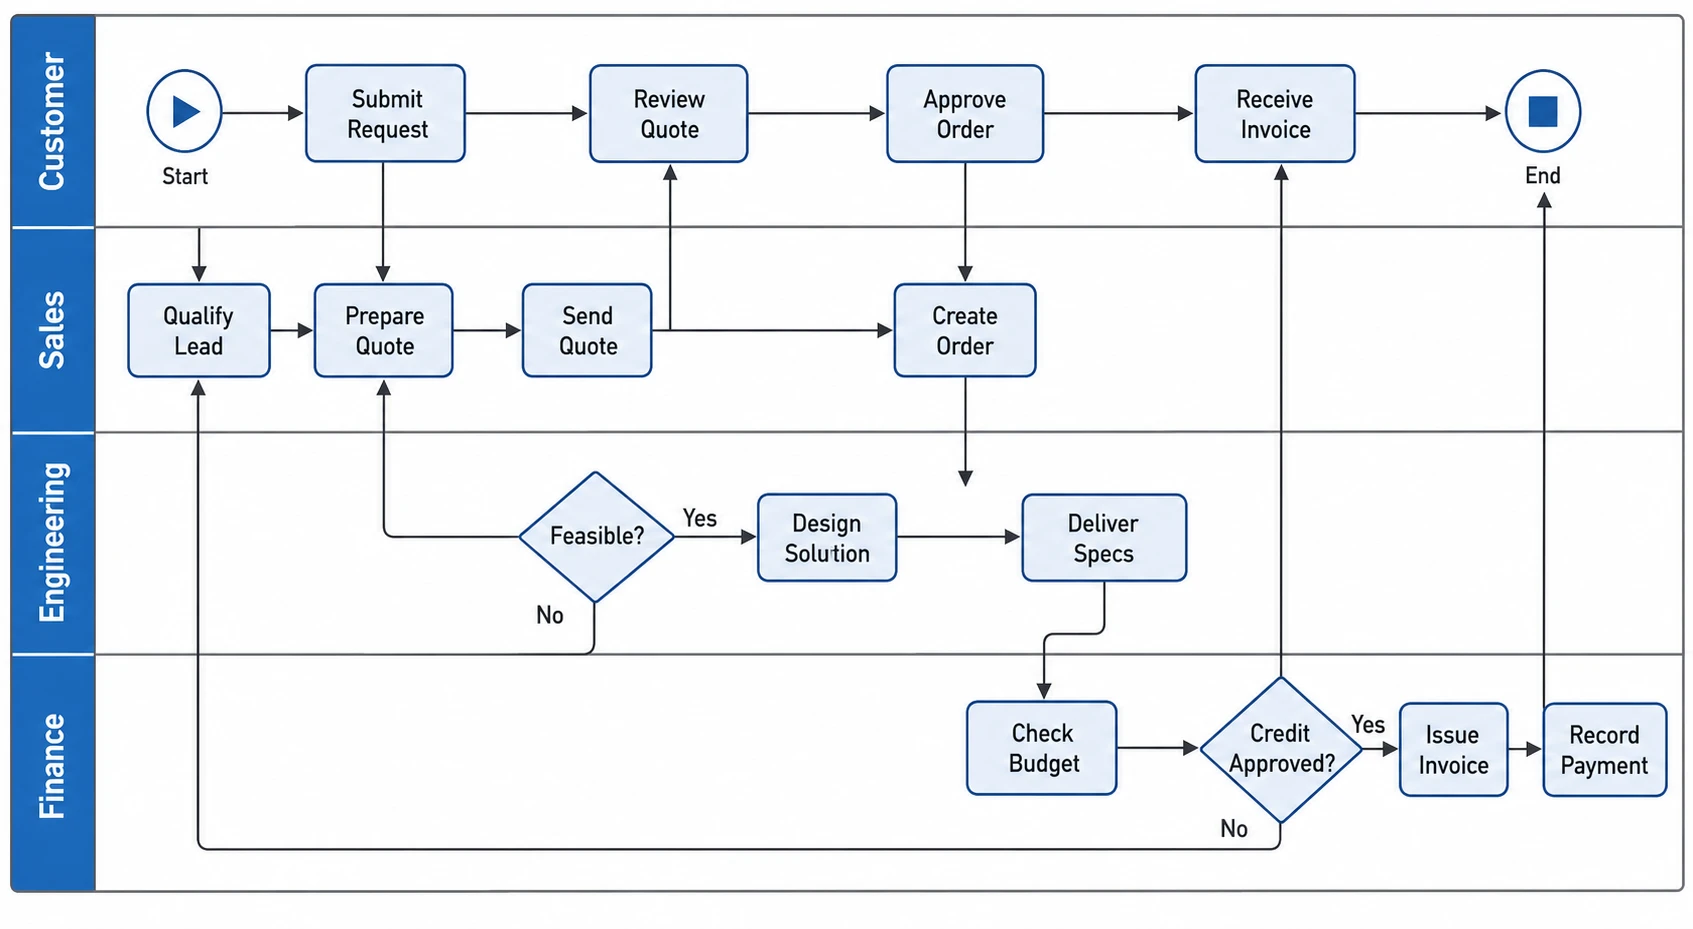 Swimlane Diagram Generator
 Use Case Diagram Generator
 Venn Diagram Generator

Create with SciFig
Free to start · No credit card required · Built for researchers
Printable place value chart
Map each written digit to its decimal place, prepare a blank chart and download a printable page.