Ends Dec 1, PT
SciFig

Free ROC Curve Plotter

An ROC curve plotter shows how well a score separates positive from negative cases across every possible threshold.

Import a data file to continue.

Start with up to 150 free credits|No credit card required

Get up to 250 free credits on day one when you join through an invite.

3 figure engines · 500+ templatesEvery label editable · 60+ color schemesEditable PPTX · Layered SVG · 8K PNG / JPG

Free ROC Curve Plotter— templates & examples

Updated

From outcomes and scores to discrimination

Free ROC Curve Plotter

Show how well a test or model separates positive from negative cases, and compare candidates on the same axes.

Use the ROC curve plotter to evaluate a diagnostic test, biomarker or classification model. Give a true-outcome column and a score column and name the positive class; SciFig DataChart (charts and graphs from your data) traces the true-positive rate against the false-positive rate at each observed threshold, calculates the AUC and draws the chance line. A group column plots several tests or models on one chart, with optional DeLong confidence intervals and a Youden-optimal point.

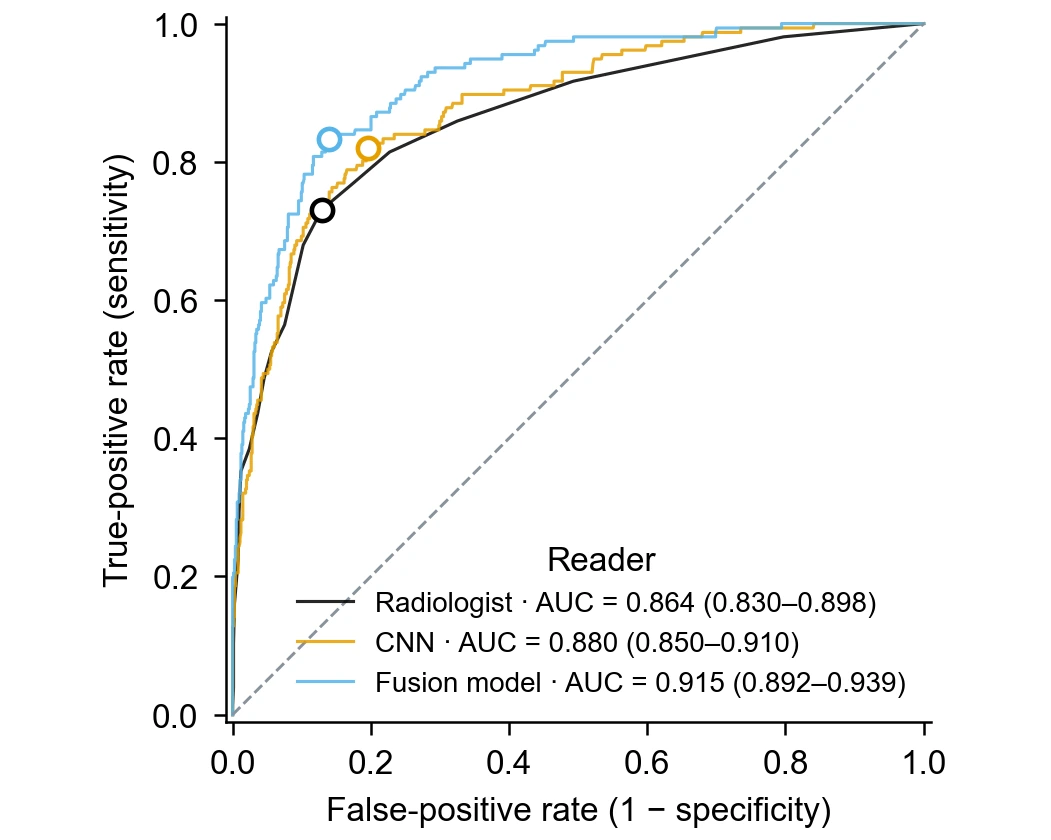
ROC curves for a radiologist, a CNN and a fusion model, each with AUC, DeLong interval and Youden point
  • Plot sensitivity against 1 − specificity
  • Calculate the AUC of every curve
  • Add DeLong 95% intervals and a Youden point
  • Compare tests or models with a group column

ROC Curve Plotter Features

Bring outcome labels and continuous scores into the curve, the AUC and the cutoff information that diagnostic and modelling papers report.

Trace the curve from outcomes and scores

An ROC analysis needs two columns: the true outcome of each case and the score a test or model gave it. The ROC curve plotter sorts cases by score, moves the threshold through every observed value and plots the resulting true-positive rate against the false-positive rate. The dashed diagonal shows what a score with no discriminating ability would produce.

  • Outcome labels as text or numbers, with the positive class named
  • Higher scores ranked as more likely positive
  • Chance line and equally scaled axes from 0 to 1
Trace your ROC curve

Report the AUC with a DeLong confidence interval

The area under the curve summarizes discrimination in one number: 0.5 means no better than chance and 1.0 means perfect separation. The generator calculates the AUC with the trapezoidal rule and writes it in the legend. Turn on confidence intervals to add the DeLong 95% interval beside each AUC, so readers can judge how precisely your sample estimates it.

  • AUC printed in the legend for every curve
  • DeLong 95% interval on request
  • Interval width reflects the positive and negative case counts
Add the AUC interval

Mark the Youden-optimal threshold

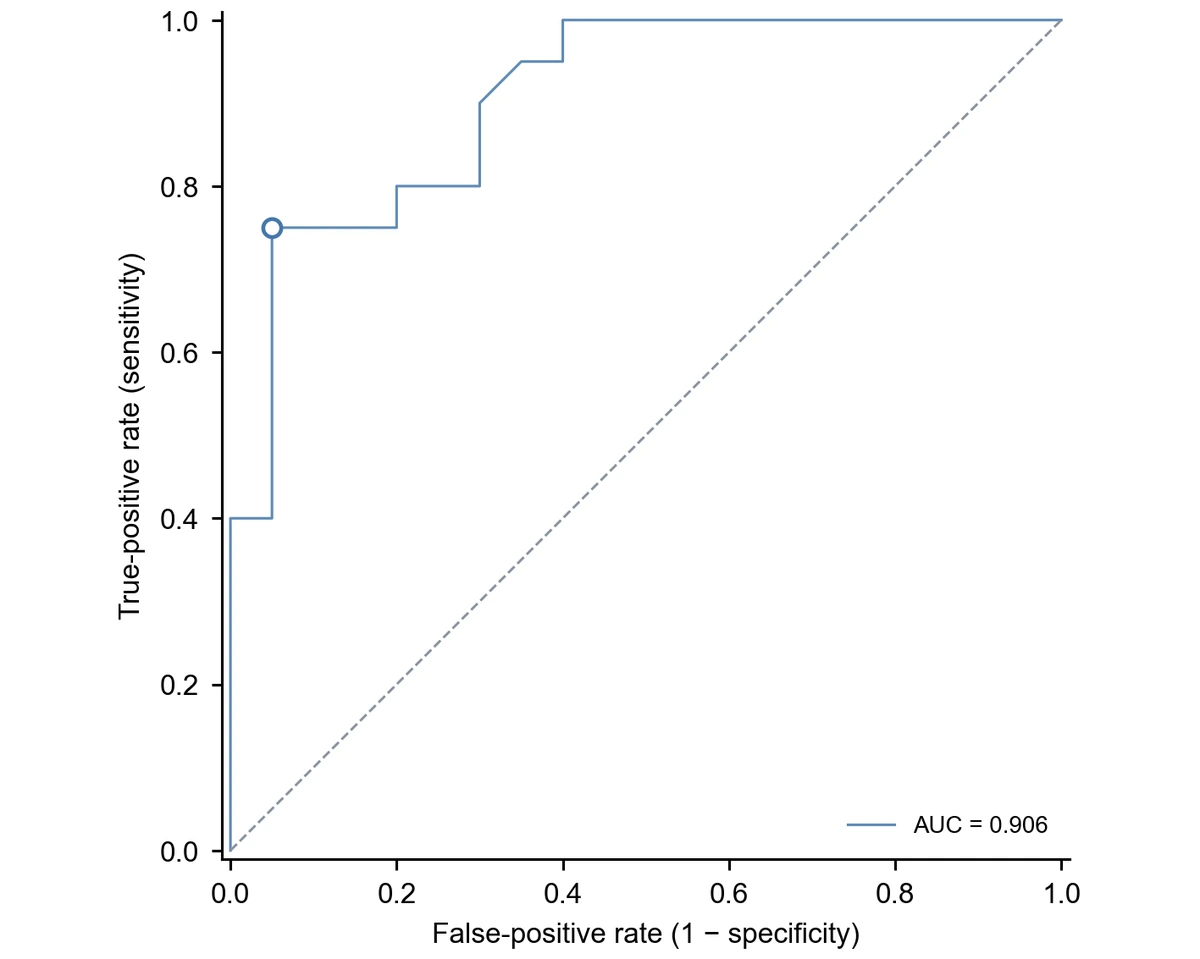
Choosing a cutoff means trading sensitivity against specificity. With the Youden option, the generator finds the observed threshold that maximizes sensitivity plus specificity minus one and marks that point on the curve with an open circle. The threshold value, its true-positive rate and its false-positive rate stay with the chart's statistics for your methods section. For time-to-event data with censoring, use Kaplan–Meier survival curves instead.

  • Youden's J maximized over observed cutoffs
  • Open circle at the chosen point on each curve
  • Threshold value kept with the statistics
Explore Kaplan–Meier survival curves

Compare several tests or models on one chart

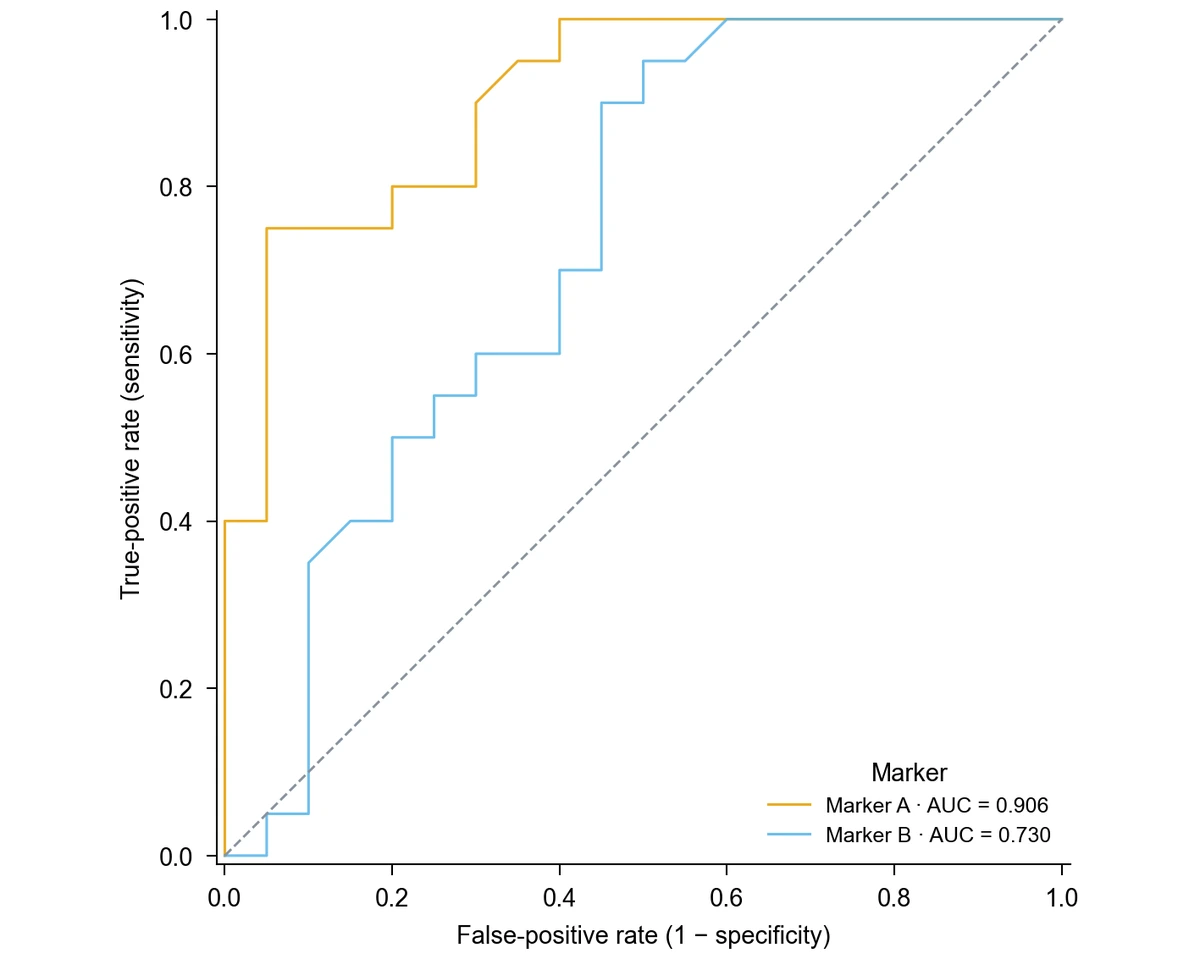
Add a group column, such as the name of each biomarker, reader or model, and the generator draws one curve per group with its own color and its own AUC in the legend. Nothing is pooled across groups, so a reader study or model comparison shows exactly how each candidate performed on its cases. For agreement between paired measurements, use Bland–Altman plots instead.

  • One curve per group with its own AUC
  • Shared axes and chance line for direct comparison
  • Long-format table with one row per case and candidate
Explore Bland–Altman plots

How to Make an ROC Curve

Use SciFig DataChart to plot an ROC curve online from a table of outcomes and scores: choose the ROC chart, name the positive class and generate the curve from every case.

  1. Prepare outcomes and scores

    Upload a CSV or Excel file, or paste a table in SciFig DataChart, with one row per case: a true-outcome column such as disease or healthy, and a numeric score column. For several tests or models, stack them in long format with a column naming each one.

  2. Choose ROC and name the positive class

    Select the ROC curve chart type, map the outcome, score and optional group columns, and state which outcome label counts as positive. Ask for DeLong confidence intervals or the Youden point at this stage, together with your axis titles.

  3. Generate the curve and read the AUC

    Generate the chart. SciFig DataChart computes the true- and false-positive rates at every observed threshold from the full table, calculates each AUC and draws the curves with the chance line. The legend shows each AUC, and the calculated values stay available with the figure.

  4. Refine and export the ROC curve

    Change labels, colors or journal style by request, then export the chart from SciFig DataChart as PNG, PDF, EPS or TIFF. Download the Python code when you want to reproduce the same ROC curve in your own analysis pipeline.

ROC Curve Examples in Diagnostic and Model Research

ROC curves appear wherever a score has to separate two outcomes. Each example shows the data a study brings and what the curve adds to its report.

ROC curves for a radiologist, a CNN and a fusion model, each with AUC, DeLong interval and Youden point

Report a reader study in diagnostic imaging

A screening study that scores the same mammograms by a radiologist, a CNN and a fusion model produces one score per case for each reader. Plotted with a group column, the three ROC curves share axes, each AUC appears with its DeLong interval, and the Youden points show where each reader's best balance of sensitivity and specificity lies.

Explore this example
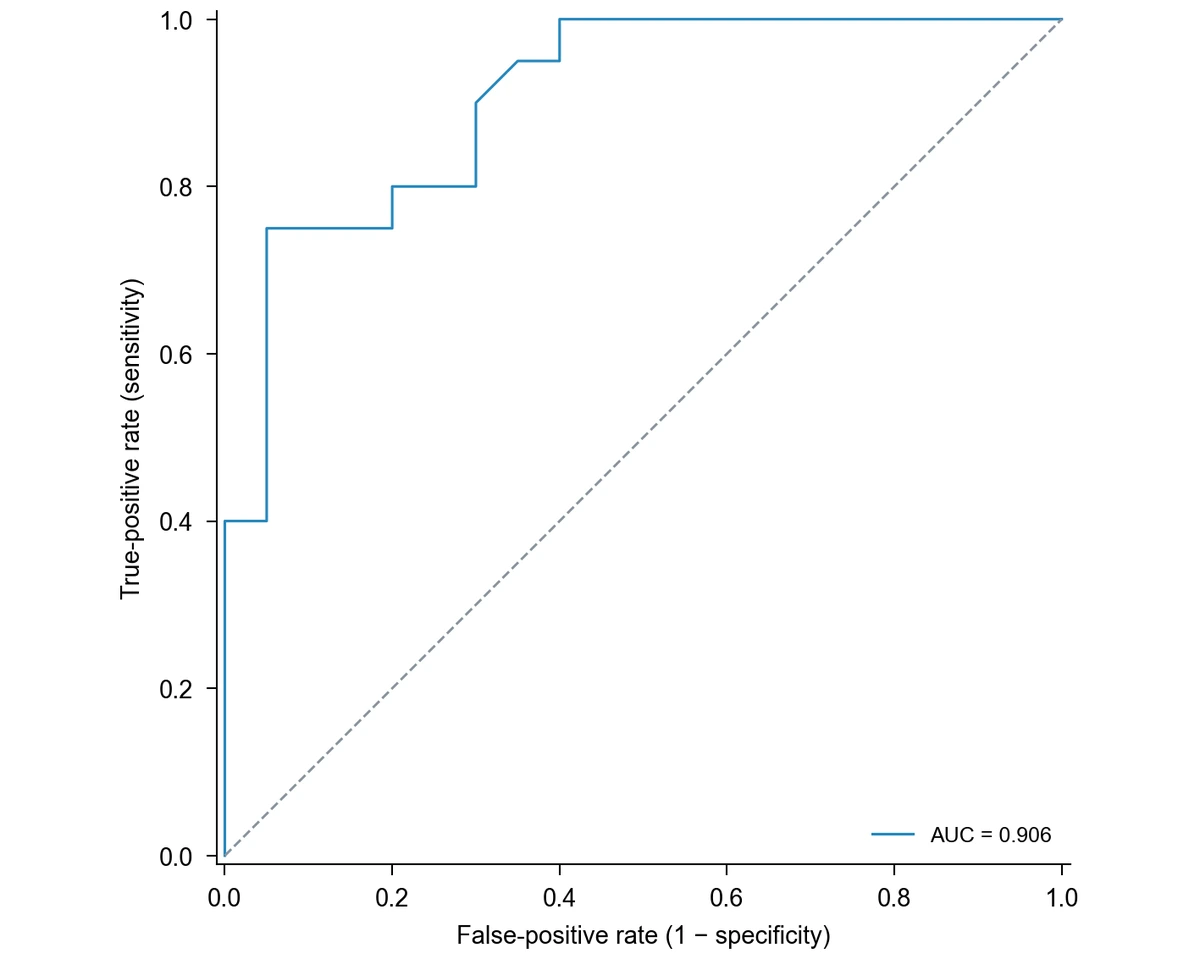
Single ROC curve for Marker A, sensitivity against 1 − specificity, with the diagonal chance line and AUC

Evaluate a candidate biomarker

A biomarker measured in 20 patients with disease and 20 healthy controls can be summarized by a single ROC curve. In the example table, Marker A reaches an AUC of 0.906, which tells a grant report or thesis chapter how well the marker separates the two groups across all cutoffs.

Explore this example
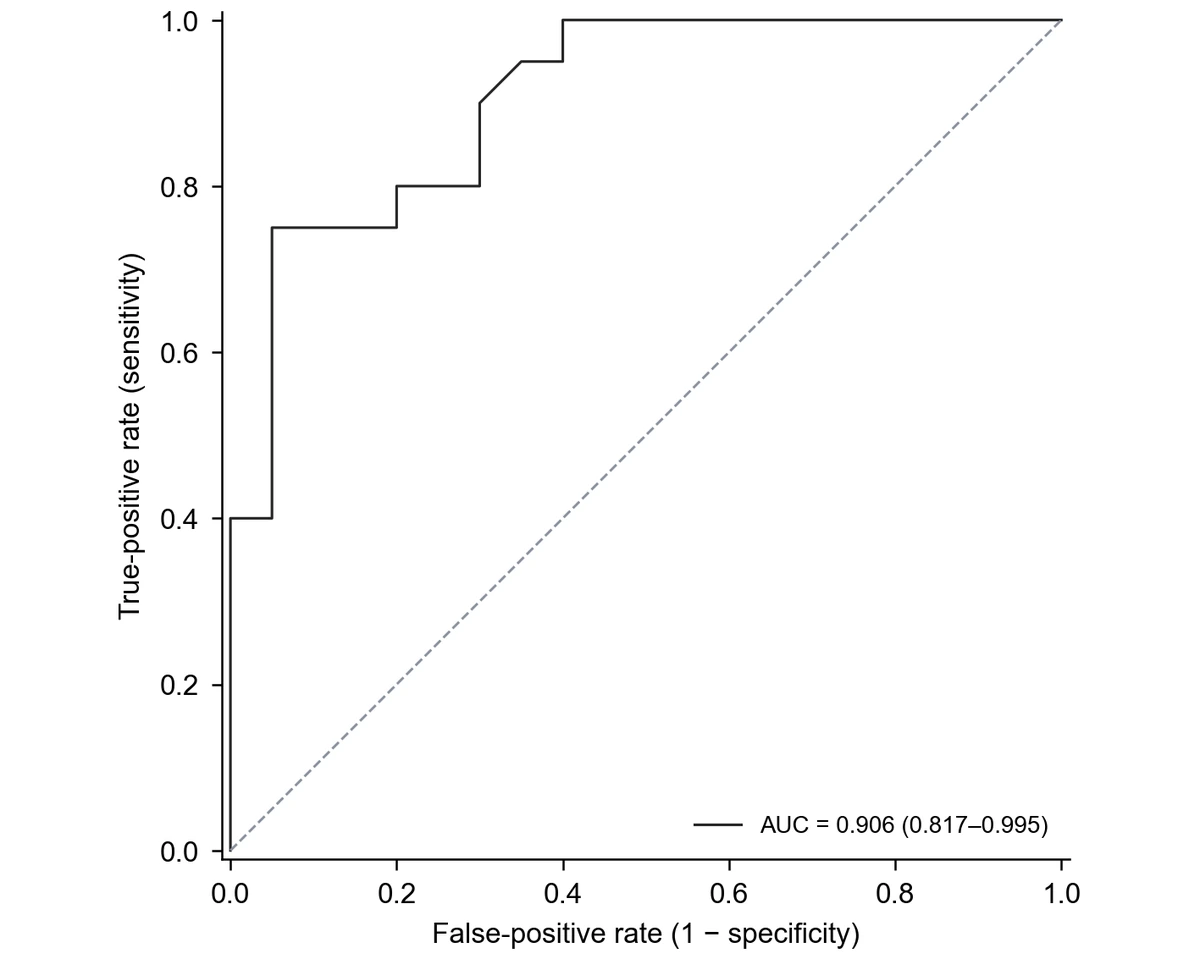
Marker A ROC curve with the AUC and its DeLong 95% confidence interval in the legend

Show the precision of a small validation

With a few dozen cases, an AUC on its own can look more certain than it is. Adding the DeLong 95% confidence interval to the legend lets reviewers see the range of plausible values and judge whether the result supports moving on to a larger validation cohort.

Explore this example
Marker A ROC curve with the Youden-optimal threshold marked by an open circle

Propose a working clinical cutoff

When a laboratory needs a working threshold, the Youden point marks the observed cutoff with the highest sensitivity plus specificity. In the Marker A example it sits at a level of 4.81, with a sensitivity of 0.75 and a false-positive rate of 0.05, a starting point for a discussion that also weighs the cost of missed cases.

Explore this example
Two ROC curves comparing Marker A and Marker B on shared axes, each with its own AUC

Choose between two candidate markers

Plotting Marker A and Marker B from the same patients on one chart makes the comparison concrete: in the example, Marker A reaches an AUC of 0.906 and Marker B 0.730. The figure supports the decision about which marker to carry forward, next to the formal comparison in the results.

Explore this example
Single ROC curve for Marker A, sensitivity against 1 − specificity, with the diagonal chance line and AUC

Pair discrimination with agreement in method validation

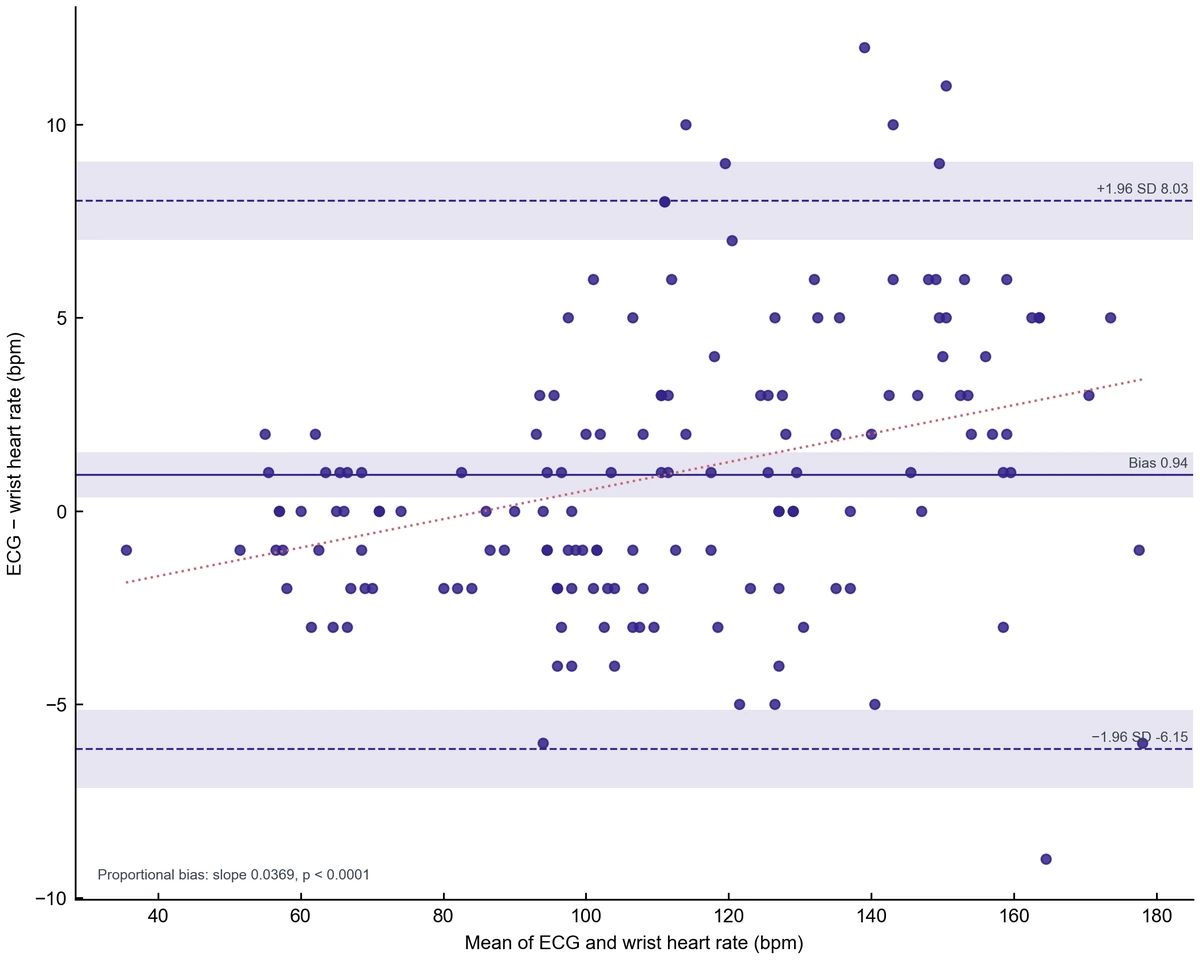
Validation reports for a new assay often ask two questions: does it classify patients correctly, and does it agree with the reference method? The ROC curve answers the first. For the second, compare the paired measurements with the Bland-Altman plot generator and report both figures together.

Explore this example
ROC Curve Plotter · Research scenarios

Our reader study compared three radiologists with an AI model on the same mammograms. I stacked the scores in one table and used the ROC curve plotter with a reader column, so every curve carried its own AUC and DeLong interval in the legend. The figure went into the manuscript with only the axis titles changed.

Elena Rossi

Radiology research fellow, University of Milan

Free tools

A tool for every scientific figure

156 focused generators for the scientific figure you need — each opens in the right workspace with a matching example.

Illustrations, structures and concept diagrams

87 tools
Chemistry Structure Generator example figureChemistry Structure GeneratorGraphical Abstract Maker example figureGraphical Abstract MakerFree Body Diagram Generator example figureFree Body Diagram GeneratorCircuit Diagram Maker example figureCircuit Diagram MakerAI Scientific Image Generator example figureAI Scientific Image GeneratorEditable 96-Well Plate example figureEditable 96-Well PlateLewis Dot Structure Generator example figureLewis Dot Structure GeneratorDNA Structure Diagram Generator example figureDNA Structure Diagram GeneratorWiring Diagram Maker example figureWiring Diagram MakerP&ID Diagram Generator example figureP&ID Diagram GeneratorScientific Poster Generator example figureScientific Poster GeneratorCladogram Maker example figureCladogram MakerFood Web Maker example figureFood Web MakerMedical Illustration Generator example figureMedical Illustration GeneratorPCR Diagram Generator example figurePCR Diagram GeneratorPPT Text to Visual Converter example figurePPT Text to Visual ConverterMitosis Diagram Generator example figureMitosis Diagram GeneratorDog Lymph Nodes Diagram example figureDog Lymph Nodes DiagramCSF Circulation Diagram example figureCSF Circulation DiagramEditable 24-Well Plate example figureEditable 24-Well PlateEditable 384-Well Plate example figureEditable 384-Well PlateEditable 48-Well Plate example figureEditable 48-Well PlateEditable 6-Well Plate example figureEditable 6-Well PlateAI Infographic Generator example figureAI Infographic GeneratorAnatomical Drawing Generator example figureAnatomical Drawing GeneratorAnimal and Plant Cell Comparison example figureAnimal and Plant Cell ComparisonAnimal Cell Diagram Generator example figureAnimal Cell Diagram GeneratorAntibody Structure Diagram Generator example figureAntibody Structure Diagram GeneratorApoptosis Diagram Generator example figureApoptosis Diagram GeneratorAutophagy Diagram Generator example figureAutophagy Diagram GeneratorBacteria Diagram Generator example figureBacteria Diagram GeneratorBlueprint Maker example figureBlueprint MakerBohr Model Maker example figureBohr Model MakerBrain Anatomy Diagram example figureBrain Anatomy DiagramCalvin Cycle Diagram Generator example figureCalvin Cycle Diagram GeneratorCarbon Cycle Diagram Generator example figureCarbon Cycle Diagram GeneratorCell Cycle Diagram Generator example figureCell Cycle Diagram GeneratorCell Membrane Diagram example figureCell Membrane DiagramCellular Respiration Diagram Generator example figureCellular Respiration Diagram GeneratorComplement System Diagram Generator example figureComplement System Diagram GeneratorCRISPR-Cas9 Diagram Generator example figureCRISPR-Cas9 Diagram GeneratorDNA Replication Diagram Generator example figureDNA Replication Diagram GeneratorEar Anatomy Diagram example figureEar Anatomy DiagramElectron Configuration Diagram Generator example figureElectron Configuration Diagram GeneratorElectron Transport Chain Diagram Generator example figureElectron Transport Chain Diagram GeneratorELISA Diagram Generator example figureELISA Diagram GeneratorEye Anatomy Diagram example figureEye Anatomy DiagramFoot Anatomy Diagram example figureFoot Anatomy DiagramGel Electrophoresis Diagram Generator example figureGel Electrophoresis Diagram GeneratorGene Regulation Diagram Generator example figureGene Regulation Diagram GeneratorGlycolysis Diagram Generator example figureGlycolysis Diagram GeneratorHeart Diagram example figureHeart DiagramImage to Editable SVG Converter example figureImage to Editable SVG ConverterImmune Checkpoint Diagram Generator example figureImmune Checkpoint Diagram GeneratorImmune Response Diagram Generator example figureImmune Response Diagram GeneratorInflammasome Diagram Generator example figureInflammasome Diagram GeneratorKrebs Cycle Diagram Generator example figureKrebs Cycle Diagram GeneratorLab Diagram Maker example figureLab Diagram MakerMeiosis Diagram Generator example figureMeiosis Diagram GeneratorMetabolic Pathway Diagram Generator example figureMetabolic Pathway Diagram GeneratorMicroscope Diagram example figureMicroscope DiagramMolecular Orbital Diagram Generator example figureMolecular Orbital Diagram GeneratorNitrogen Cycle Diagram Generator example figureNitrogen Cycle Diagram GeneratorPedigree Chart Maker example figurePedigree Chart MakerPhospholipid Diagram Generator example figurePhospholipid Diagram GeneratorPhosphorus Cycle Diagram Generator example figurePhosphorus Cycle Diagram GeneratorPhotosynthesis Diagram Generator example figurePhotosynthesis Diagram GeneratorPhylogenetic Tree Maker example figurePhylogenetic Tree MakerPhysics Vector Diagram Maker example figurePhysics Vector Diagram MakerPlant Cell Diagram Generator example figurePlant Cell Diagram GeneratorPlasmid Map Maker example figurePlasmid Map MakerProtein Synthesis Diagram Generator example figureProtein Synthesis Diagram GeneratorPunnett Square Maker example figurePunnett Square MakerRay Diagram Maker example figureRay Diagram MakerRNA Structure Diagram Generator example figureRNA Structure Diagram GeneratorScientific Color Palette Generator example figureScientific Color Palette GeneratorSignaling Pathway Diagram Generator example figureSignaling Pathway Diagram GeneratorSingle Line Diagram Generator example figureSingle Line Diagram GeneratorT-Cell Activation Diagram Generator example figureT-Cell Activation Diagram GeneratorWater Cycle Diagram Generator example figureWater Cycle Diagram GeneratorWestern Blot Diagram Generator example figureWestern Blot Diagram GeneratorFungal Cell Diagram example figureFungal Cell DiagramGibson Assembly Diagram example figureGibson Assembly DiagramHigh-Pressure Homogenizer Diagram example figureHigh-Pressure Homogenizer DiagramNeuron Diagram example figureNeuron DiagramSpinning Disk Confocal Optical Diagram example figureSpinning Disk Confocal Optical DiagramSwan-Neck Flask Experiment example figureSwan-Neck Flask Experiment
ROC Curve Plotter · Questions

1.

2.

3.

4.

5.

6.

Call to action background

roc curve plotter

ROC Curve Plotter · Create and export

Plot your ROC curve

Free to start · No credit card required · Built for researchers