Draw publication-ready TREM2-microglia diagrams for AAIC 2026: homeostatic to DAM continuum, DAP12-SYK signaling, R47H loss-of-function, cytokine cascade.
SciFig Team
Scientific Illustration Experts
You are drawing the TREM2 signaling cascade for an AAIC poster. GPT image puts the ligand binding pocket on the cytoplasmic side. You re-roll. The next version puts the DAP12 adapter on the extracellular face. You re-roll again. Now the figure shows TREM2 R47H with bigger downstream arrows than wild-type — drawn as a gain-of-function variant. Any neuroimmunologist who has read the 2013 NEJM papers by Guerreiro et al. (Accessed 2026-05-22) and Jonsson et al. (Accessed 2026-05-22) will spot it in five seconds: R47H is loss of function, not gain. The three-fold AD risk comes from microglia that cannot clear amyloid — not from microglia doing more. The figure's premise collapses on that one inverted arrow.
This is the moment that derails most neuroinflammation and microglia posters at AAIC. Microglia biology, the TREM2 risk variant axis, and the cytokine cascade behind chronic neuroinflammation are the third research pillar of Alzheimer's disease (alongside amyloid and tau) — and the figures depicting them are unforgiving. One inverted ITAM phosphorylation, one mislabeled DAM marker, one R47H drawn as gain-of-function, and a senior reviewer dismisses the panel before reading your conclusions. This guide walks through microglia anatomy from the homeostatic ramified state through the disease-associated microglia (DAM) transition, the TREM2-DAP12-SYK signaling cascade, the loss-of-function biology of risk variants, microglia-plaque interaction, the cytokine cascade and complement-driven synapse loss, disease comparisons across Alzheimer's / Parkinson's / FTD, and the AI-assisted workflow that gets the neuroimmunology right on draft one.
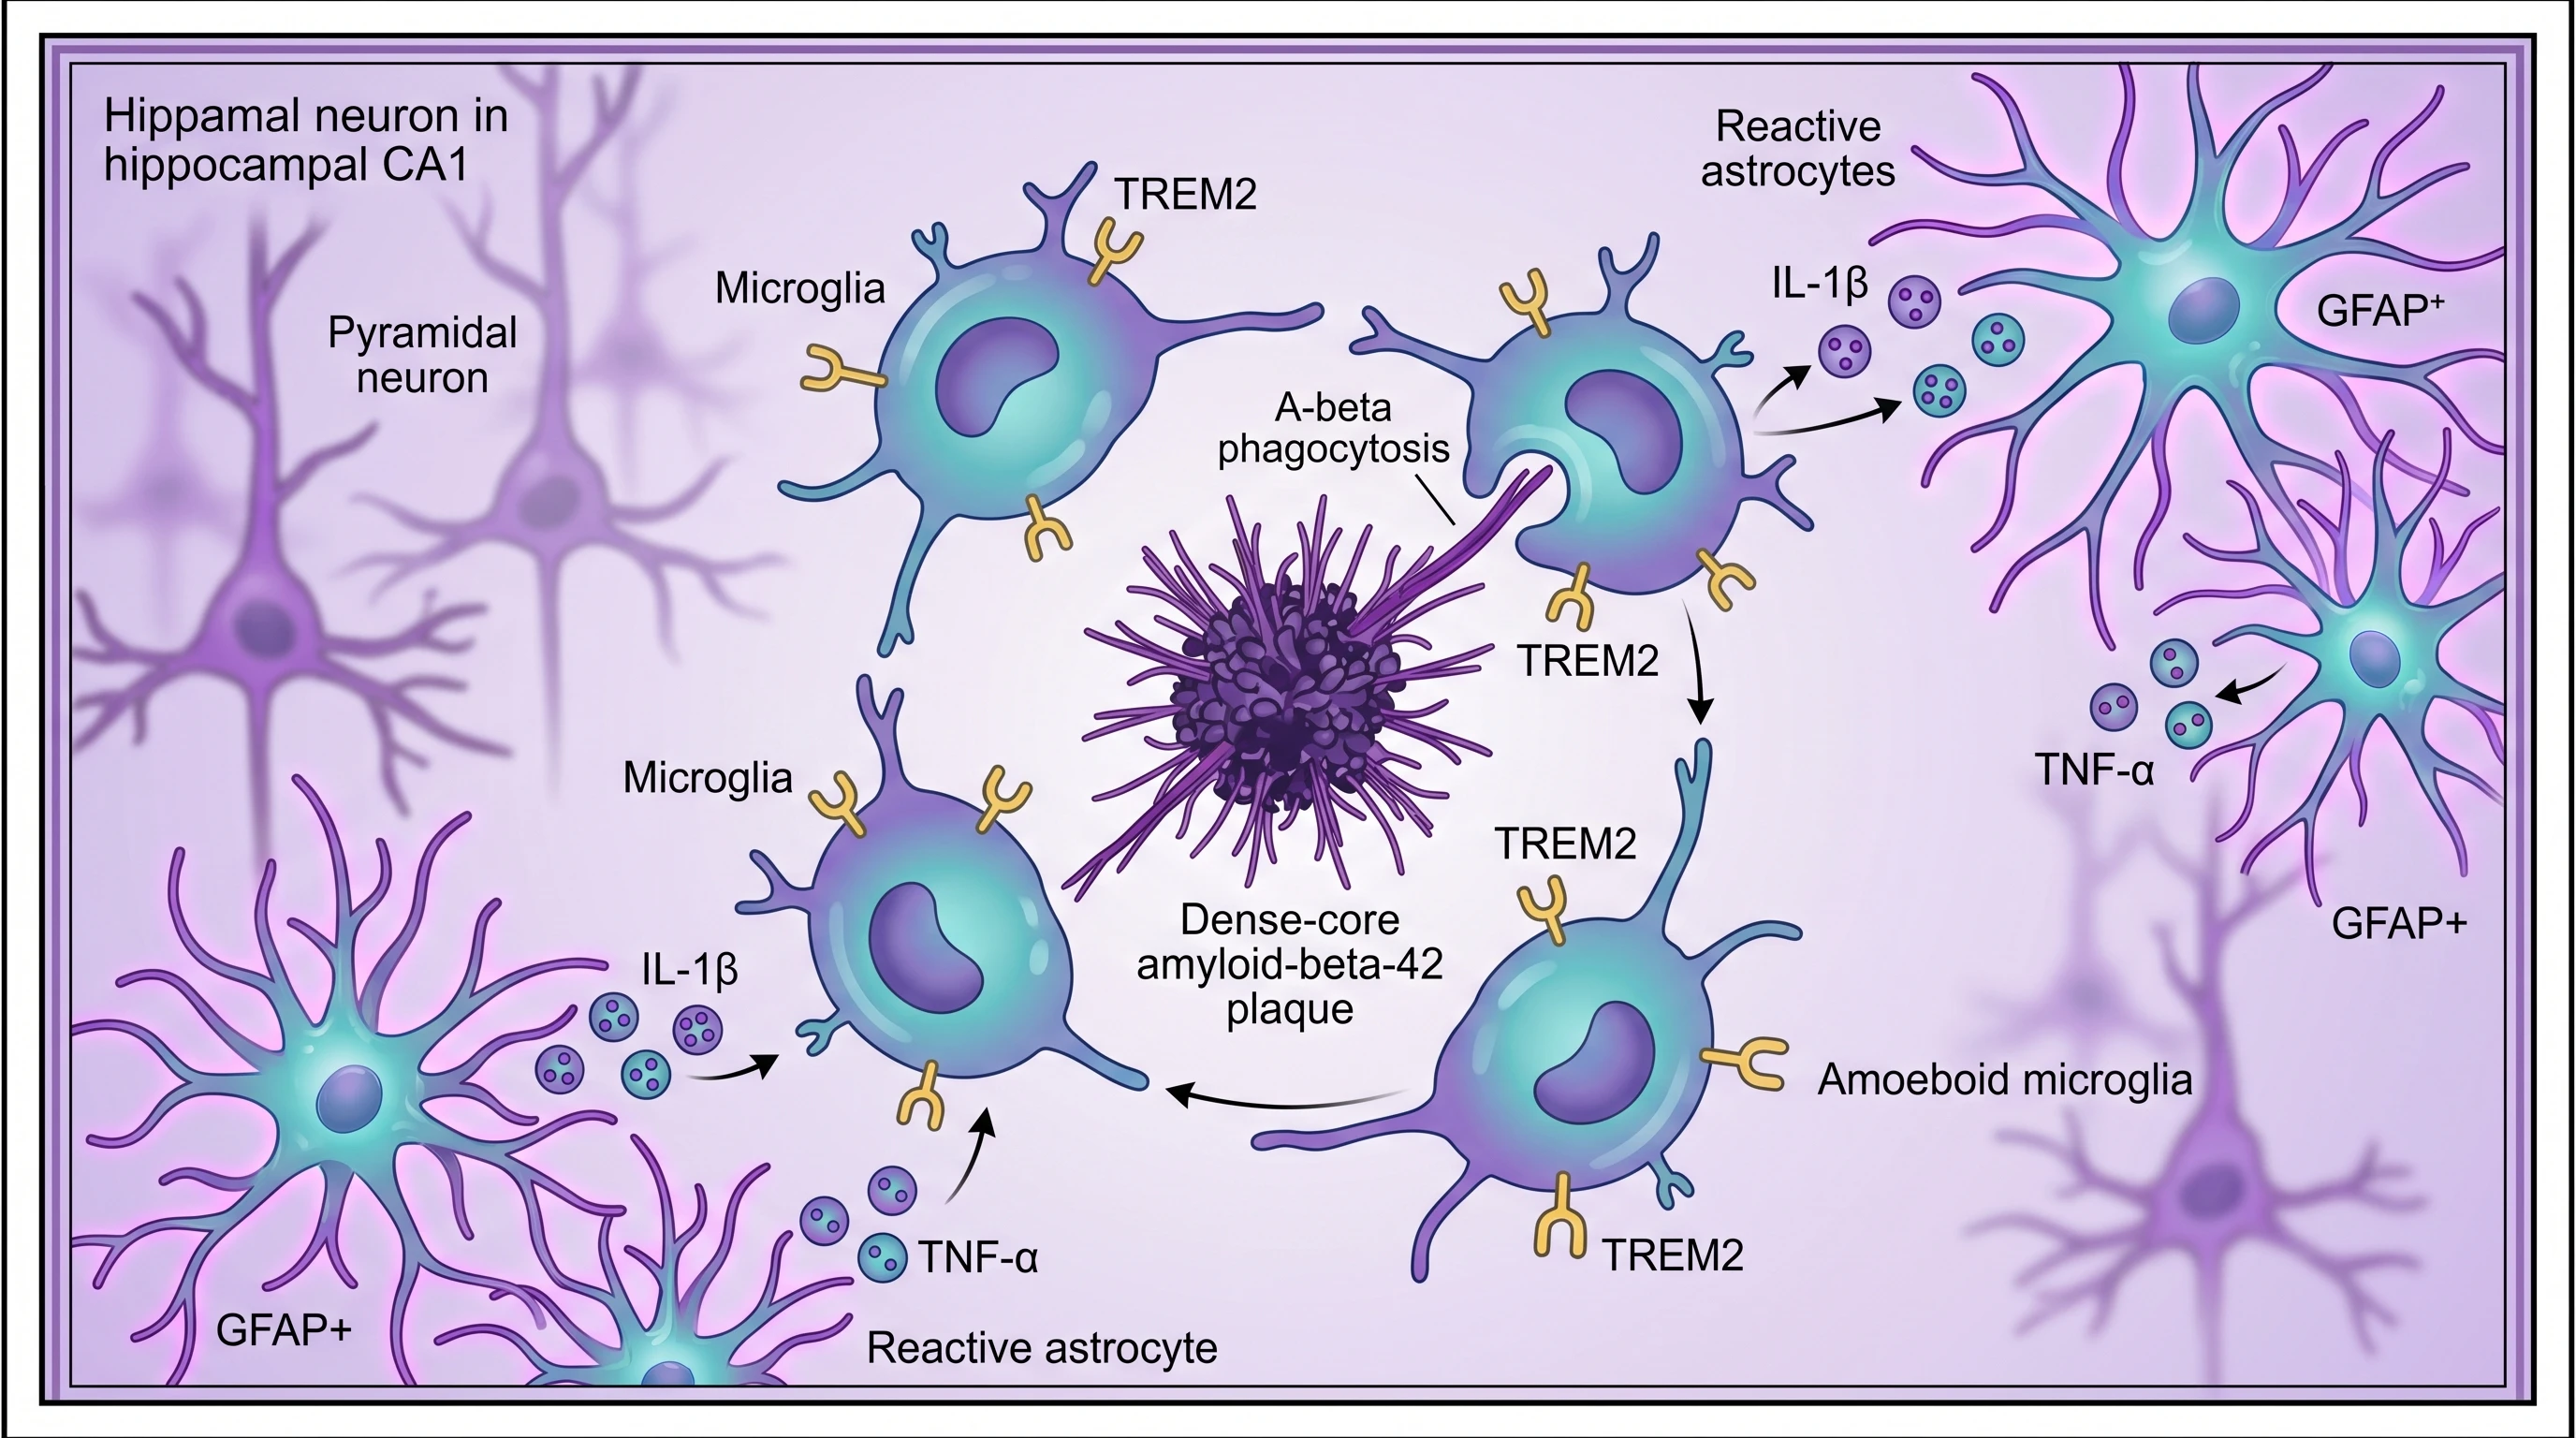
Activated microglia in amoeboid morphology engulfing amyloid-beta plaque with TREM2 receptor, reactive astrocytes, and IL-1β/TNF-α cytokine release (Figure generated with SciFig)
Transparency note: Illustrations in this article were generated with SciFig AI and reviewed by the author for scientific accuracy. Cited claims link to peer-reviewed sources, NIH educational materials, and the AAIC ISTAART neuroimmunology professional interest area.
1. Why TREM2 and Microglia Diagrams Anchor Modern Alzheimer's Research
Walk through any AAIC poster session from the last three meetings and you will see TREM2, microglia activation states, or the broader neuroinflammation cascade in the introduction panel of nearly every basic-science, biomarker, and target-validation poster outside the pure amyloid and tau corridors. The field has moved from a two-pillar model of Alzheimer's pathogenesis (amyloid + tau) to a three-pillar model in which neuroinflammation is treated as a coequal driver, not a downstream consequence. Posters that introduce the disease without a microglia figure now feel out of date.
For an AAIC 2026 poster — whether your study targets TREM2 agonist antibodies, microglia transcriptional state in human brain, the inflammasome axis, or microglia-astrocyte crosstalk — you need a figure that locates your intervention in the canonical neuroimmunology framework. This guide builds that framework one canonical figure at a time.
2. Microglia Anatomy from Homeostatic to Disease-Associated (DAM)
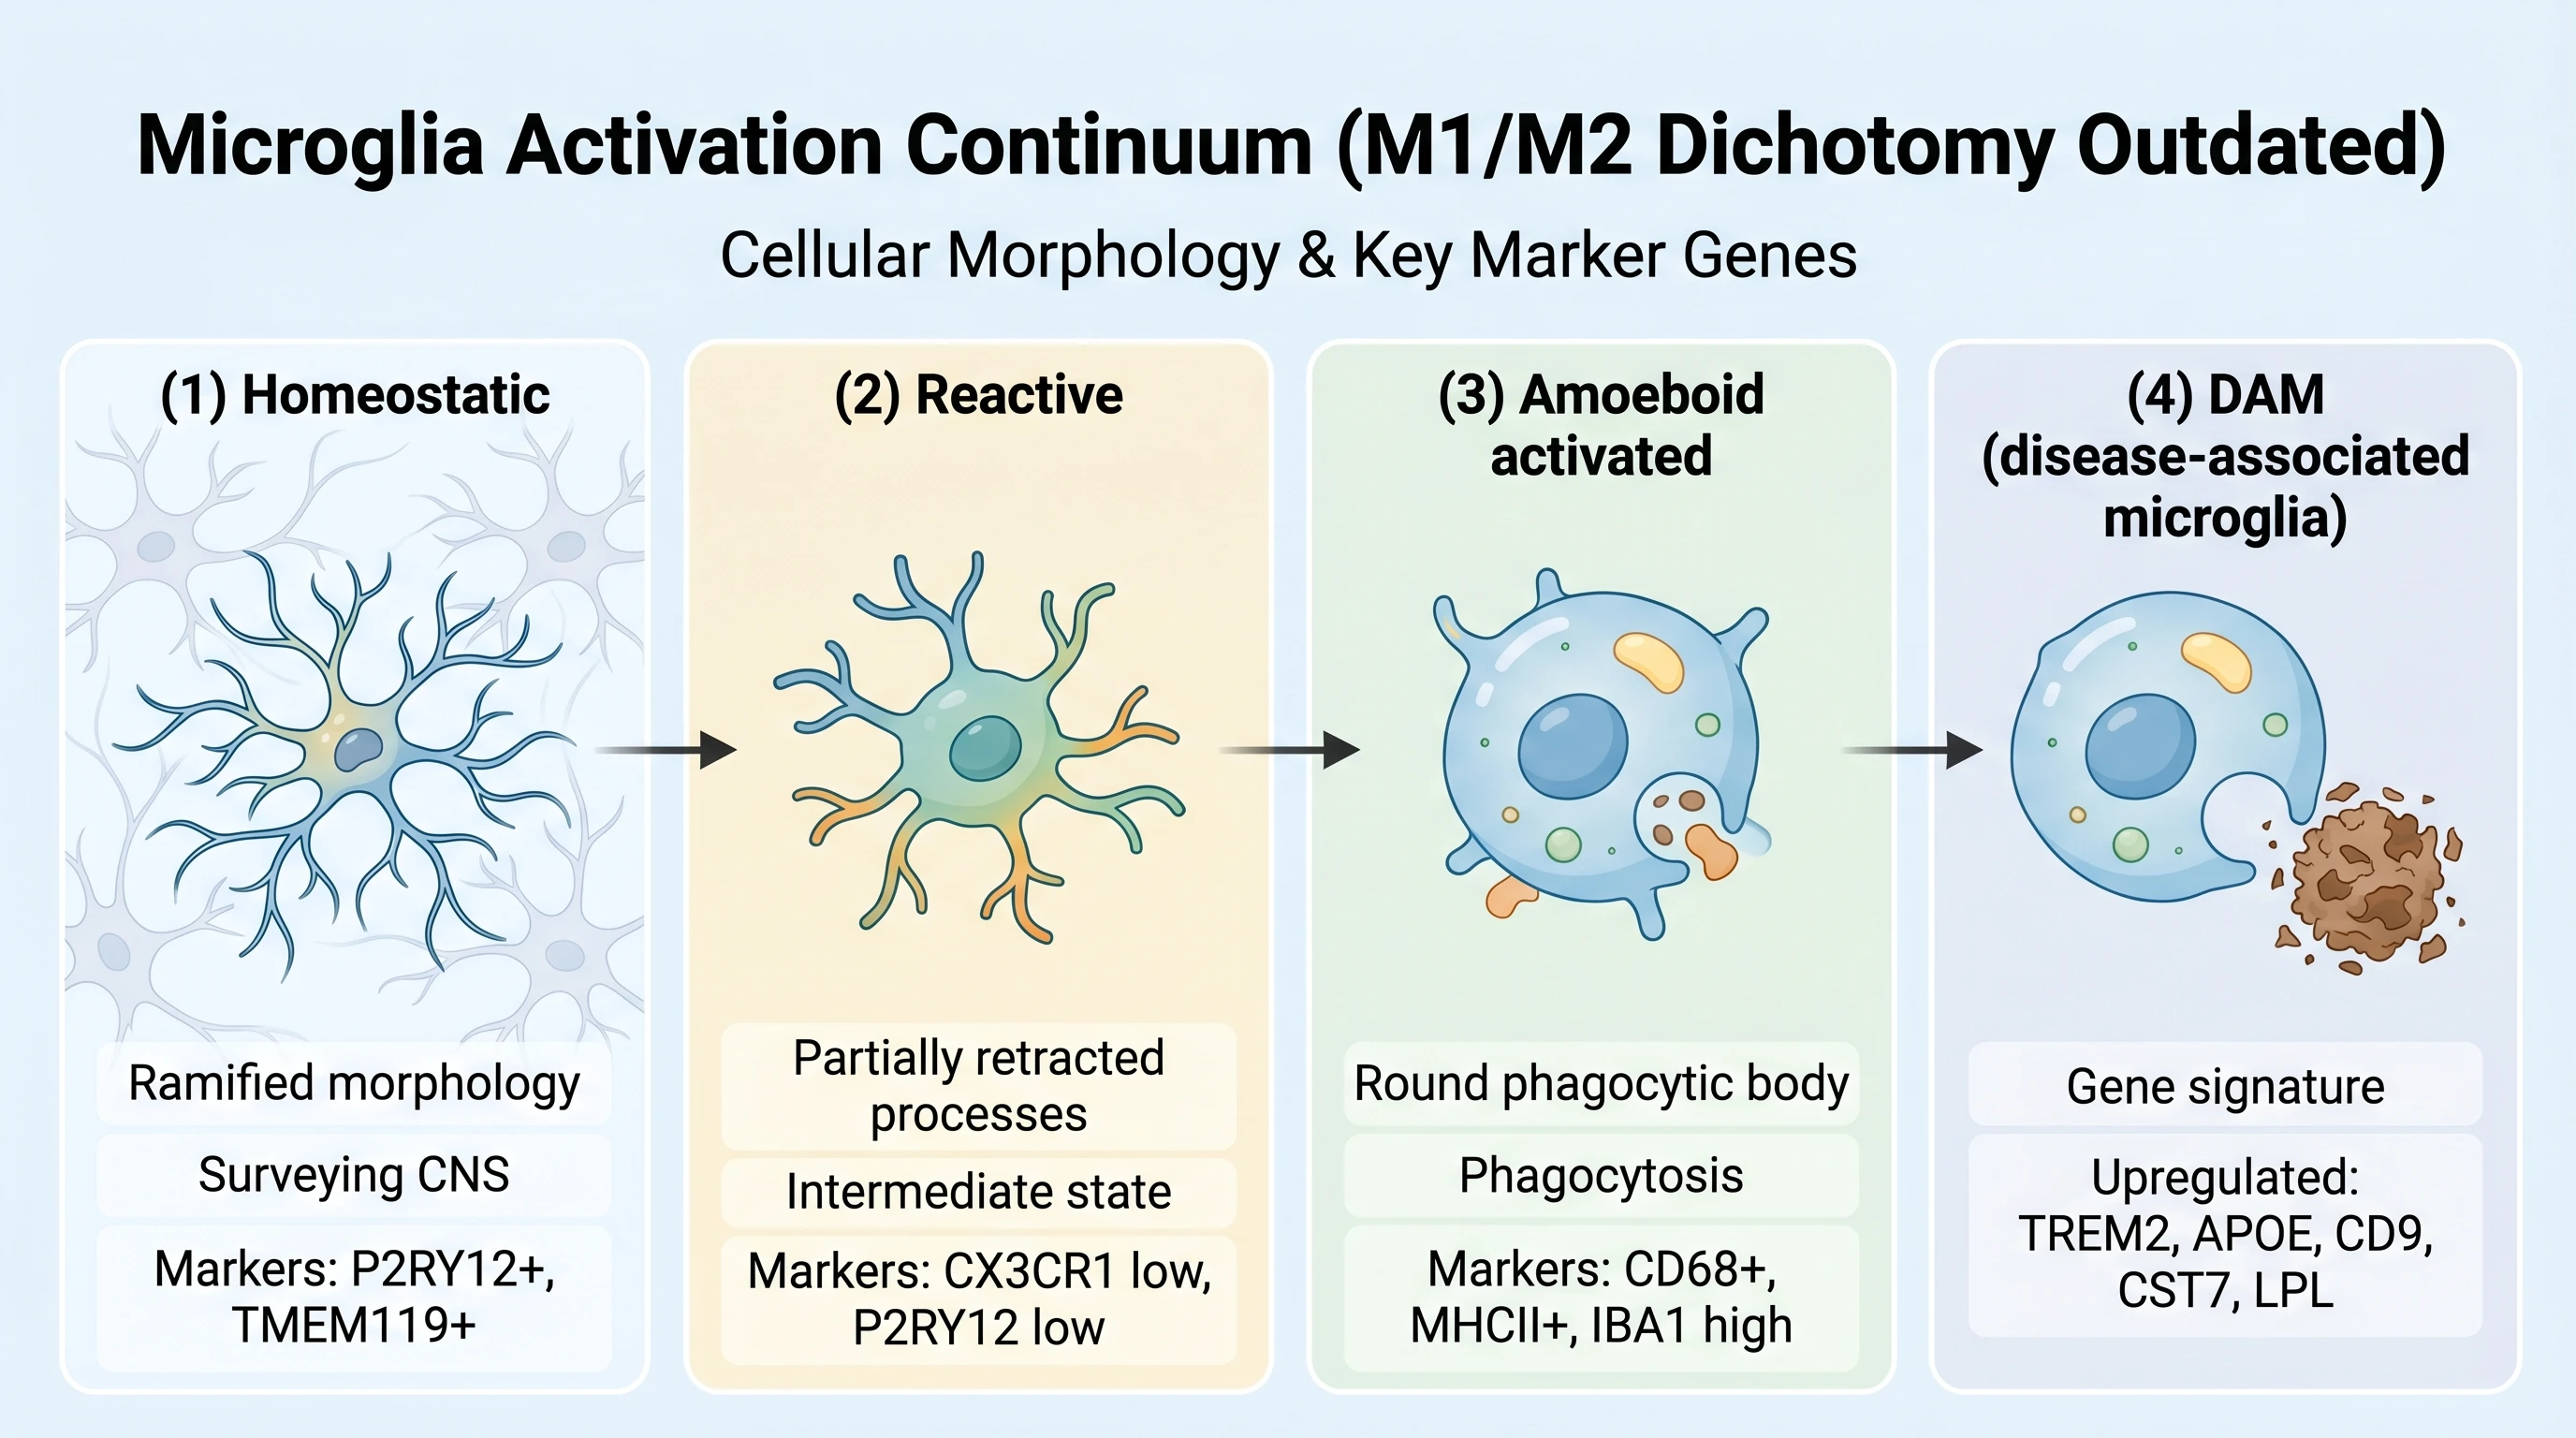
The most common conceptual error in microglia figures is treating activation as a binary switch — "resting" versus "activated," or the older "M1 versus M2" polarization model imported from peripheral macrophages. The modern view, supported by single-cell transcriptomics, is a continuum of overlapping transcriptional states whose boundaries are graded rather than sharp.
Microglia morphology continuum: ramified homeostatic → reactive → amoeboid → DAM signature with TREM2, APOE, CD9, CST7 markers (Figure generated with SciFig)
The canonical morphological reference is the Kettenmann et al. 2011 Physiological Reviews microglia review (Accessed 2026-05-22). Homeostatic microglia are highly ramified — long, branched processes that continuously survey the brain parenchyma — and express a characteristic marker set including P2RY12, TMEM119, CX3CR1, and Sall1. Upon sensing damage cues (amyloid aggregates, apoptotic neurons, lipid debris), the processes retract, the cell body enlarges, and the microglia transitions through an intermediate reactive state into a more amoeboid, phagocytic morphology with downregulated homeostatic markers.
What single-cell sequencing added is a transcriptional layer underneath this morphology. The Keren-Shaul et al. 2017 Cell paper on disease-associated microglia (Accessed 2026-05-22) identified a specific transcriptional state — DAM — that microglia adopt around amyloid plaques in mouse models of AD. The DAM signature includes upregulation of TREM2, APOE, CD9, CST7, LPL, AXL, and ITGAX, with concomitant downregulation of homeostatic genes. Critically, the DAM transition is TREM2-dependent: in TREM2-deficient animals, microglia get stuck in a partial intermediate state and fail to fully engage plaque-clearance programs.
For AAIC figure design, two pitfalls dominate. First, do not import M1/M2 polarization terminology — the Ransohoff 2016 Nature Neuroscience critique (Accessed 2026-05-22) argues the dichotomy is not supported in vivo and the field has largely abandoned it. Use the homeostatic-reactive-DAM continuum with explicit marker labels instead. Second, do not collapse morphology and transcriptional state into a single arrow — they are correlated but separable axes, and posters that conflate them invite reviewer pushback.
3. TREM2 Signaling Pathway from Receptor to Phagocytosis
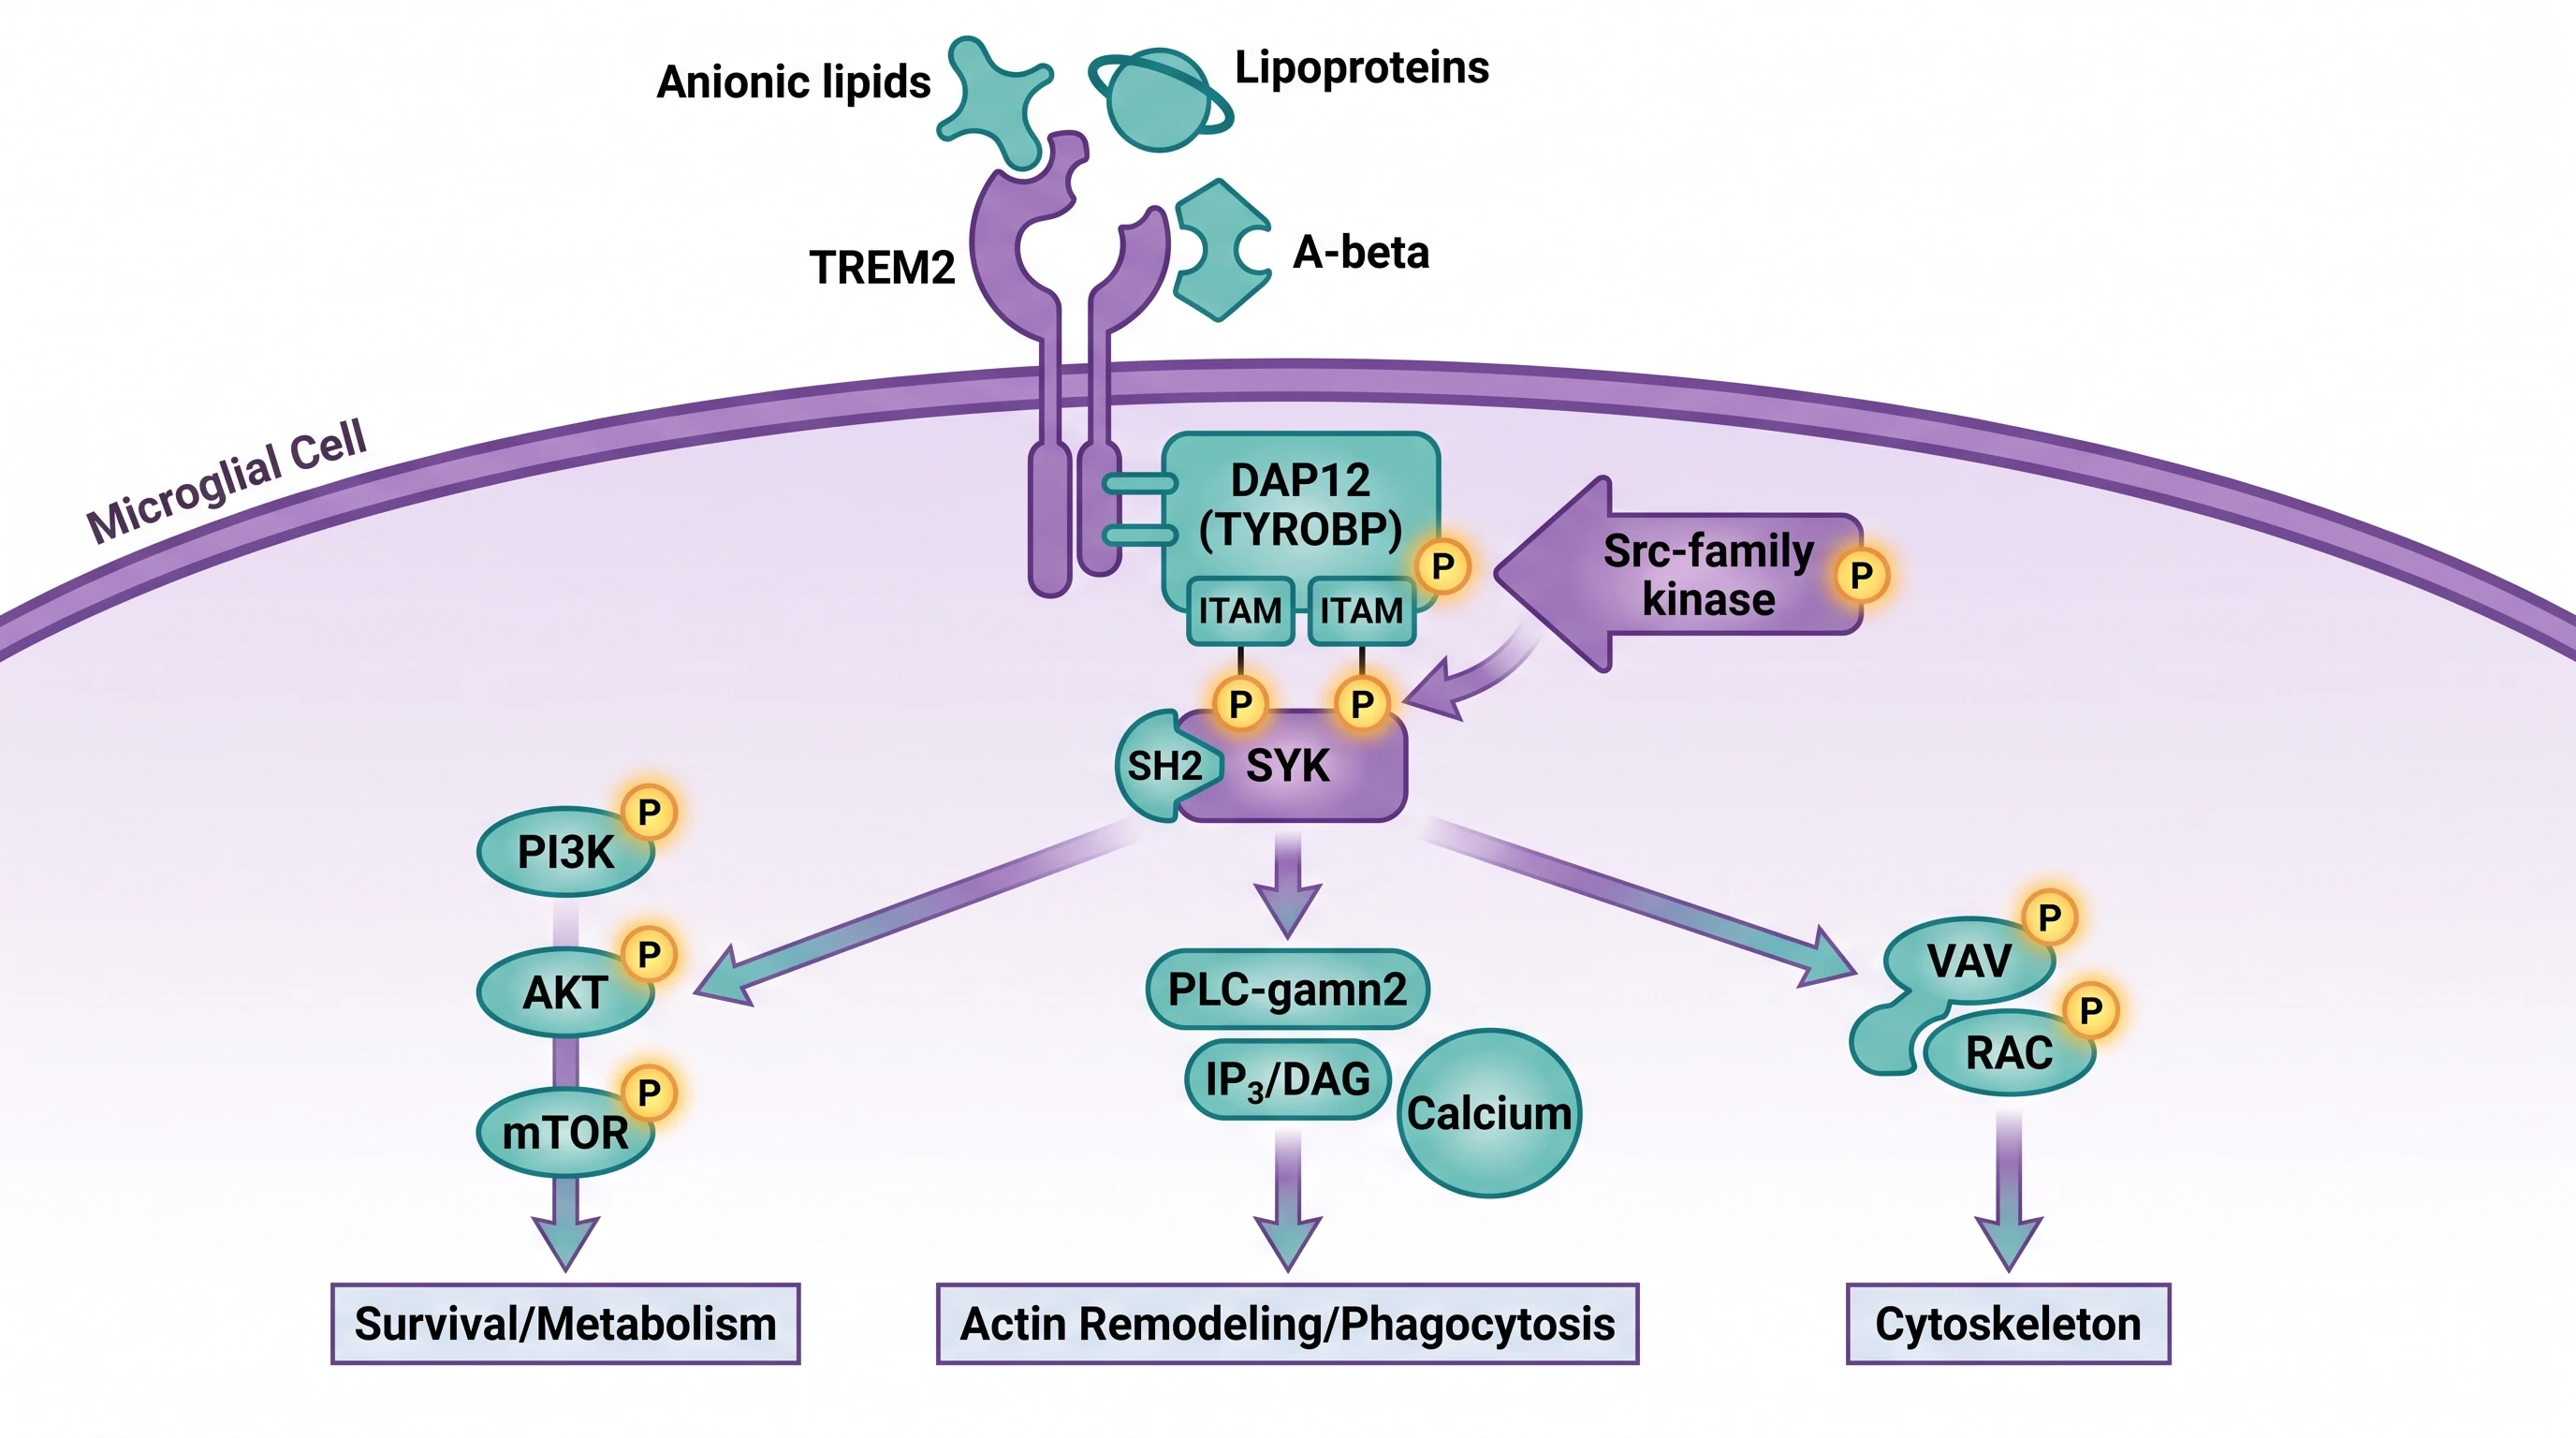
The TREM2 receptor itself is structurally simple — a single-pass type I transmembrane protein with an extracellular IgV-like ligand-binding domain, a short stalk, a transmembrane helix, and a very short cytoplasmic tail with no signaling motif of its own. The signaling competence comes from coupling, in the membrane, to the adapter protein DAP12 (also known as TYROBP), whose cytoplasmic tail carries an immunoreceptor tyrosine-based activation motif (ITAM).
The canonical cascade, reviewed in Ulland and Colonna 2018 Nature Reviews Neurology (Accessed 2026-05-22), runs as follows. A ligand — anionic lipids, lipoproteins (including ApoE-bound lipid particles), Aβ aggregates, or apoptotic-cell phosphatidylserine — engages the TREM2 IgV ectodomain. This triggers Src-family kinases to phosphorylate the DAP12 ITAM tyrosines. The phosphorylated ITAM recruits SYK kinase via tandem SH2 domains. SYK then propagates the signal through several branches: a PI3K → AKT → mTOR arm supporting microglial survival and metabolism; a PLCγ2 → IP3/DAG → calcium arm driving actin remodeling and phagocytic cup formation; and a VAV → RAC → cytoskeletal arm supporting process motility and engulfment. DAP12 itself was first characterized by Lanier 2009 in a Nature Immunology review on DAP12 ITAM signaling (Accessed 2026-05-22) — a useful reference if a reviewer asks how a receptor with no intracellular signaling domain can produce robust phagocytic output.
Three details matter for figure design, and are the ones generic AI image models most often get wrong. First, TREM2 and DAP12 are separate polypeptides associated in the membrane — many drafts fuse them into one chimeric receptor. Second, the cytoplasmic tail of TREM2 is short and carries no ITAM; the ITAM lives on DAP12. Third, SYK is recruited to the phosphorylated ITAM, not directly to TREM2 — drafts that draw a TREM2-SYK arrow with no DAP12 in between collapse the canonical biology.
4. TREM2 R47H and Risk Variants: Loss-of-Function Mechanism
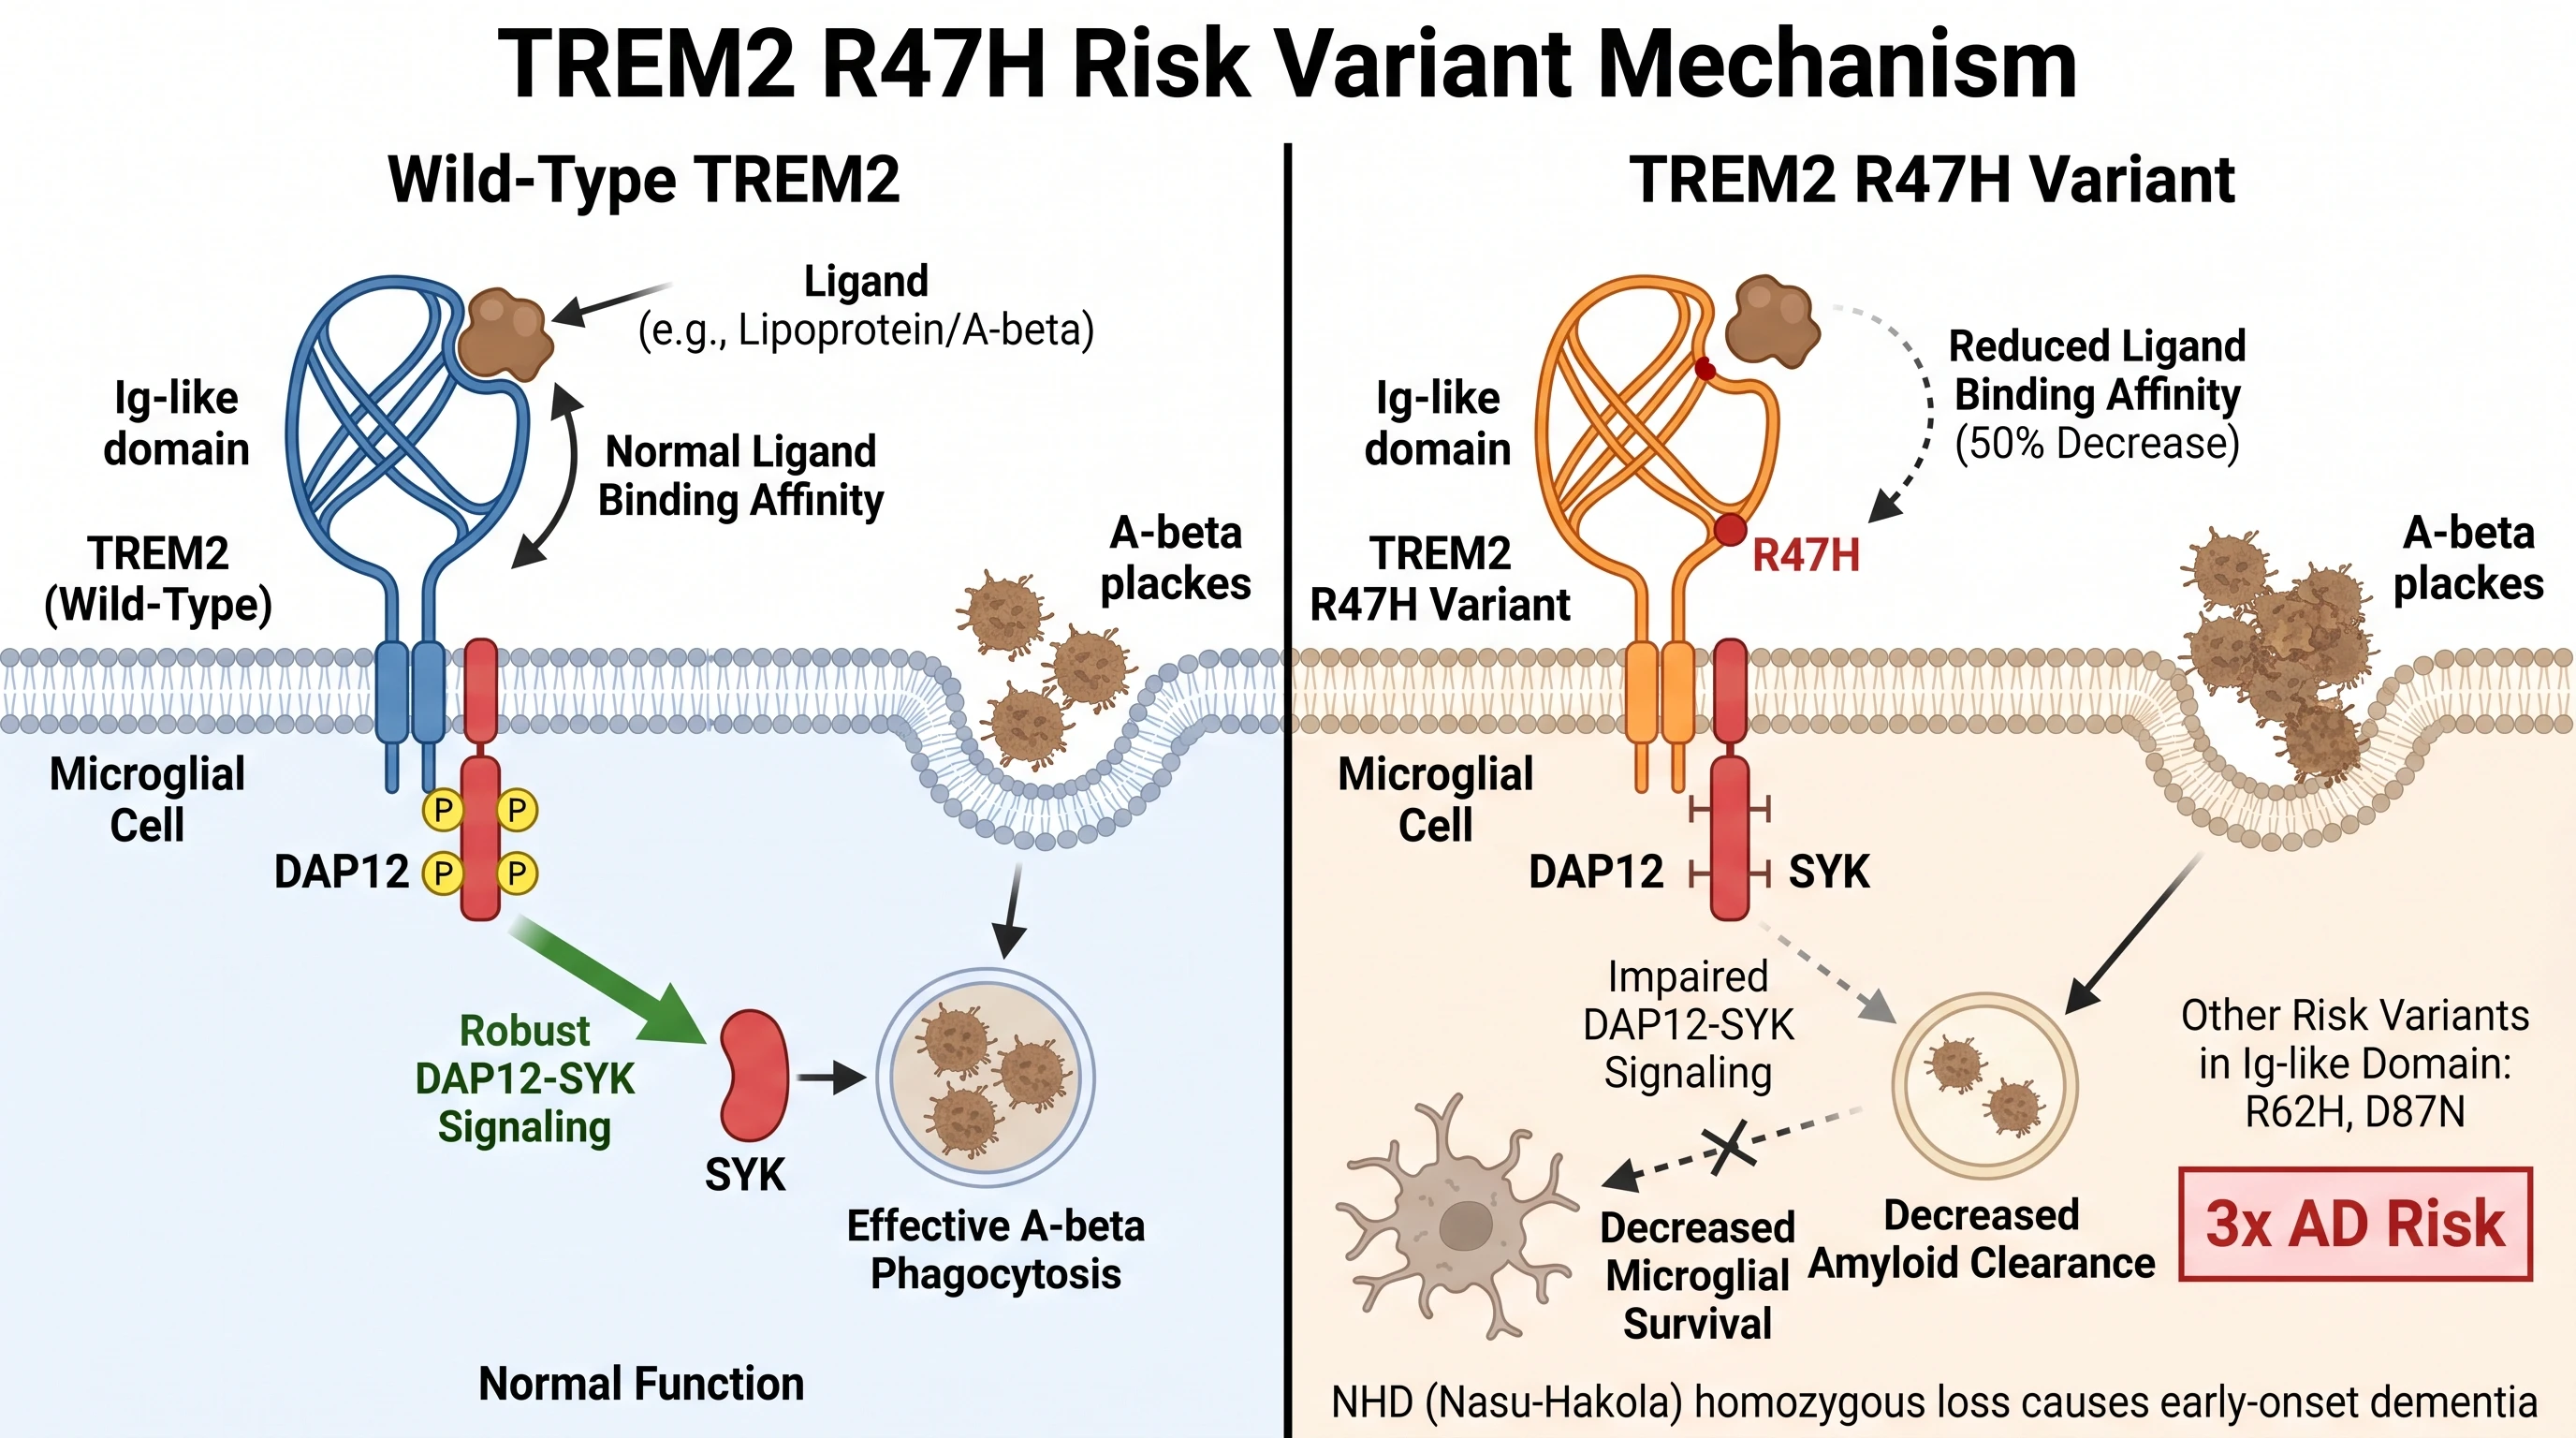
TREM2 R47H is the single most consequential AD risk variant identified by sequencing, and it is the figure where AI image models most frequently get the directionality wrong. The mistake matters because R47H is a loss-of-function variant, not gain — and the entire mechanistic narrative of "TREM2-deficient microglia cannot clear amyloid effectively" hinges on that direction.
TREM2 R47H loss-of-function: impaired ligand binding vs wild-type, reduced DAP12-SYK signaling, decreased amyloid plaque clearance (Figure generated with SciFig)
The original 2013 NEJM papers reported that R47H carries a roughly three-fold increased risk of late-onset Alzheimer's disease — comparable in magnitude to one APOE ε4 allele. Functional characterization including Song et al. 2017 Journal of Experimental Medicine (Accessed 2026-05-22) demonstrated that the R47H substitution sits in the IgV ectodomain and reduces ligand binding affinity for anionic lipids, lipoproteins, and apoptotic-cell ligands. Reduced ligand engagement means reduced DAP12 ITAM phosphorylation, reduced SYK recruitment, and reduced downstream phagocytic and survival output. The biological consequence is microglia that engage amyloid plaques less effectively and fail to mount a full DAM transcriptional response — exactly the phenotype that increases AD risk.
The clinical end of the loss-of-function spectrum is Nasu-Hakola disease (NHD), in which homozygous biallelic loss-of-function mutations in TREM2 (or DAP12) cause presenile dementia with bone cysts. The original gene identification by Paloneva et al. 2002 American Journal of Human Genetics (Accessed 2026-05-22) established that complete TREM2 loss is sufficient to cause a presenile neurodegenerative syndrome — strong evidence that the TREM2 pathway is non-redundant in human CNS biology. Heterozygous risk variants (R47H, R62H, D87N) sit on the partial-loss end of the same spectrum.
Two implications for your figure. First, the R47H arrow in any signaling diagram must be smaller than wild-type, not bigger. Second, if R47H is drawn to motivate a therapeutic angle (TREM2 agonist antibody, soluble TREM2, lipid-targeted activator), label the strategy as "restoring lost function" rather than "blocking pathological signaling" — the polarity of the therapeutic narrative depends on getting the variant direction right.
5. Microglia-Amyloid Plaque Interaction and the Halo
Microglia do not just sit near amyloid plaques as passive observers — they form a characteristic peri-plaque halo, physically encircle the plaque core, and actively engage in phagocytic uptake of Aβ fibrils. This is one of the most consistently depicted figures across AAIC basic-science posters and one where AI image models often get the spatial relationships wrong.
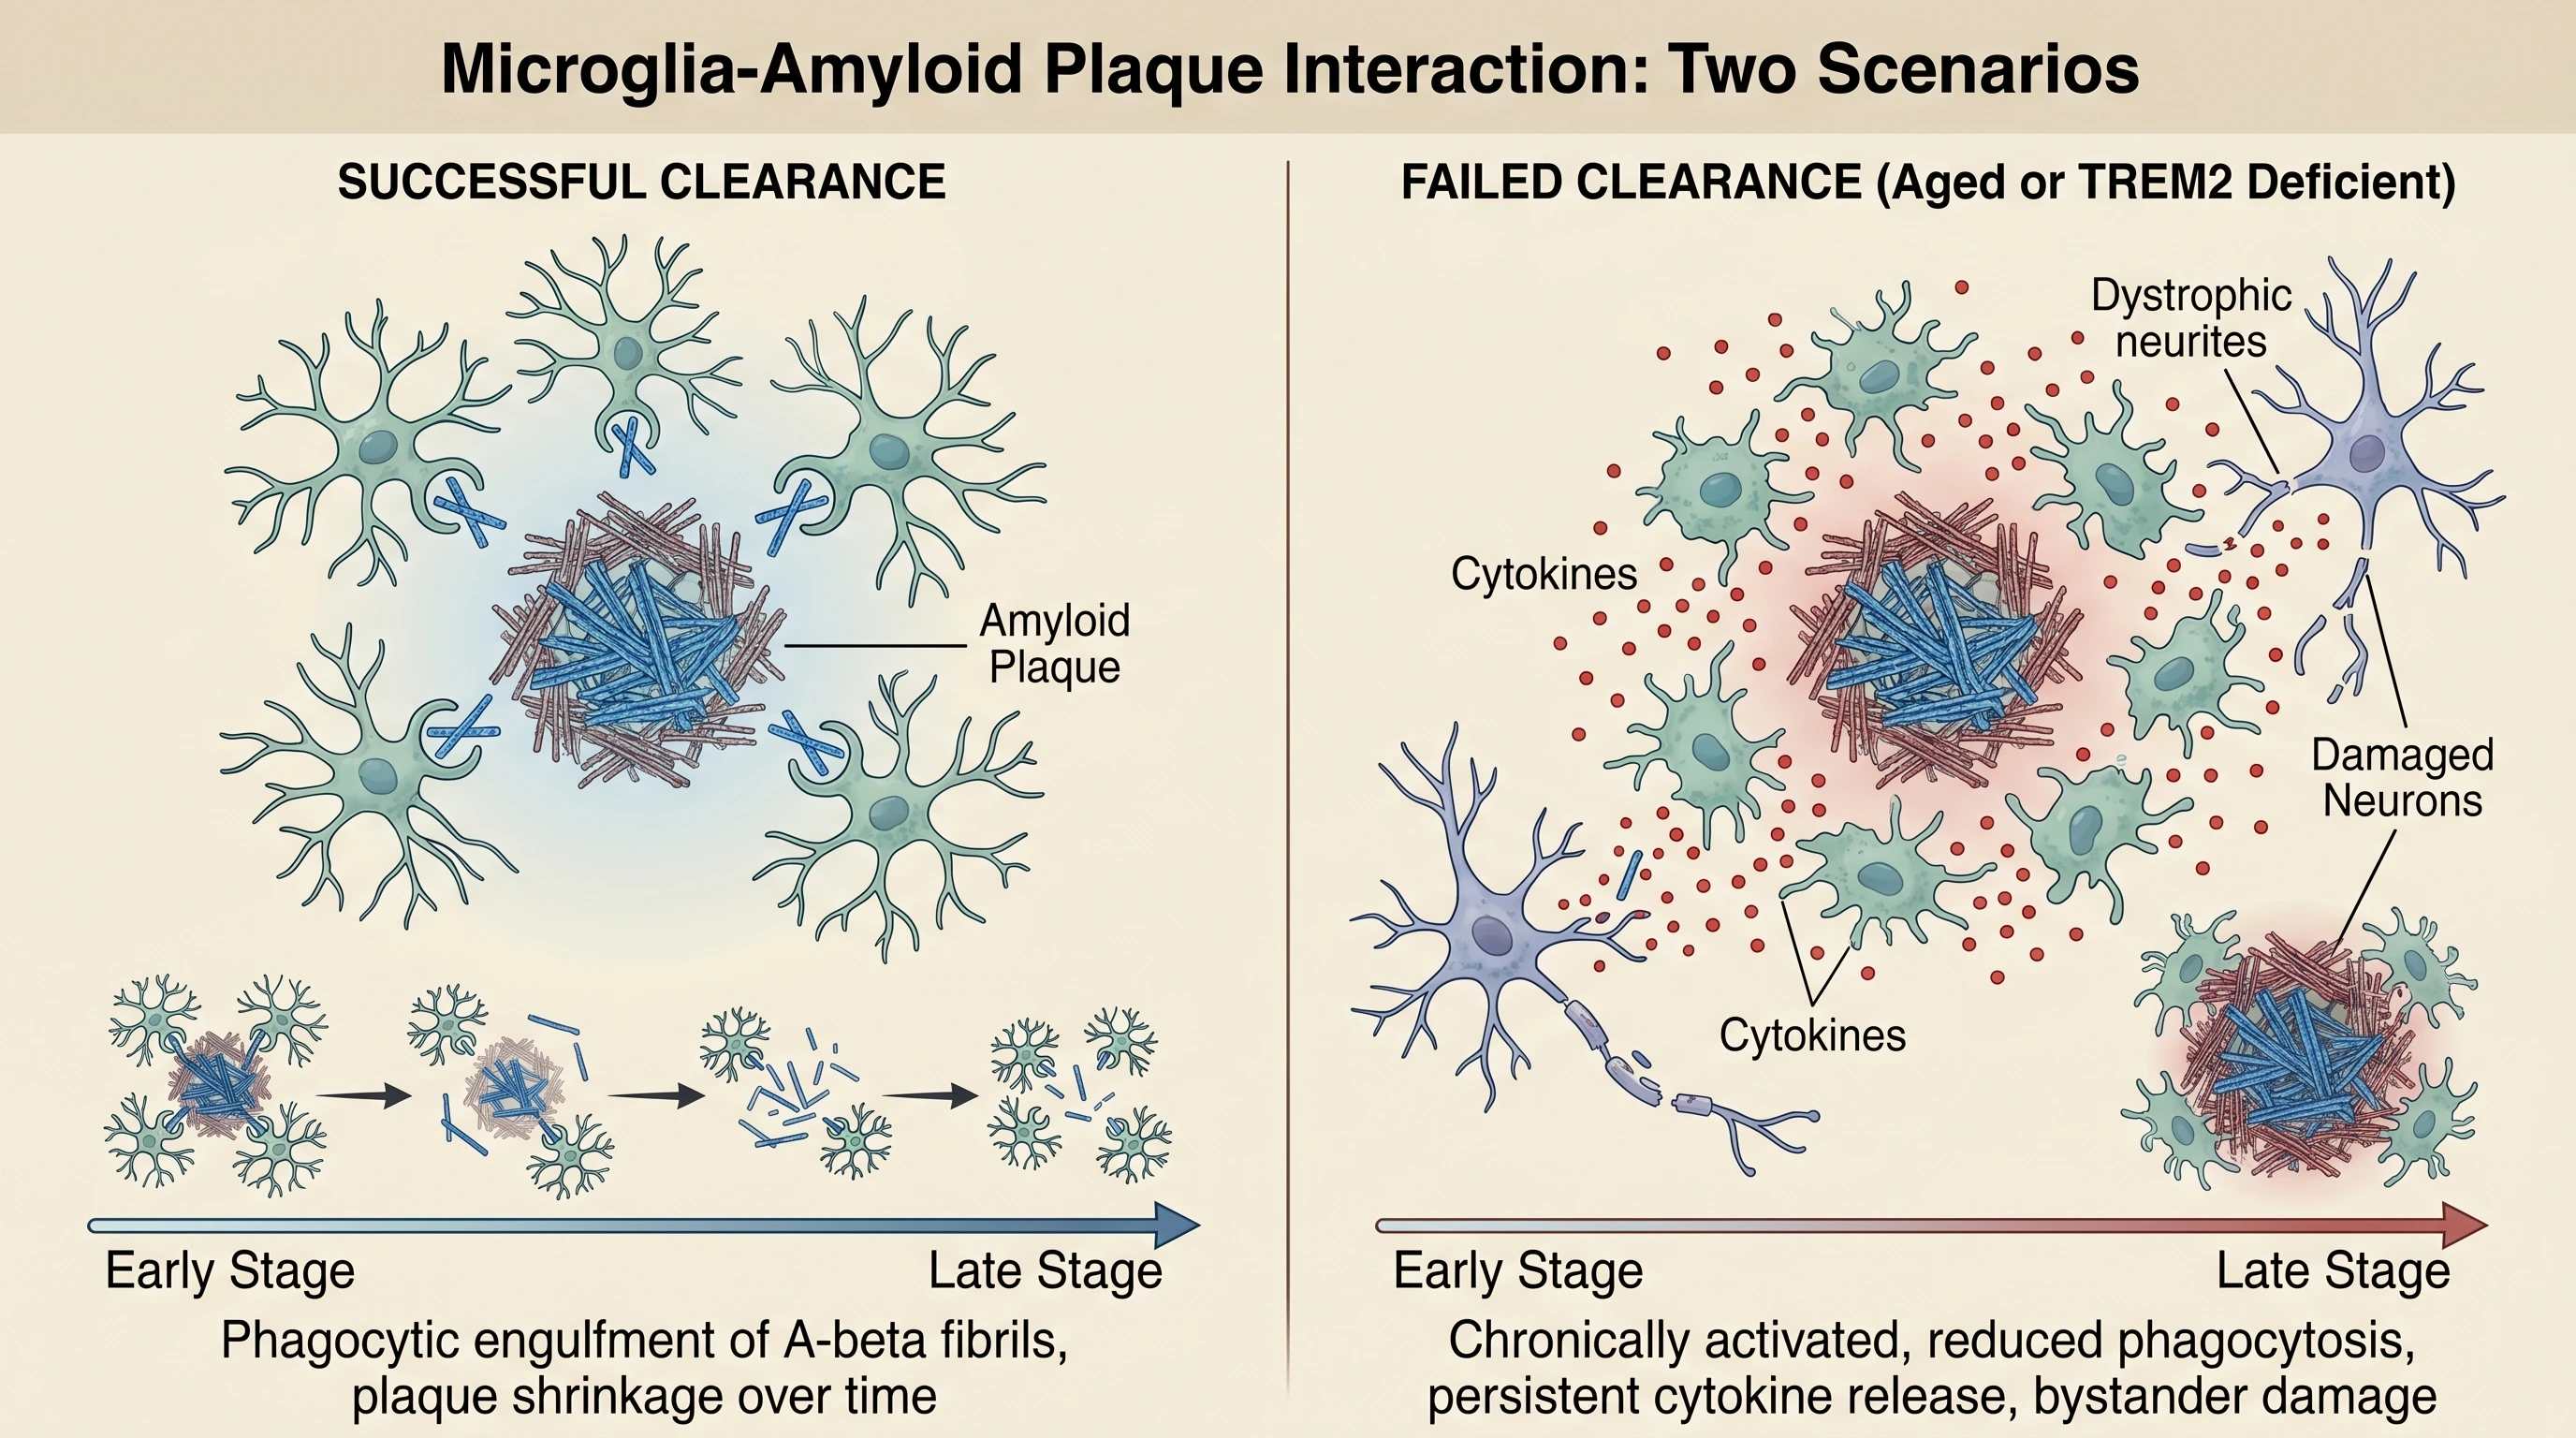
Microglia clustering around amyloid plaque forming clearance halo, contrasted with failed clearance showing chronic activation and neuronal damage (Figure generated with SciFig)
The functional importance of the halo was crystallized by Condello et al. 2015 Nature Communications (Accessed 2026-05-22), which showed that the microglial peri-plaque envelope acts as a barrier that constrains plaque growth and limits the spread of axonal dystrophy into surrounding parenchyma. Where the barrier is intact, the plaque remains compact and surrounding neurites are relatively spared; where it breaks down — with aging-associated microglial dysfunction or in TREM2-deficient settings — axonal pathology spreads outward and synaptic loss accelerates. The TREM2 dependence of plaque clearance was characterized in mouse models in Wang et al. 2015 Cell (Accessed 2026-05-22), which demonstrated that TREM2 deficiency impairs microglial response to amyloid and that exogenous TREM2 signaling can rescue clearance.
When the clearance program fails — through age-related microglial senescence, TREM2 variant loss-of-function, or chronic inflammatory exhaustion — the same microglia that should be clearing amyloid become a source of secondary damage. They release cytokines onto adjacent neurons, lose their barrier function around plaques, and contribute to the bystander neuronal damage that defines later-stage AD pathology. For your poster, the two-panel comparison (intact halo and shrinking plaque on the left, dispersed microglia and bystander neurite damage on the right) communicates the core idea more clearly than any single timepoint snapshot.
This also matters for therapeutic context. The anti-amyloid antibodies that recently cleared regulatory review — lecanemab and donanemab — rely in part on microglial Fc-receptor-mediated phagocytic clearance of antibody-decorated Aβ. The microglia-plaque interaction figure is therefore not just descriptive biology but the mechanistic substrate for the MOA panel on many translational posters at AAIC 2026. For the amyloid pathology side of this story, see the companion piece on amyloid-tau mechanism illustrations for AAIC 2026.
6. Neuroinflammation Cytokine Cascade and Complement Synapse Pruning
Once microglia are chronically activated, the cytokine output and the complement output diverge into two parallel arms that together drive the neuroinflammation phenotype.
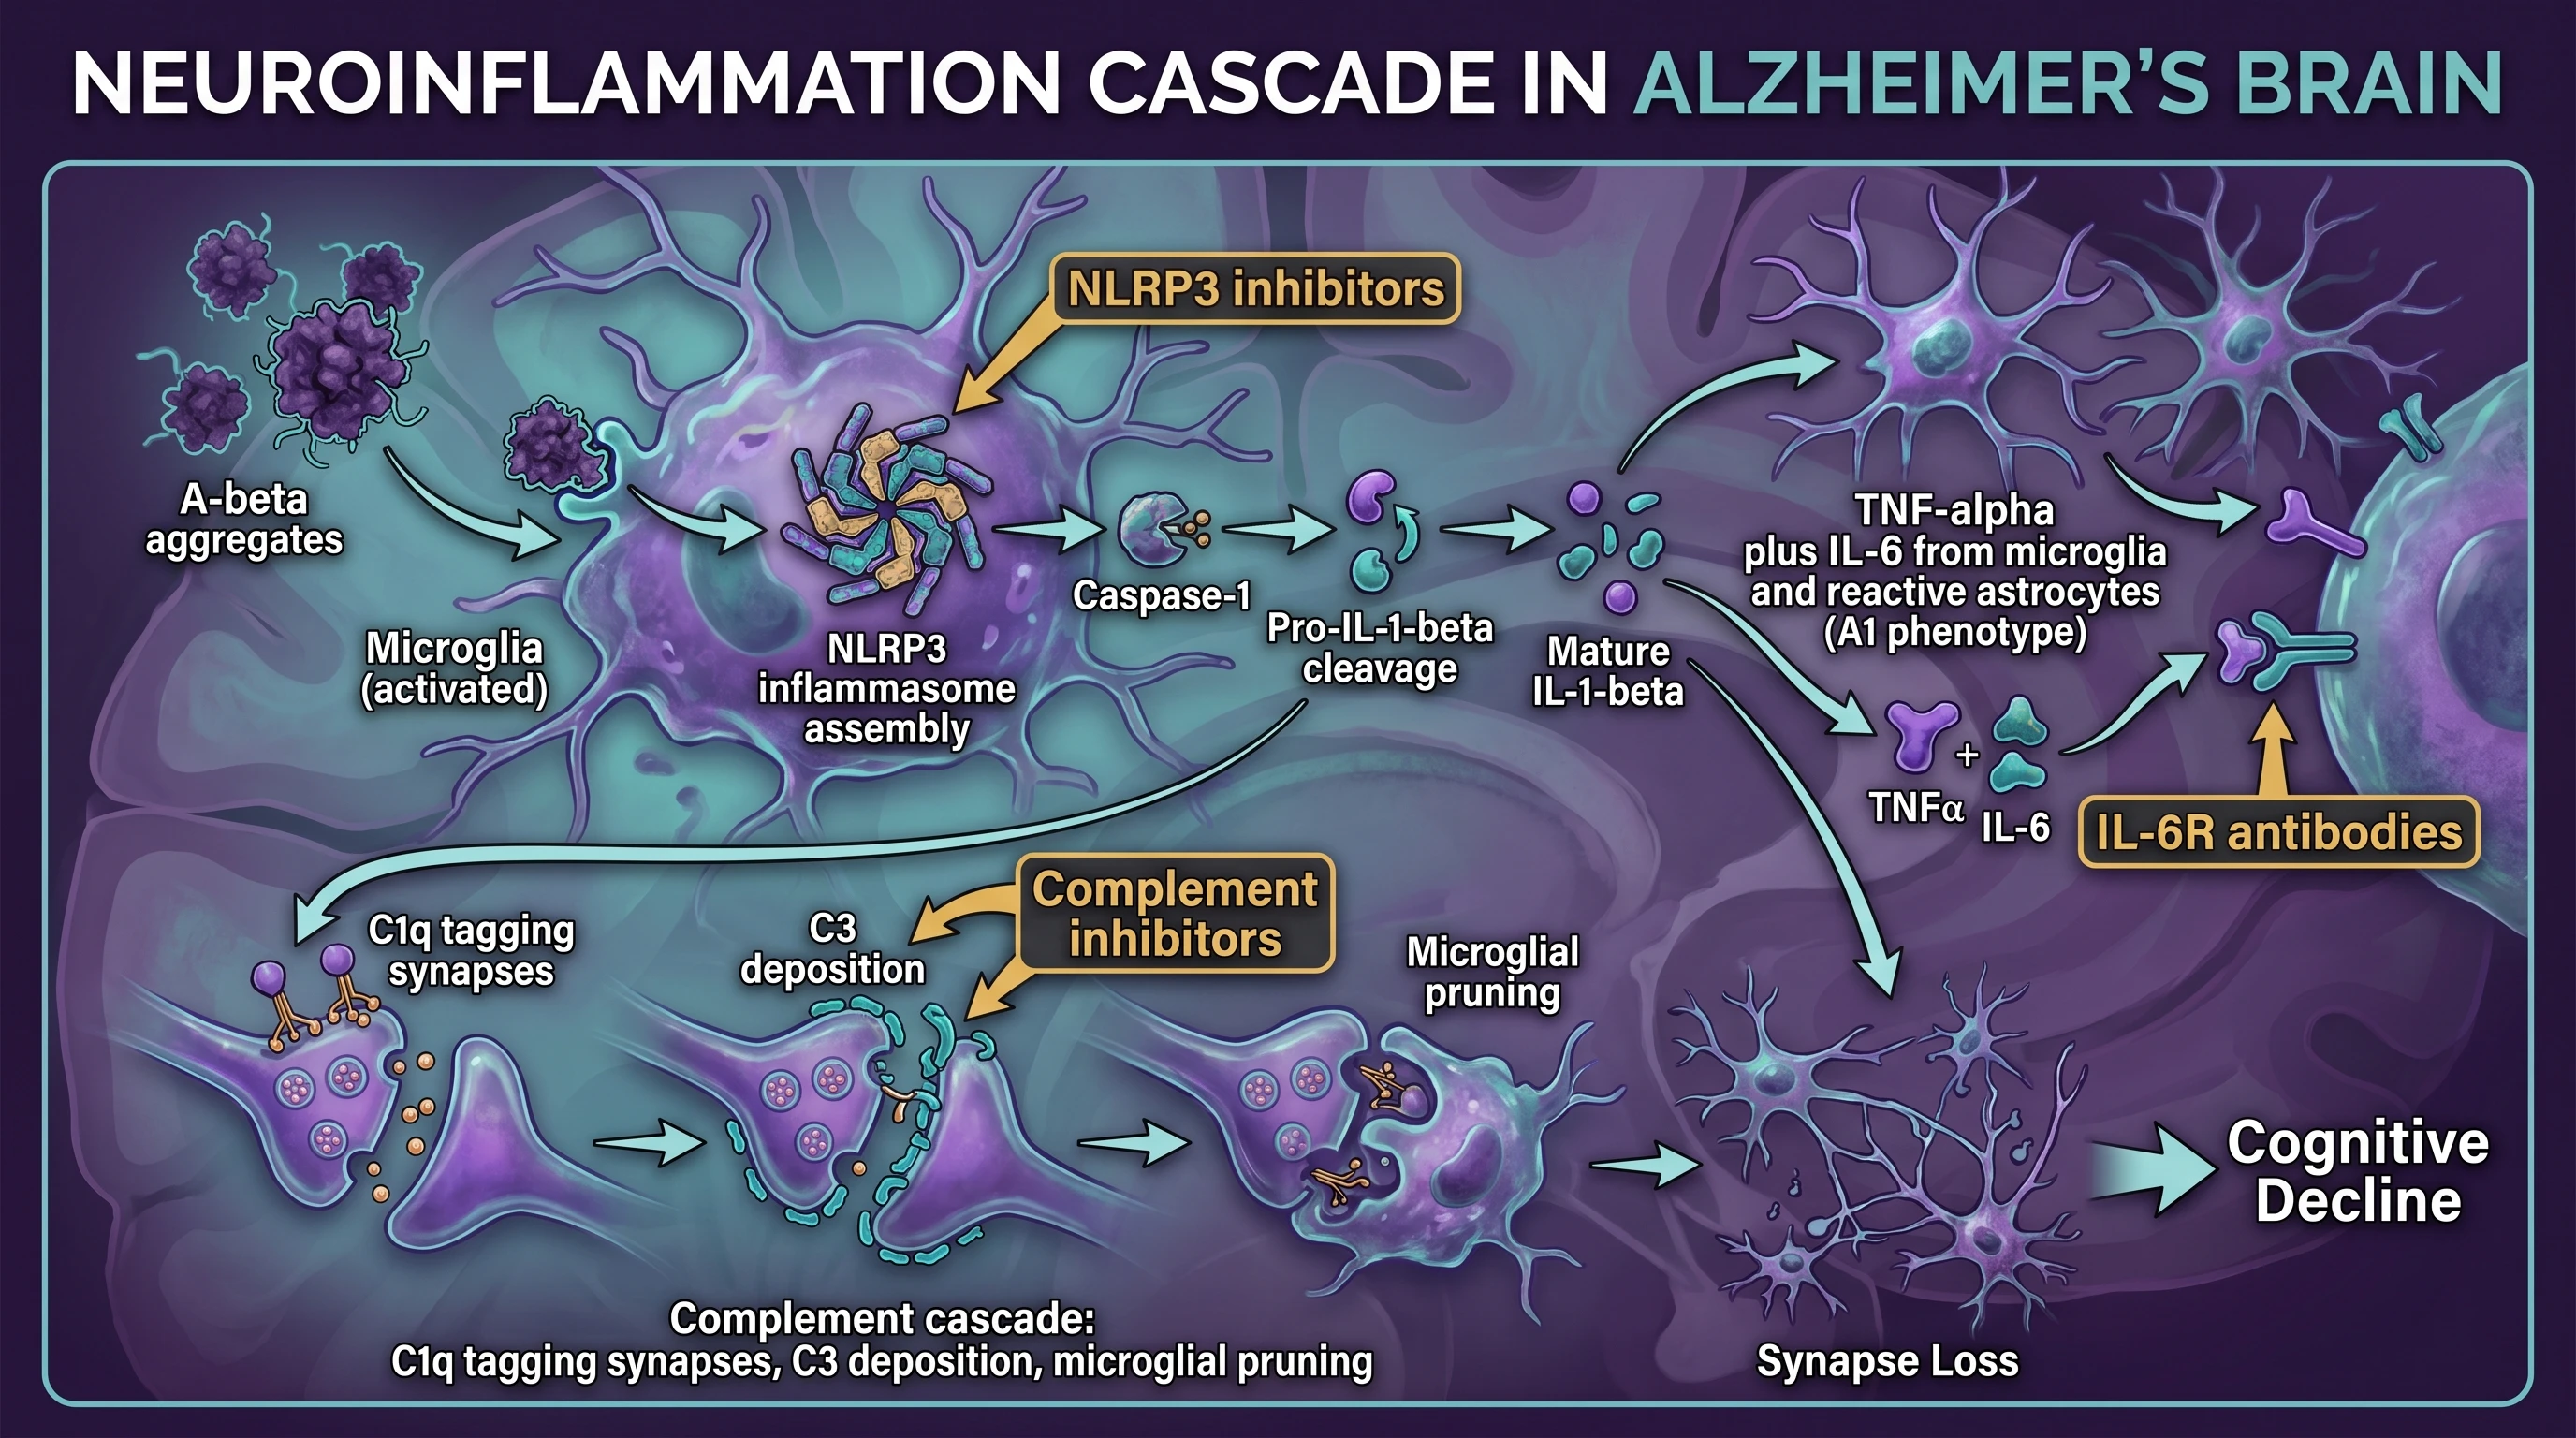
The cytokine arm starts with NLRP3 inflammasome assembly. Heneka et al. 2013 Nature (Accessed 2026-05-22) demonstrated that Aβ aggregates trigger NLRP3 inflammasome activation in microglia, with caspase-1 cleavage of pro-IL-1β into the mature secreted form. Mature IL-1β then amplifies the inflammatory program by inducing TNF-α and IL-6 from microglia and reactive astrocytes, which in turn sustain microglial activation through a positive feedback loop. The broader cascade, reviewed in Heneka et al. 2015 Lancet Neurology (Accessed 2026-05-22), is now treated as a coequal contributor to AD progression rather than a downstream epiphenomenon. Within this cascade, the order matters in figure design: NLRP3 assembly precedes caspase-1 activation, which precedes IL-1β maturation; IL-1β release precedes the TNF-α/IL-6 amplification loop. Generic AI image models frequently scramble this ordering, drawing TNF-α release before NLRP3 assembly or treating IL-6 as the initiating signal — both errors that a reviewer can spot from across the room.
The complement arm is the second engine. Hong et al. 2016 Science (Accessed 2026-05-22) showed that the classical complement cascade — C1q tagging vulnerable synapses, followed by C3 deposition and microglial complement-receptor-3-mediated engulfment — drives synapse loss in early Alzheimer's models. The signal flow in the canonical figure runs: C1q binding to weak or aberrant synapses → local C3 cleavage and deposition → microglial recognition of C3 fragments → engulfment of the tagged synapse by the microglia. Reverse any of those steps and the figure stops making biological sense.
The third strand that belongs on a comprehensive neuroinflammation figure is microglia-astrocyte crosstalk. Liddelow et al. 2017 Nature (Accessed 2026-05-22) characterized the A1 reactive astrocyte state induced by microglial IL-1α, TNF-α, and C1q — a phenotype that is itself neurotoxic and that closes a damaging microglia-astrocyte feedback loop. A figure that includes both microglia and astrocytes as participants, with explicit cytokine arrows between them, communicates the modern understanding of glial-immune coupling better than a microglia-only figure does.
7. Disrupted Neuroinflammation Across Neurodegeneration: AD, Parkinson's, FTD, Aging
The TREM2-microglia-cytokine framework you have built up across H2 sections 2 through 6 is not specific to Alzheimer's. It generalizes across neurodegeneration, and for posters that compare disease states or motivate a cross-disease therapeutic angle, the comparison figure is high-yield.
Disease
Trigger / Substrate
Microglia State
Specific Mechanism
Alzheimer's disease
Aβ plaques, hyperphosphorylated tau
DAM + chronic NLRP3 activation
TREM2-dependent plaque clearance; complement-driven synapse loss
Parkinson's disease
α-synuclein aggregates (Lewy bodies)
TLR2/4-driven activation around midbrain dopaminergic neurons
For Parkinson's disease posters, the canonical reference for microglia-α-synuclein interaction is Wang et al. 2015 Journal of Neuroscience (Accessed 2026-05-22), which characterized how aggregated α-synuclein engages microglial pattern recognition receptors and drives an inflammatory phenotype contributing to dopaminergic neuron loss in the substantia nigra. For FTD with tau pathology, Asai et al. 2015 Nature Neuroscience (Accessed 2026-05-22) showed that microglia can internalize tau aggregates and re-secrete tau-containing exosomes that propagate seeds to neighboring neurons — a microglia-mediated amplification mechanism specific to the tau axis. TREM2 loss-of-function tends to amplify tau pathology in mouse models, adding another layer to the TREM2 narrative beyond amyloid.
For aging-as-substrate posters, inflammaging — chronic low-grade inflammation that accumulates with age and predisposes to multiple neurodegenerative trajectories — is the connecting theme. Streit 2006 Trends in Neurosciences (Accessed 2026-05-22) introduced the microglial senescence concept that frames much of the modern literature, and the broader inflammaging framework is captured in the NIA aging immune system dossier. For posters that bridge into the APOE-TREM2 interaction, the Yeh et al. 2017 Trends in Molecular Medicine review (Accessed 2026-05-22) connects APOE ε4, microglial lipid metabolism, and TREM2-dependent phagocytic competence.
8. AI-Powered TREM2 and Microglia Diagrams: SciFig Workflow for Neuroinflammation Posters
Here is the part where the TREM2 signaling pathway, the microglia continuum figure, and the cytokine cascade go from "blocking your week" to "drafted before lunch" — and it is also where you find out why generic AI is structurally inadequate for this specific kind of figure.
If you have already tried generating a TREM2 signaling diagram with GPT image or Midjourney, you have probably seen the result from the top of this article: the model treats R47H as a gain-of-function variant and draws bigger downstream arrows than wild-type. You re-roll, and now DAP12 is on the extracellular side of the membrane. You re-roll again, and the SH2-domain recruitment of SYK to a phosphorylated ITAM is replaced by a direct, fictional TREM2-SYK bond with DAP12 dropped entirely. Try the microglia continuum figure, and the model labels homeostatic microglia with DAM markers and labels DAM microglia with homeostatic P2RY12 — the transcriptional axis has been swapped. Try the cytokine cascade, and IL-6 release precedes NLRP3 inflammasome assembly. None of this is one-vendor-specific — no generic image model today can reliably reach 100 % accuracy on a TREM2-pathway diagram on the first try, because the model is producing a visually plausible composition without understanding that microglia signaling is a chain of specific, peer-reviewed mechanistic claims. One inverted ITAM, one R47H drawn as gain-of-function, and the reviewer concludes you do not know your own pathway. For a neuroinflammation poster, a signaling diagram with one wrong arrow is worse than no diagram — it actively misleads the reviewer about the biology you are claiming to study.
SciFig is built for exactly this gap. Best-in-class image generation models bring the first-pass TREM2 signaling figure to a high-fidelity starting point — the TREM2 ectodomain, the DAP12 adapter, the ITAM phosphorylation step, the SYK recruitment, the downstream PI3K and PLCγ2 branches — most of which is correct on draft one. But for the precision details that matter most — verifying that DAP12 sits on the cytoplasmic side, confirming the ITAM lives on DAP12 and not on TREM2, checking that the R47H arrow is smaller than wild-type rather than bigger, making sure NLRP3 assembly precedes caspase-1 cleavage in your cytokine figure — an editable vector canvas in the browser lets you click any label and rename it, drag any arrow and reposition it, scale one element without rerolling the entire diagram. The remaining precision gap closes in seconds, not minutes. And the entire workflow stays inside SciFig — one-click export to editable PPTX for your lab meeting, layered SVG for downstream editing, or 8K PNG for A0 poster printing without artifacting. There is no roundtrip to Illustrator to "fix the ITAM placement" because you fix it in place where it was generated. For the parallel error set on the amyloid and tau side of the same disease — Aβ aggregation stages, NFT spatial pathology, antibody MOA panels — see the companion piece amyloid-tau mechanism illustrations for AAIC 2026; this guide covers the neuroinflammation error library.
Here is the path. Copy this prompt verbatim into SciFig Text-to-Figure to start the TREM2-DAP12-SYK signaling diagram:
TREM2 signaling pathway in microglia: TREM2 (single-pass type I
transmembrane protein with extracellular IgV-like ligand-binding
domain, short cytoplasmic tail with no signaling motif) on the
membrane binds ligand (anionic lipids, ApoE-bound lipoproteins,
Aβ aggregates, apoptotic-cell phosphatidylserine). TREM2
associates in the membrane with DAP12 (TYROBP) adapter, whose
cytoplasmic tail carries the ITAM motif. Src-family kinase
phosphorylates DAP12 ITAM tyrosines. SYK kinase is recruited via
tandem SH2 domains. Downstream: (1) PI3K → AKT → mTOR survival
arm, (2) PLCγ2 → IP3/DAG → calcium → actin remodeling phagocytosis
arm, (3) VAV → RAC cytoskeleton arm. Color-coded cascade with
phosphorylation events highlighted. Publication style.
See AI Scientific Figure Generation in Action
Watch how researchers create publication-ready scientific figures from text descriptions.
Adjust to your study — collapse pathway arms you are not addressing, expand the SYK-to-phagocytosis arm if that is where your intervention lives, annotate the TREM2 agonist antibody binding site if your poster is therapeutic. The model produces a starter pathway in seconds; the SciFig vector canvas lets you refine each label individually without rerolling. For the microglia continuum figure, the R47H variant figure, the plaque-halo figure, and the cytokine cascade figure, copy the prompts in Section 9 below.
9. Free Trial CTA, Copy-Paste Prompts, and Related Reading
The five remaining SciFig prompts for the figures shown in this article. Copy any of them directly into Text-to-Figure:
TREM2-DAP12-SYK signaling — see Section 8 above.
Microglia continuum (homeostatic → DAM):
Microglia activation continuum diagram showing 4 states left to right:
(1) Homeostatic — ramified morphology, long processes surveying CNS,
P2RY12+ TMEM119+ CX3CR1+ Sall1+; (2) Reactive — partially retracted
processes, intermediate state with downregulating homeostatic markers;
(3) Amoeboid activated — round phagocytic body with retracted processes;
(4) DAM (disease-associated microglia) — gene signature with TREM2,
APOE, CD9, CST7, LPL, AXL, ITGAX upregulated. Annotate that M1/M2
dichotomy is outdated. Label key marker genes for each state above
the cell. Publication style.
TREM2 R47H loss-of-function:
TREM2 R47H risk variant mechanism diagram. Left panel: wild-type TREM2
with normal ligand binding affinity in the IgV ectodomain → robust
DAP12 ITAM phosphorylation → strong SYK recruitment → effective Aβ
phagocytosis and DAM transition. Right panel: R47H variant in IgV
domain → reduced ligand binding affinity → impaired DAP12-SYK
signaling → decreased amyloid clearance + impaired DAM transition
→ ~3x AD risk. Annotate other partial-loss risk variants (R62H, D87N)
in the same IgV domain. Note that NHD (Nasu-Hakola) homozygous loss
causes presenile dementia with bone cysts. R47H arrows must be smaller
than wild-type, not bigger.
Microglia-amyloid halo (success vs failure):
Microglia-amyloid plaque interaction in two scenarios. Left: successful
clearance — 4-6 microglia form intact halo around dense-core plaque,
phagocytic engulfment of Aβ fibrils, compact plaque, sparing of
surrounding neurites. Right: failed clearance (aged or TREM2 deficient)
— microglia dispersed, halo broken, chronic cytokine release, axonal
dystrophy extending outward, bystander damage to nearby pyramidal
neurons. Side-by-side comparison with timeline arrows. Annotate
that anti-amyloid antibodies (lecanemab, donanemab) leverage the
left panel mechanism.
Neuroinflammation cytokine cascade:
Neuroinflammation cascade in Alzheimer brain: Aβ aggregates trigger
NLRP3 inflammasome assembly in microglia → caspase-1 activation →
pro-IL-1β cleavage → mature IL-1β release. Downstream amplification
loop: TNF-α + IL-6 from microglia and A1 reactive astrocytes feeding
back to sustain microglial activation. Parallel complement arm:
C1q tags vulnerable synapses → C3 deposition → microglial CR3
recognition → synapse engulfment → synapse loss → cognitive decline.
Annotate therapeutic targets (NLRP3 inhibitors, IL-6R antibodies,
complement inhibitors). Order matters: NLRP3 → caspase-1 → IL-1β
→ TNF-α/IL-6, not the reverse.
APOE-TREM2 interaction (optional add-on):
APOE-TREM2 interaction in microglia lipid handling: ApoE4 binds
TREM2 IgV domain less efficiently than ApoE3; reduced ApoE4-TREM2
engagement impairs microglial uptake of lipid-Aβ complexes near
plaques; downstream phagocytic and DAM-transition output reduced.
Annotate that APOE ε4 homozygosity and TREM2 R47H combine in a
synergistic risk pattern for late-onset AD. Label lipid droplets
in microglia.
A new SciFig account starts with 150 starter credits plus 50 refill credits every day. The six figures in this article — cover, microglia continuum, TREM2 signaling, R47H variant, microglia-plaque halo, and the cytokine cascade — typically consume 50–80 credits with iteration. Your starter pack covers the full neuroinflammation figure set plus daily refill margin for refinement. See the pricing page if you anticipate building figures for multiple posters across the year.
For the basics of AAIC poster format, the late-acceptance window, and the Beyond the Data hook unique to AAIC, start with AAIC 2026 poster guidelines and Beyond the Data. For visual design principles that distinguish a winning poster from an average one, see how to design a winning AAIC 2026 poster. The companion mechanism piece on the amyloid and tau side of AAIC biology — Aβ aggregation, NFT spatial pathology, secretase cleavage, antibody MOA panels — is amyloid-tau mechanism illustrations for AAIC 2026; together with this guide it covers both halves of the AAIC mechanism-figure problem. For the layered approach to building any cell signaling figure (including the DAP12-SYK ITAM cascade and the inflammasome arm referenced above), see creating cell signaling pathway diagrams with AI.
Create Scientific Figures Now
Describe your scientific figure in natural language — get publication-ready illustrations in minutes.
DAM is the transcriptional state microglia adopt around amyloid plaques in mouse models of AD, defined by Keren-Shaul et al. 2017 Cell (Accessed 2026-05-22) via single-cell sequencing. Key markers include TREM2, APOE, CD9, CST7, LPL, and AXL upregulated, with homeostatic markers (P2RY12, TMEM119) downregulated. M1/M2 polarization is no longer recommended for microglia — Ransohoff 2016 Nature Neuroscience (Accessed 2026-05-22) argues the dichotomy is not supported in vivo and the field has moved to a continuum model. Use homeostatic-reactive-DAM, not M1/M2, in your AAIC figure.
R47H is loss of function, not gain. The substitution in the IgV ectodomain reduces ligand binding affinity, which reduces DAP12 ITAM phosphorylation, SYK recruitment, and downstream phagocytic output — see Guerreiro 2013 NEJM (Accessed 2026-05-22) for the original AD risk identification and Song 2017 J Exp Med (Accessed 2026-05-22) for the functional characterization. For figures, the R47H arrows must be smaller than wild-type, and therapeutic angles should be framed as "restoring lost function" (TREM2 agonist antibodies) rather than "blocking pathology." Drawing R47H as gain-of-function inverts the entire mechanistic narrative.
Soluble TREM2 (sTREM2) is the proteolytically shed ectodomain of TREM2 released into CSF. Suárez-Calvet et al. 2016 EMBO Molecular Medicine (Accessed 2026-05-22) showed CSF sTREM2 rises in early symptomatic AD and may track microglial activation. For an AAIC poster, sTREM2 is widely used as a research biomarker of microglial response — appropriate to include in a biomarker panel as long as you cite the primary literature and describe it as a research-stage measure rather than a validated clinical assay. The level reflects microglial activity, not direct AD risk.
Together, with NLRP3 as a labeled step inside the microglia. The inflammasome is a microglial intracellular event, not a parallel cell type. Heneka 2013 Nature (Accessed 2026-05-22) demonstrated NLRP3 assembly inside activated microglia after Aβ engagement, with downstream caspase-1 cleavage of pro-IL-1β. The correct figure draws NLRP3 → caspase-1 → IL-1β as an internal cascade with the IL-1β arrow exiting the microglia membrane, then the TNF-α/IL-6 amplification loop external to the cell. Splitting NLRP3 into its own cell or drawing it before the microglia is engaged collapses the order of events.
The evidence is mixed and we recommend hedging this on your poster. Within the neuroimmunology community, neuroinflammation is widely understood to be a coequal driver of AD progression (see Heneka 2015 Lancet Neurology (Accessed 2026-05-22) and the NIH National Institute on Aging dossier), and multiple anti-inflammatory mechanisms — NLRP3 inhibitors, IL-6 receptor antibodies, complement inhibitors, TREM2 agonists — are in active clinical development. Whether any of these will translate into measurable cognitive benefit in patients remains an open question as of 2026. For poster framing, present anti-inflammatory targets as mechanistic candidates supported by genetic and preclinical evidence rather than as established therapeutic claims. Clinical decisions should not be made on the basis of these targets outside of clinical trials.
Disclaimer: This article is educational content focused on scientific figure design for conference posters and publications. It is not medical advice and should not be used for clinical decisions. The disease mechanisms, drug indications, and treatment protocols described here are summarized from peer-reviewed sources cited above; for clinical practice, consult primary literature, official treatment guidelines (e.g., NIA / Alzheimer's Association / ICAD), and licensed clinicians. SciFig is a scientific figure tool — it does not diagnose, treat, or advise on patient care.
Recommended next
Related SciFig resources
Go deeper with the most relevant SciFig pages for this article.