Hematopoiesis Diagrams for EHA 2026 Researchers
Draw publication-ready hematopoiesis diagrams for EHA 2026 posters: classical tree, bone marrow niche, JAK/STAT pathway, AML block, and AI prompts.
You start with the hematopoietic stem cell at the top, branch down through multipotent progenitor, then myeloid and lymphoid commitment, and somewhere around the granulocyte-monocyte progenitor your figure stops making biological sense. GPT image insists on drawing the megakaryocyte branching off from CLP. Midjourney inverts the myeloid-lymphoid split. A bright label appears reading "CD34+ E-progenitor" — a cell type that does not exist. You re-roll, and the next version puts erythrocytes under the lymphoid lineage. After 40 minutes you give up and trace a textbook tree by hand in Illustrator.
This is the moment that derails most stem cell and hematologic malignancy posters at EHA. The hematopoiesis tree is the most foundational figure in hematology — the orientation map every reviewer expects before they engage with your science — and the single figure where generic AI image models fail most consistently because the topology is unforgiving. One inverted branch and the entire lineage reasoning collapses. This guide walks through the classical hematopoiesis tree from HSC to 11 mature lineages, the bone marrow niche architecture, the signaling pathways that govern self-renewal versus differentiation, the disease states where hematopoiesis breaks down, and the AI-assisted workflow that gets the topology right on draft one.
Transparency note: Illustrations in this article were generated with SciFig AI and reviewed by the author for scientific accuracy. Cited claims link to peer-reviewed sources, NIH educational materials, and the ASH Education Book.
1. Why Hematopoiesis Diagrams Anchor Almost Every EHA Poster
Walk through any EHA poster session and you will see a simplified hematopoiesis tree in the introduction panel of nearly every stem cell, leukemia, lymphoma, myeloma, or transplantation poster. The reason is conceptual: hematology operates on a shared mental model of where each cell type comes from, and your study is implicitly a claim about which point in that lineage you are intervening on. If you cannot show the tree clearly, you cannot show your study clearly.
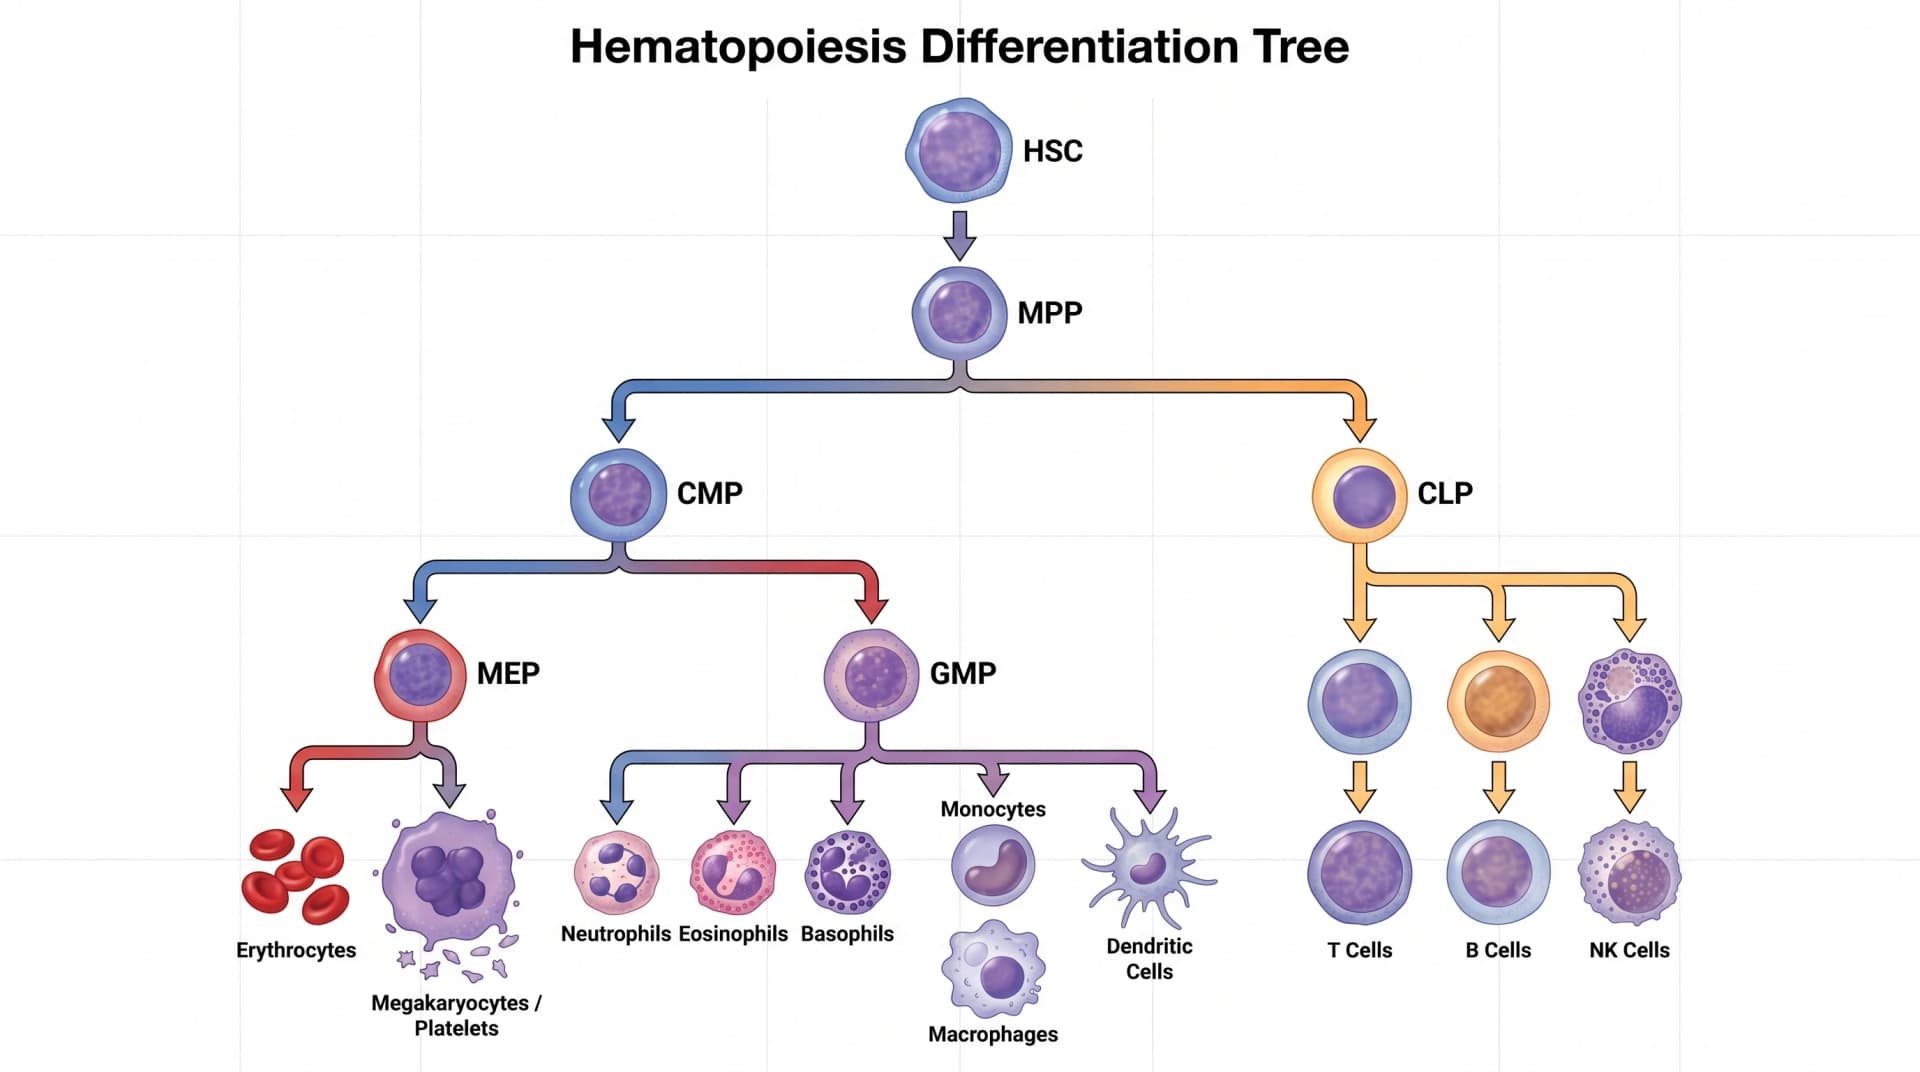
2. The Classical Hematopoiesis Tree: From HSC to 11 Mature Lineages
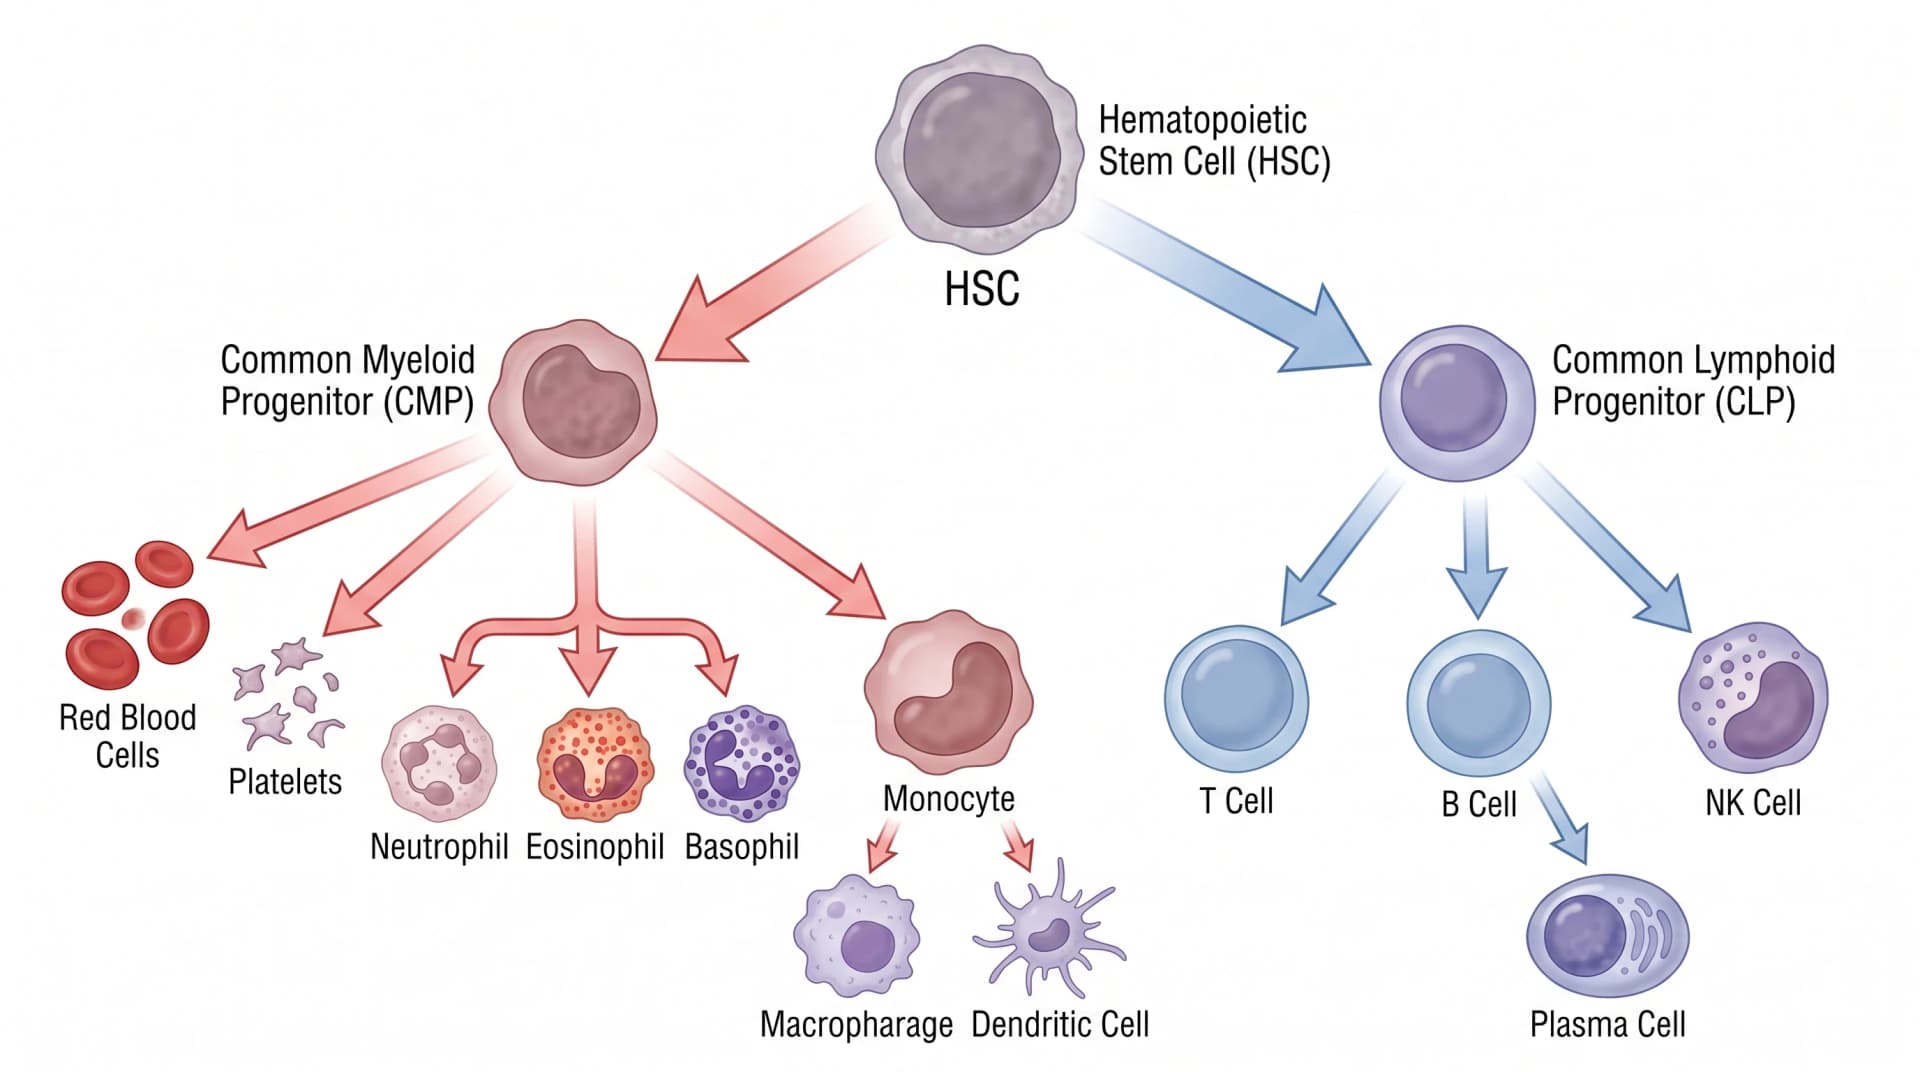
The classical hematopoiesis tree starts with the hematopoietic stem cell (HSC) — a long-term self-renewing cell that sits quietly in the bone marrow niche. The HSC gives rise to a multipotent progenitor (MPP), which loses self-renewal capacity but retains broad lineage potential. From MPP, the tree bifurcates: the common myeloid progenitor (CMP) gives rise to all myeloid lineages; the common lymphoid progenitor (CLP) gives rise to all lymphoid lineages. The 11 mature lineages, by convention, are: erythrocytes, megakaryocytes (platelets), neutrophils, eosinophils, basophils, monocytes/macrophages, dendritic cells, mast cells, NK cells, B cells, and T cells.
The visual literacy bar is high because every reviewer in the hall has seen this tree a thousand times. Yours has to either match the canonical topology with publication-grade clarity, or — if your study addresses a specific lineage decision point — be annotated to highlight exactly where in the tree your intervention lives.
3. Myeloid vs Lymphoid: The First Major Branching Point
The CMP-CLP split from MPP is the most consequential branching decision in hematopoiesis, and it is also where generic AI image models most often invert the topology. Get this wrong and every downstream lineage is mislabeled.
The split is regulated by competing transcription factors — PU.1 favors myeloid commitment, while Ikaros and E2A favor lymphoid commitment. The two daughter populations have fundamentally different downstream fates: CMP gives rise to red cells, platelets, granulocytes, monocytes, mast cells, and most dendritic cells; CLP gives rise to T cells, B cells, NK cells, and plasmacytoid dendritic cells. A figure that mixes these is not a stylistic choice; it is a topology error that an experienced reviewer will spot before reading your title.
For posters addressing acute myeloid leukemia, the myeloid branch needs to be expanded with intermediate progenitors (CMP → GMP → myeloblast → granulocyte/monocyte). For posters addressing T-cell or B-cell malignancies, the lymphoid branch needs the thymic and bone marrow lymphoid trajectories drawn separately.
4. Key Intermediate Progenitors: CMP, GMP, MEP, CLP
Below MPP, the four most important intermediate progenitors are CMP, GMP, MEP, and CLP. These are the "named gates" in hematopoiesis — each is defined by a specific combination of surface markers (most commonly CD34, CD38, CD45RA, CD123, CD135/Flt3) and downstream lineage potential.
- CMP (common myeloid progenitor) — CD34+CD38+CD123+CD45RA−. Gives rise to GMP and MEP.
- GMP (granulocyte-monocyte progenitor) — CD34+CD38+CD123+CD45RA+. Gives rise to neutrophils, eosinophils, basophils, monocytes, mast cells, and conventional dendritic cells.
- MEP (megakaryocyte-erythroid progenitor) — CD34+CD38+CD123lowCD45RA−. Gives rise to erythrocytes and megakaryocytes/platelets.
- CLP (common lymphoid progenitor) — CD34+CD38+CD7+CD10+CD45RA+. Gives rise to T cells, B cells, NK cells, and plasmacytoid dendritic cells.
A precise figure annotates each intermediate with its surface marker phenotype and downstream lineages. Sloppy figures — and many AI-generated drafts — invent intermediate names that do not exist (e.g., "CD34+ E-progenitor" or "early myeloid blast") that signal to reviewers you do not know the canonical taxonomy.
5. The Bone Marrow Microenvironment: Niche Anatomy for Stem Cell Posters
The three niche compartments your figure should distinguish:
- Vascular niche — Near sinusoidal endothelium. Provides oxygen and signaling cues for active HSCs in cycle.
- Perivascular niche — Mesenchymal stromal cells (MSCs) and CXCL12-abundant reticular (CAR) cells around vessels. The major source of CXCL12 (SDF-1) that anchors HSCs.
- Osteoblastic niche — Near the bone surface. Historically associated with HSC quiescence, although the modern model emphasizes vascular/perivascular more than the older "endosteal" view.
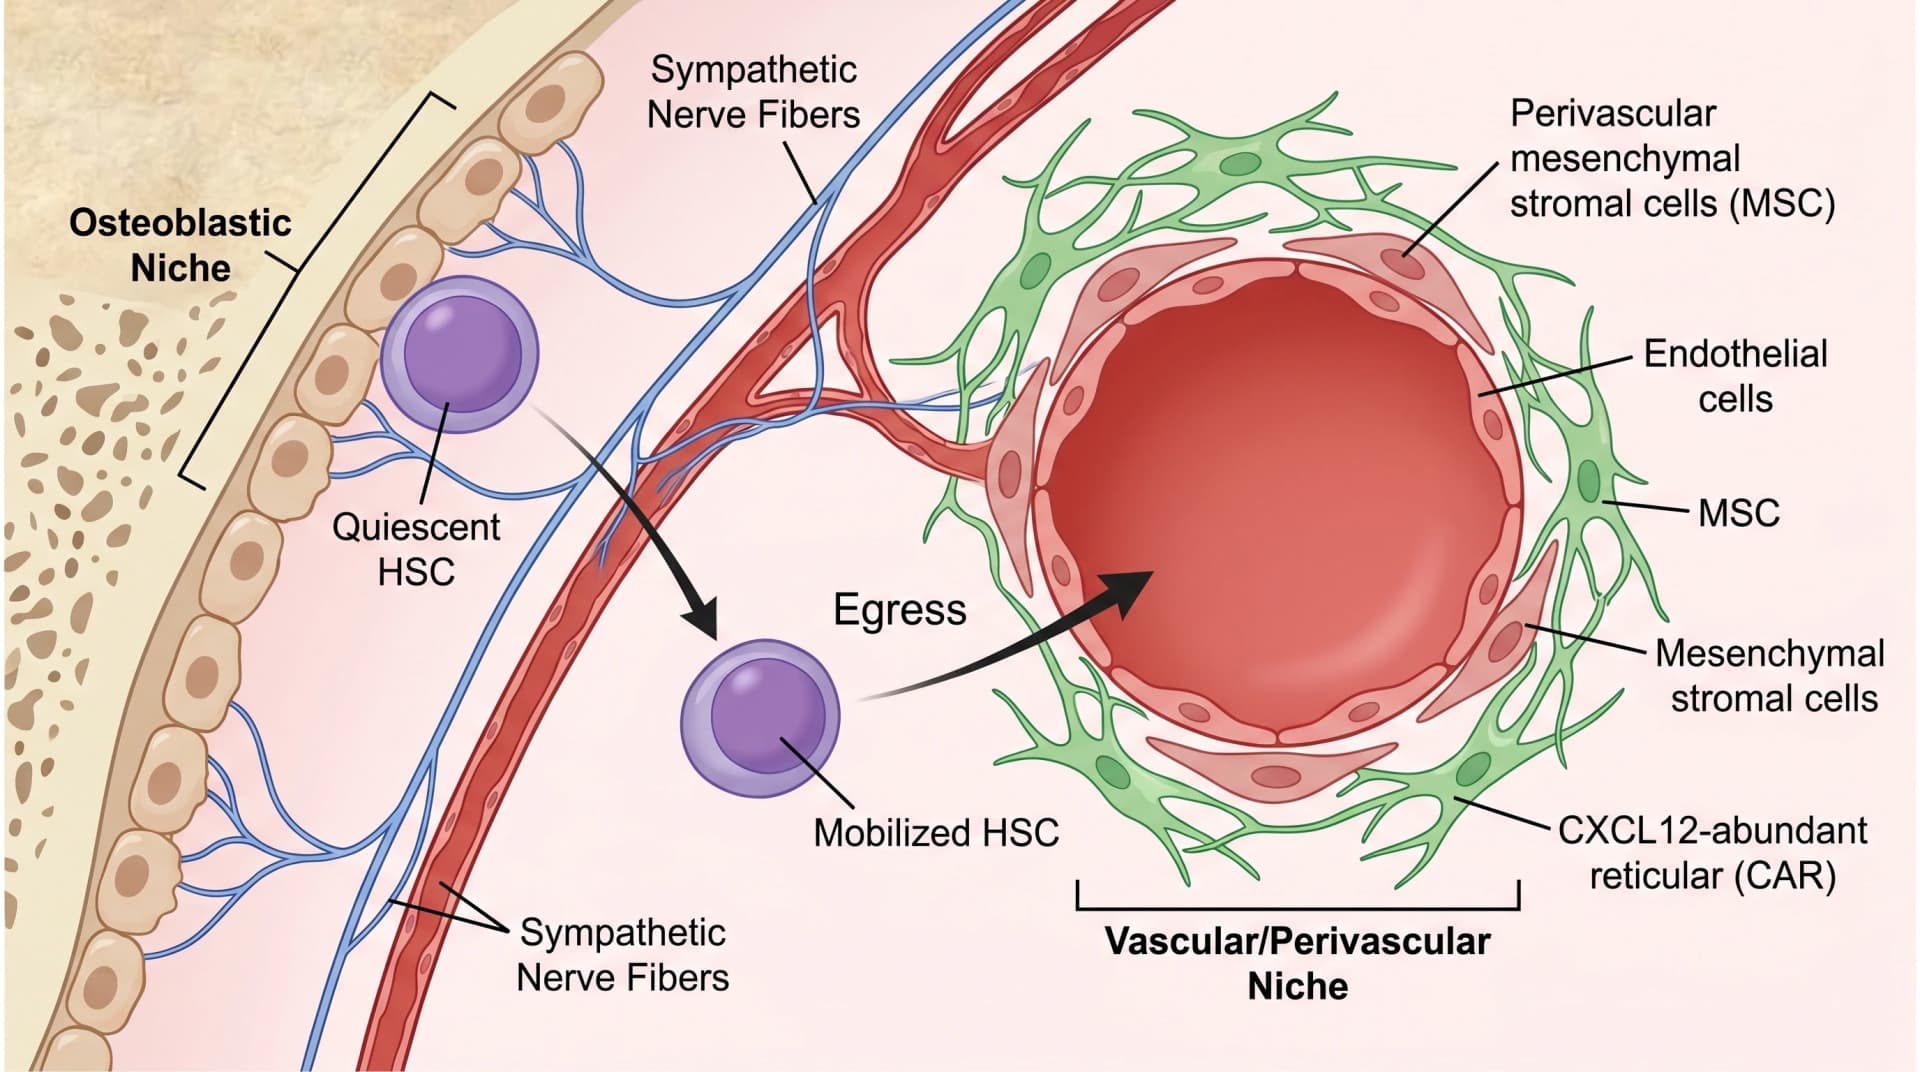
Sympathetic nerve fibers add a fourth regulatory layer by controlling circadian HSC egress into the bloodstream. For posters addressing mobilization (G-CSF, plerixafor) or trafficking, this is essential to show. For posters addressing AML or MDS, the niche figure should also include the leukemic stem cell perspective — how malignant HSCs co-opt the niche and outcompete normal HSCs.
6. Signaling Pathways Controlling Hematopoiesis: JAK/STAT, Wnt, Notch, SCF-c-Kit
Four signaling pathways dominate hematopoietic regulation, and each shows up frequently in EHA posters either as a normal regulator or as a disease driver.
- SCF-c-Kit — Stem cell factor binding the c-Kit receptor (CD117) drives HSC survival and early lineage decisions. KIT mutations are central to systemic mastocytosis.
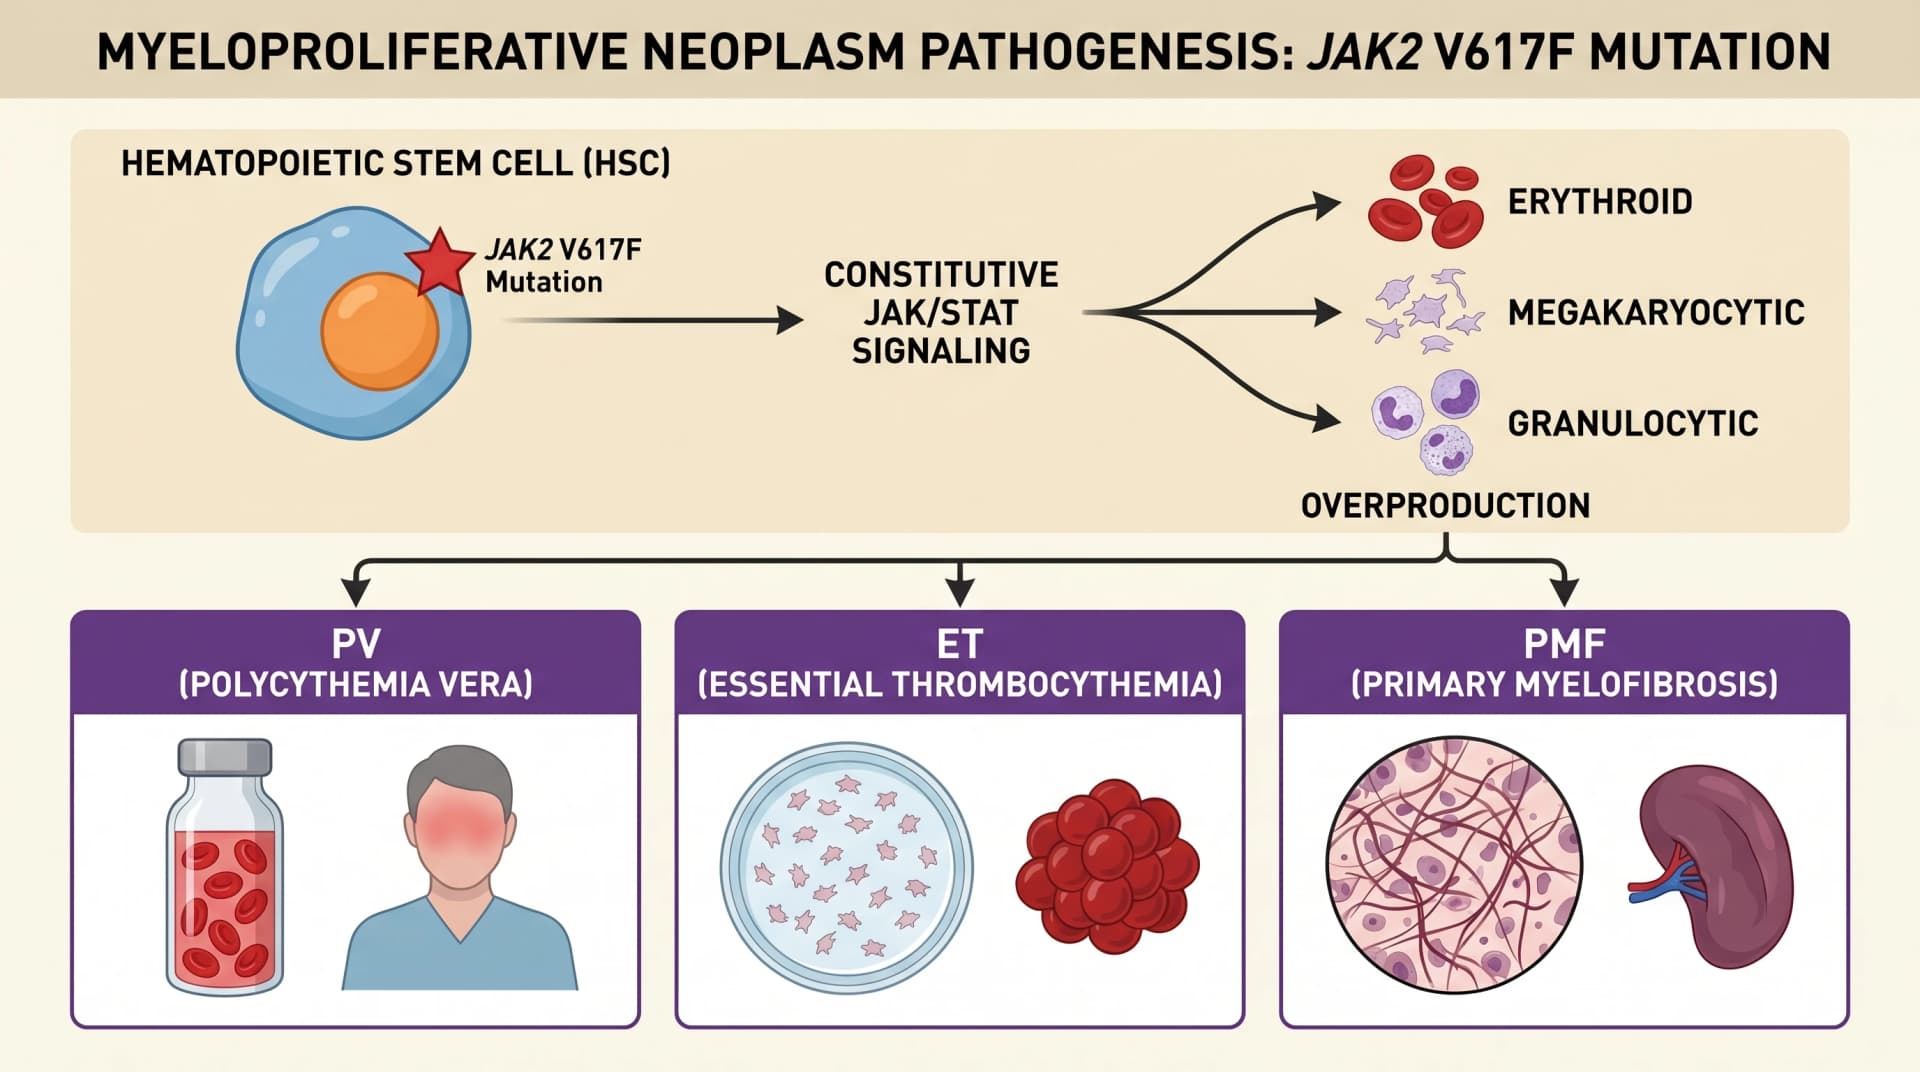
- Thrombopoietin (TPO)-MPL → JAK/STAT — TPO binding MPL activates JAK2, which phosphorylates STAT3/STAT5; the phosphorylated STAT dimers translocate to the nucleus and activate transcription of self-renewal and survival genes. JAK2 V617F mutation drives myeloproliferative neoplasms.
- Wnt/β-catenin — Canonical Wnt signaling supports HSC self-renewal; aberrant activation contributes to leukemic transformation.
- Notch — Notch-Delta interactions drive T-cell lineage commitment in the thymus; aberrant Notch signaling drives T-ALL.
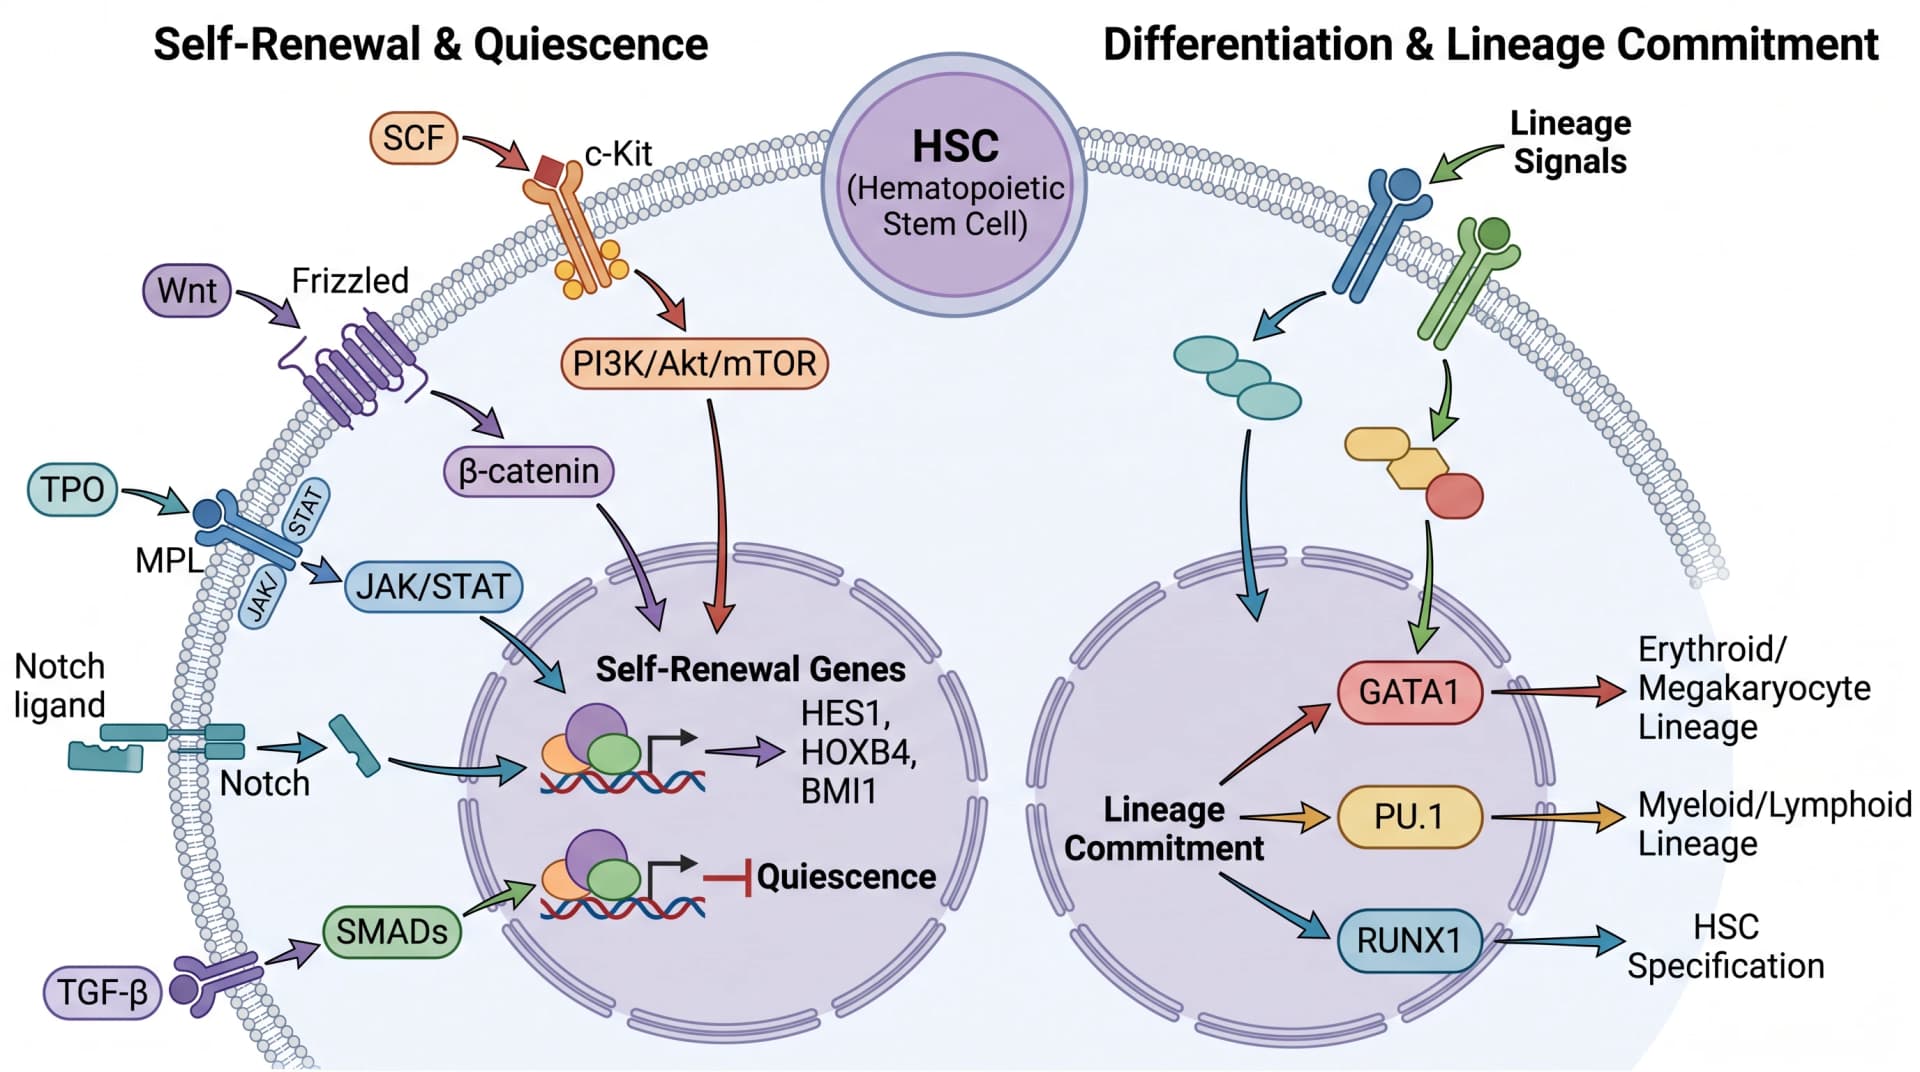
The JAK/STAT cascade is where AI image models most often invert the direction of signal flow. The canonical sequence is: cytokine binds receptor → receptor-associated JAK kinases trans-phosphorylate → JAKs phosphorylate STAT tyrosine residues → phosphorylated STATs dimerize via SH2 domain interactions → dimer translocates to nucleus → transcription. Generic AI generators frequently draw STAT entering the nucleus first and then dimerizing, which is the wrong order — a clear sign to a reviewer that the figure was generated without molecular biology supervision.
7. Disrupted Hematopoiesis in Disease: AML, MDS, MPN, Bone Marrow Failure
Most EHA disease-focused posters need a figure showing where hematopoiesis breaks down in their specific disease. Four high-frequency examples cover most of the program.
| Disease | Hematopoiesis Defect | Primary Driver Mutations | Where in the Lineage |
|---|---|---|---|
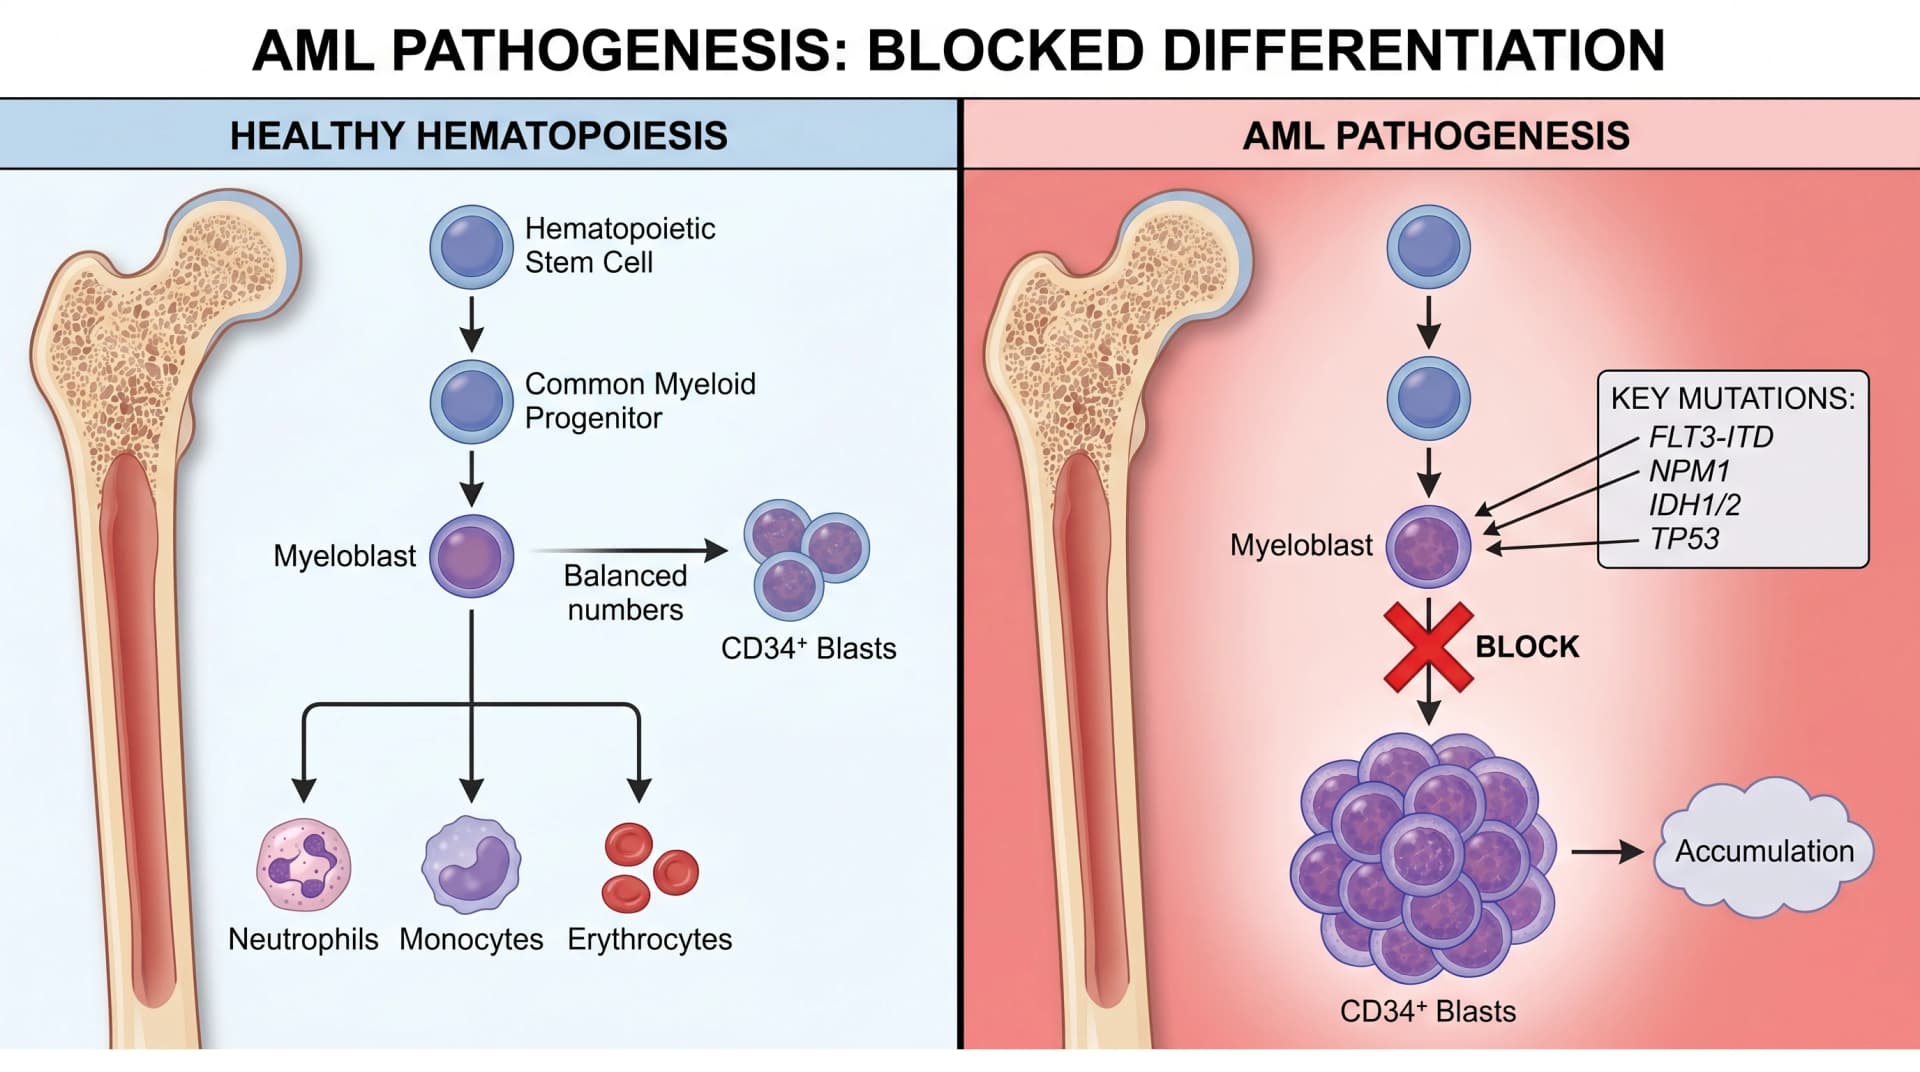
| AML | Differentiation block at myeloblast | FLT3-ITD, NPM1, IDH1/2, TP53 | Myeloid commitment downstream of CMP/GMP |
| MDS | Ineffective hematopoiesis + cytopenias | DNMT3A, TET2, SF3B1, ASXL1 | HSC/MPP with multi-lineage involvement |
| MPN | Overproduction of mature myeloid lineages | JAK2 V617F (~95% PV), CALR, MPL | HSC with JAK/STAT hyperactivation |
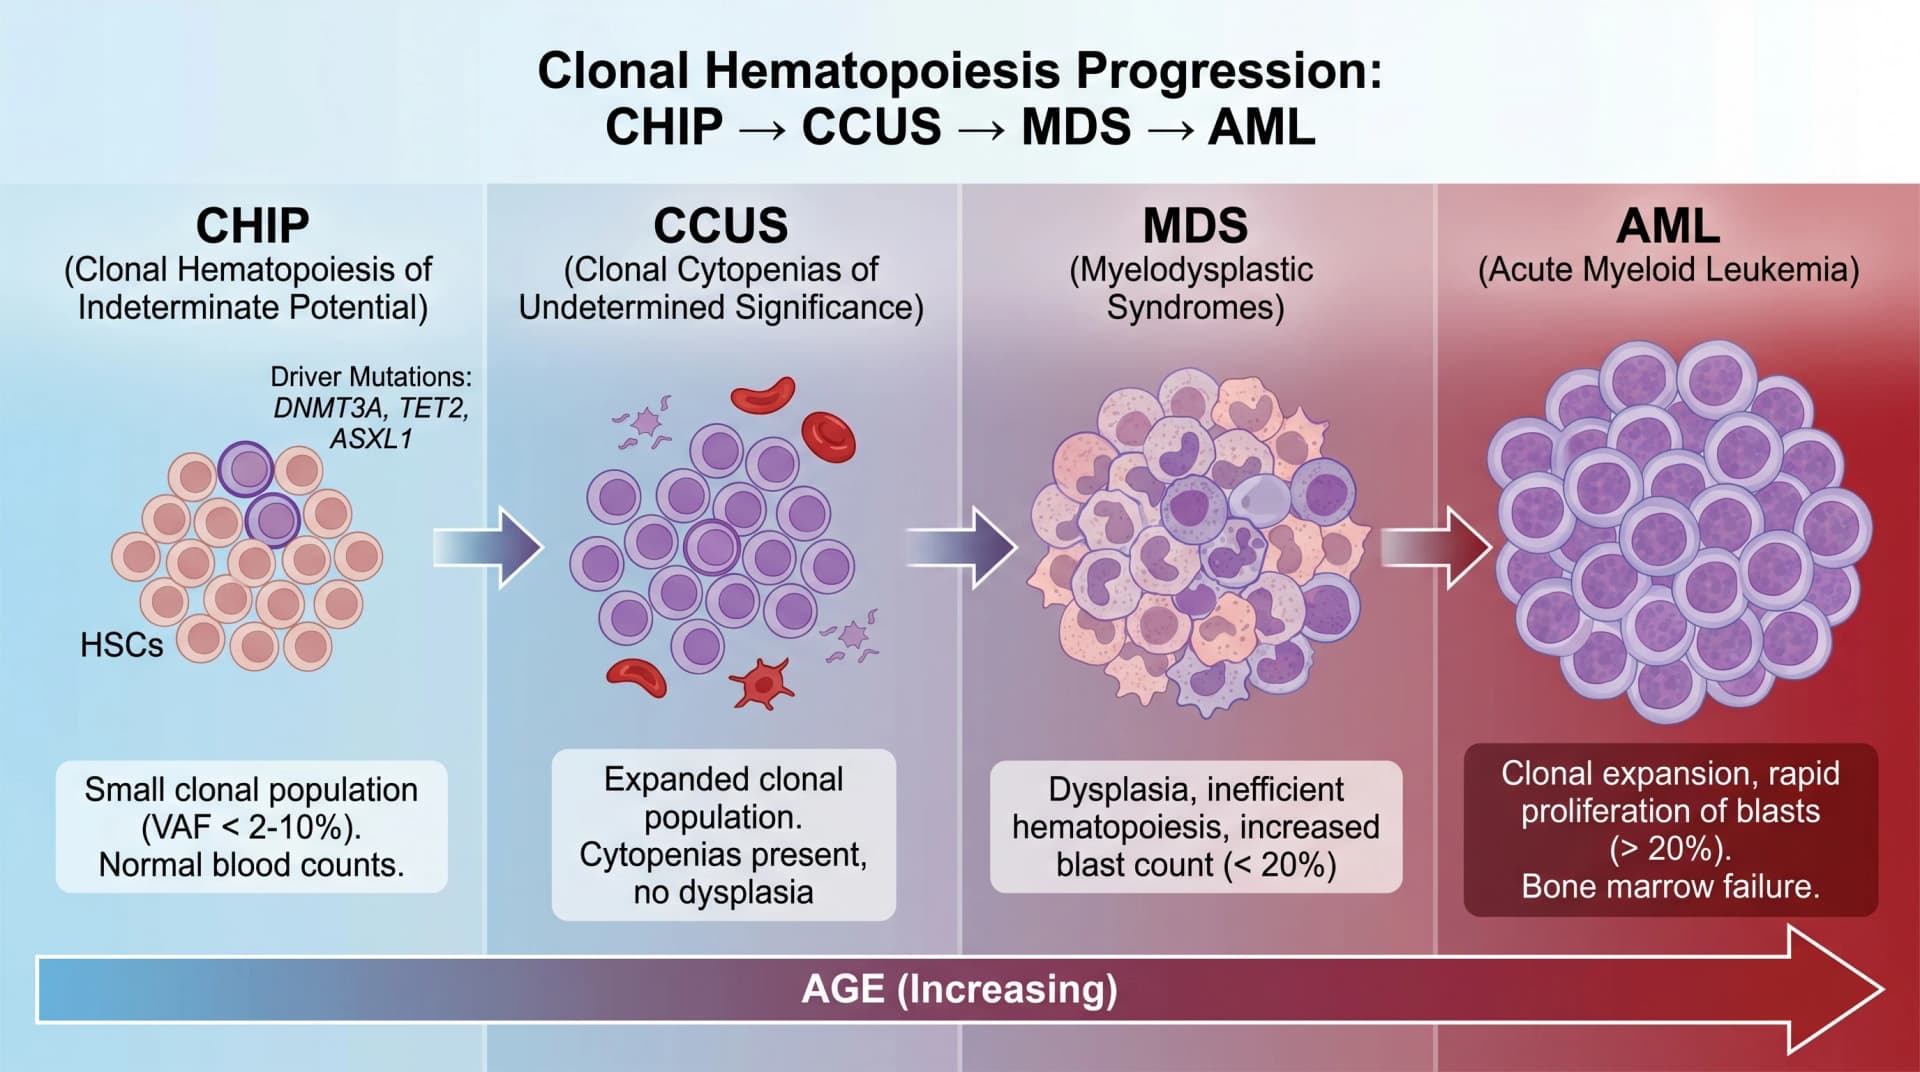
| CHIP/CCUS | Clonal expansion without overt disease | DNMT3A, TET2, ASXL1 | HSC; precursor state to MDS/AML |
| Aplastic anemia | HSC depletion → empty marrow | Often acquired/autoimmune (PNH overlap) | HSC pool collapse |
Tip
8. AI-Powered Hematopoiesis Diagrams: SciFig Workflow for Stem Cell Posters
Here is the part where the hematopoiesis tree, the niche figure, and the disease lineage diagrams go from "blocking your week" to "drafted before lunch" — and it is also where you find out why generic AI is structurally inadequate for this specific kind of figure.
Here is the path. Copy this prompt verbatim into SciFig's Text-to-Figure tool to start the classical hematopoiesis tree:
Comprehensive hematopoiesis differentiation tree starting from
hematopoietic stem cell (HSC) at top, branching to multipotent
progenitor (MPP), then bifurcating into common myeloid progenitor
(CMP) on the left and common lymphoid progenitor (CLP) on the right.
CMP gives rise to MEP (erythrocytes, megakaryocytes/platelets) and
GMP (neutrophils, eosinophils, basophils, monocytes/macrophages,
dendritic cells, mast cells). CLP gives rise to T cells, B cells,
NK cells. Vertical layout, color-coded by lineage, accurate cell
morphology, publication-ready style.
For the bone marrow niche, the JAK/STAT pathway, the AML differentiation block, the MPN JAK2 figure, and the CHIP evolution timeline — copy the prompts in Section 9 below.
See AI Scientific Figure Generation in Action
Watch how researchers create publication-ready scientific figures from text descriptions.
Explore the Tool9. Free Trial CTA + Related Reading: 5 Copy-Paste Hematopoiesis Prompts
The five remaining SciFig prompts for the figures shown in this article. Copy any of them directly into Text-to-Figure:
Cross-section of bone marrow microenvironment showing HSC niche:
vascular niche near sinusoids with endothelial cells, perivascular
niche with mesenchymal stromal cells (MSC) and CXCL12-abundant
reticular (CAR) cells, osteoblastic niche near bone surface,
sympathetic nerve fibers regulating egress. HSC quiescence vs
mobilization shown.
HSC self-renewal vs differentiation signaling: SCF-c-Kit, Wnt/β-catenin,
Notch, JAK/STAT (TPO-MPL), TGF-β quiescence. Show cell membrane,
cytoplasmic cascade, nuclear transcription factors (GATA1, PU.1,
RUNX1 lineage commitment). Annotate signaling direction with arrows.
AML pathogenesis: normal myeloid differentiation arrow blocked at
myeloblast stage. Show accumulation of CD34+ blasts in bone marrow,
compared to healthy hematopoiesis. Key mutations annotated:
FLT3-ITD, NPM1, IDH1/2, TP53.
Myeloproliferative neoplasm pathogenesis: JAK2 V617F gain-of-function
mutation in HSC produces constitutive JAK/STAT signaling, leading to
overproduction of erythroid, megakaryocytic, and granulocytic
lineages. Show resulting PV (polycythemia vera), ET (essential
thrombocythemia), and PMF (primary myelofibrosis) phenotypes.
Clonal hematopoiesis progression: CHIP (clonal hematopoiesis of
indeterminate potential) → CCUS (clonal cytopenias of undetermined
significance) → MDS → AML. Show clonal expansion of mutated HSC
over age, with DNMT3A, TET2, ASXL1 driver mutations annotated.
Horizontal timeline format.
Create Scientific Figures Now
Describe your scientific figure in natural language — get publication-ready illustrations in minutes.
Try Free