Your EHA 2026 abstract was accepted. Complete guide to EHA 2026 poster guidelines, four presentation tiers, and visuals that get you noticed in Stockholm.
SciFig Team
Scientific Illustration Experts
Your inbox pinged on April 24. Subject line: "EHA2026 — Abstract Decision Notification." You scrolled past the disclosures, the platform link, the scientific committee thanks, and there it was — your work was accepted. Then came the second thought: you have seven weeks to turn a 3,500-character abstract into a poster that competes with roughly two thousand others in Stockholm. Where do you start?
This is a practical guide for hematologists, translational researchers, and clinical trainees who received an EHA 2026 acceptance and now have to translate it into a poster that earns its session slot. We cover the format rules, the four presentation tiers, the seven-week preparation window, and — most critically — the visual anatomy that distinguishes a poster that gets read from one that gets walked past.
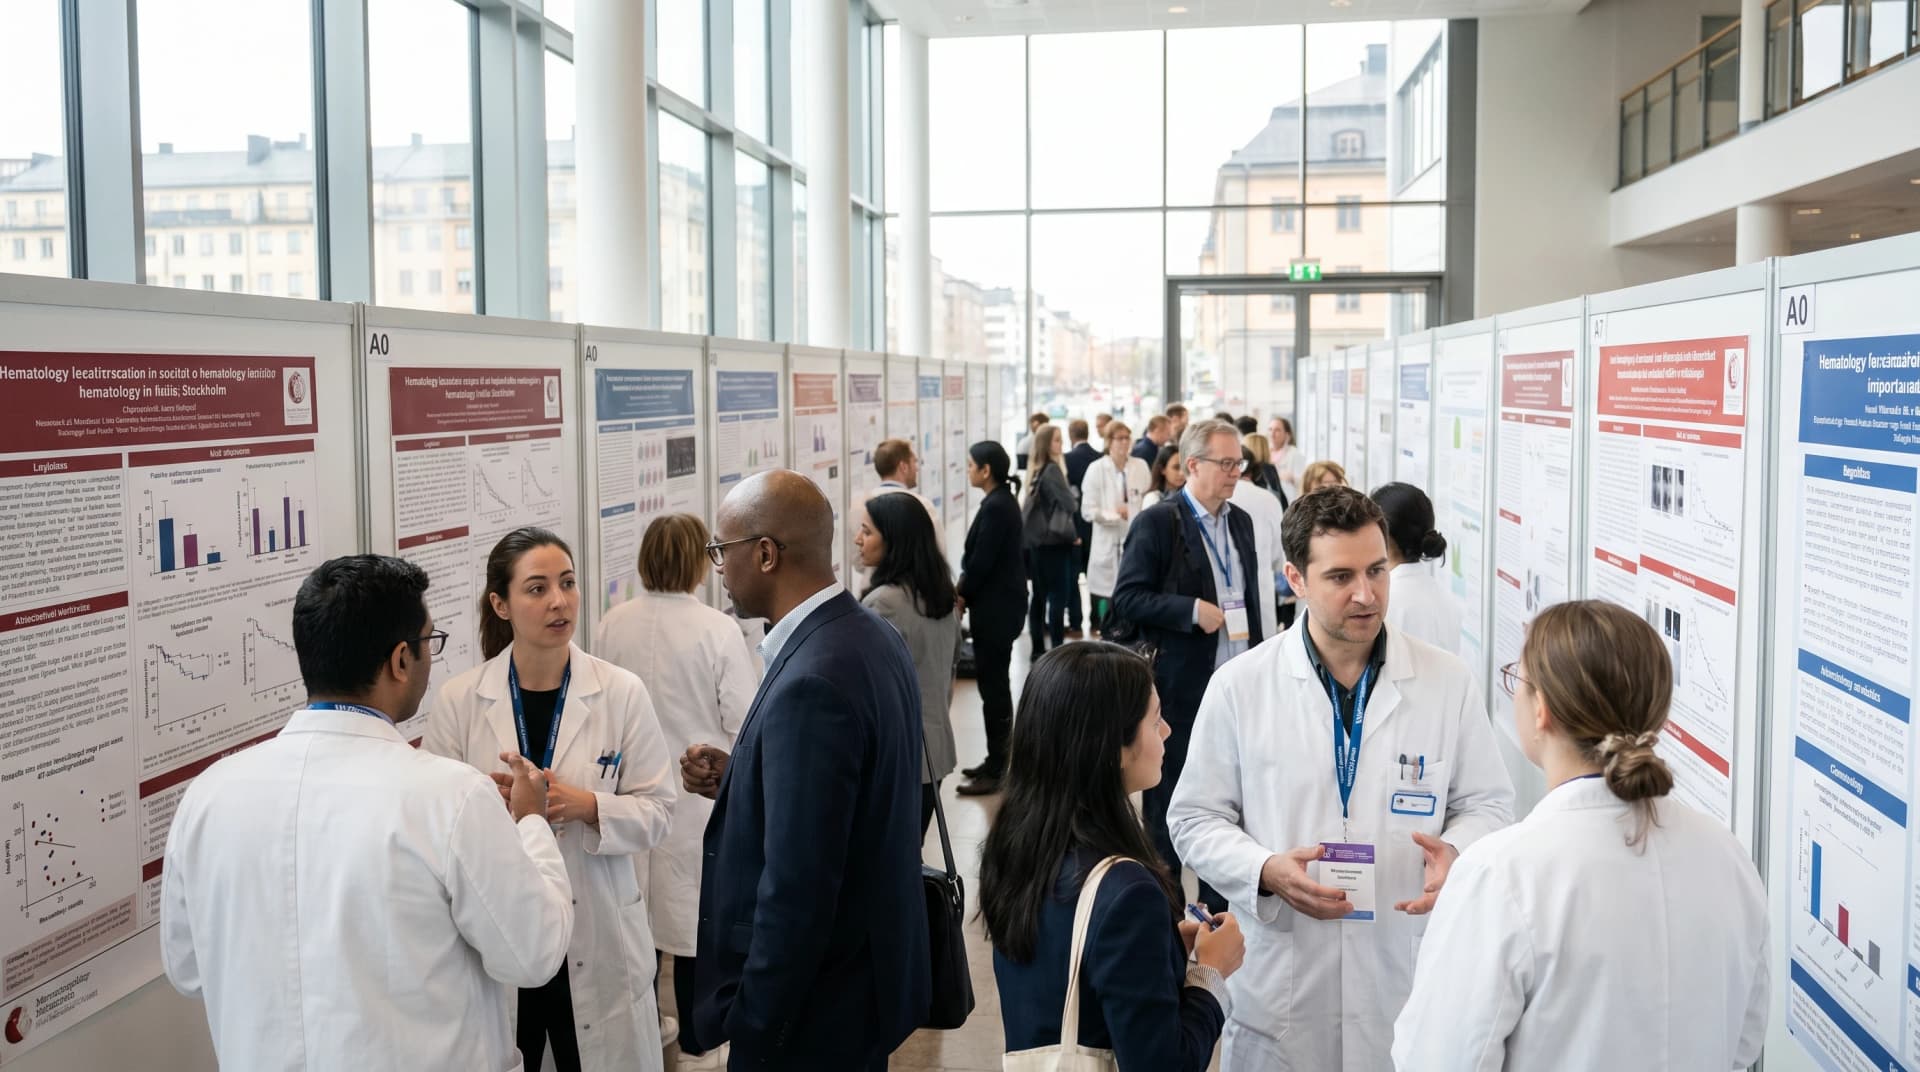
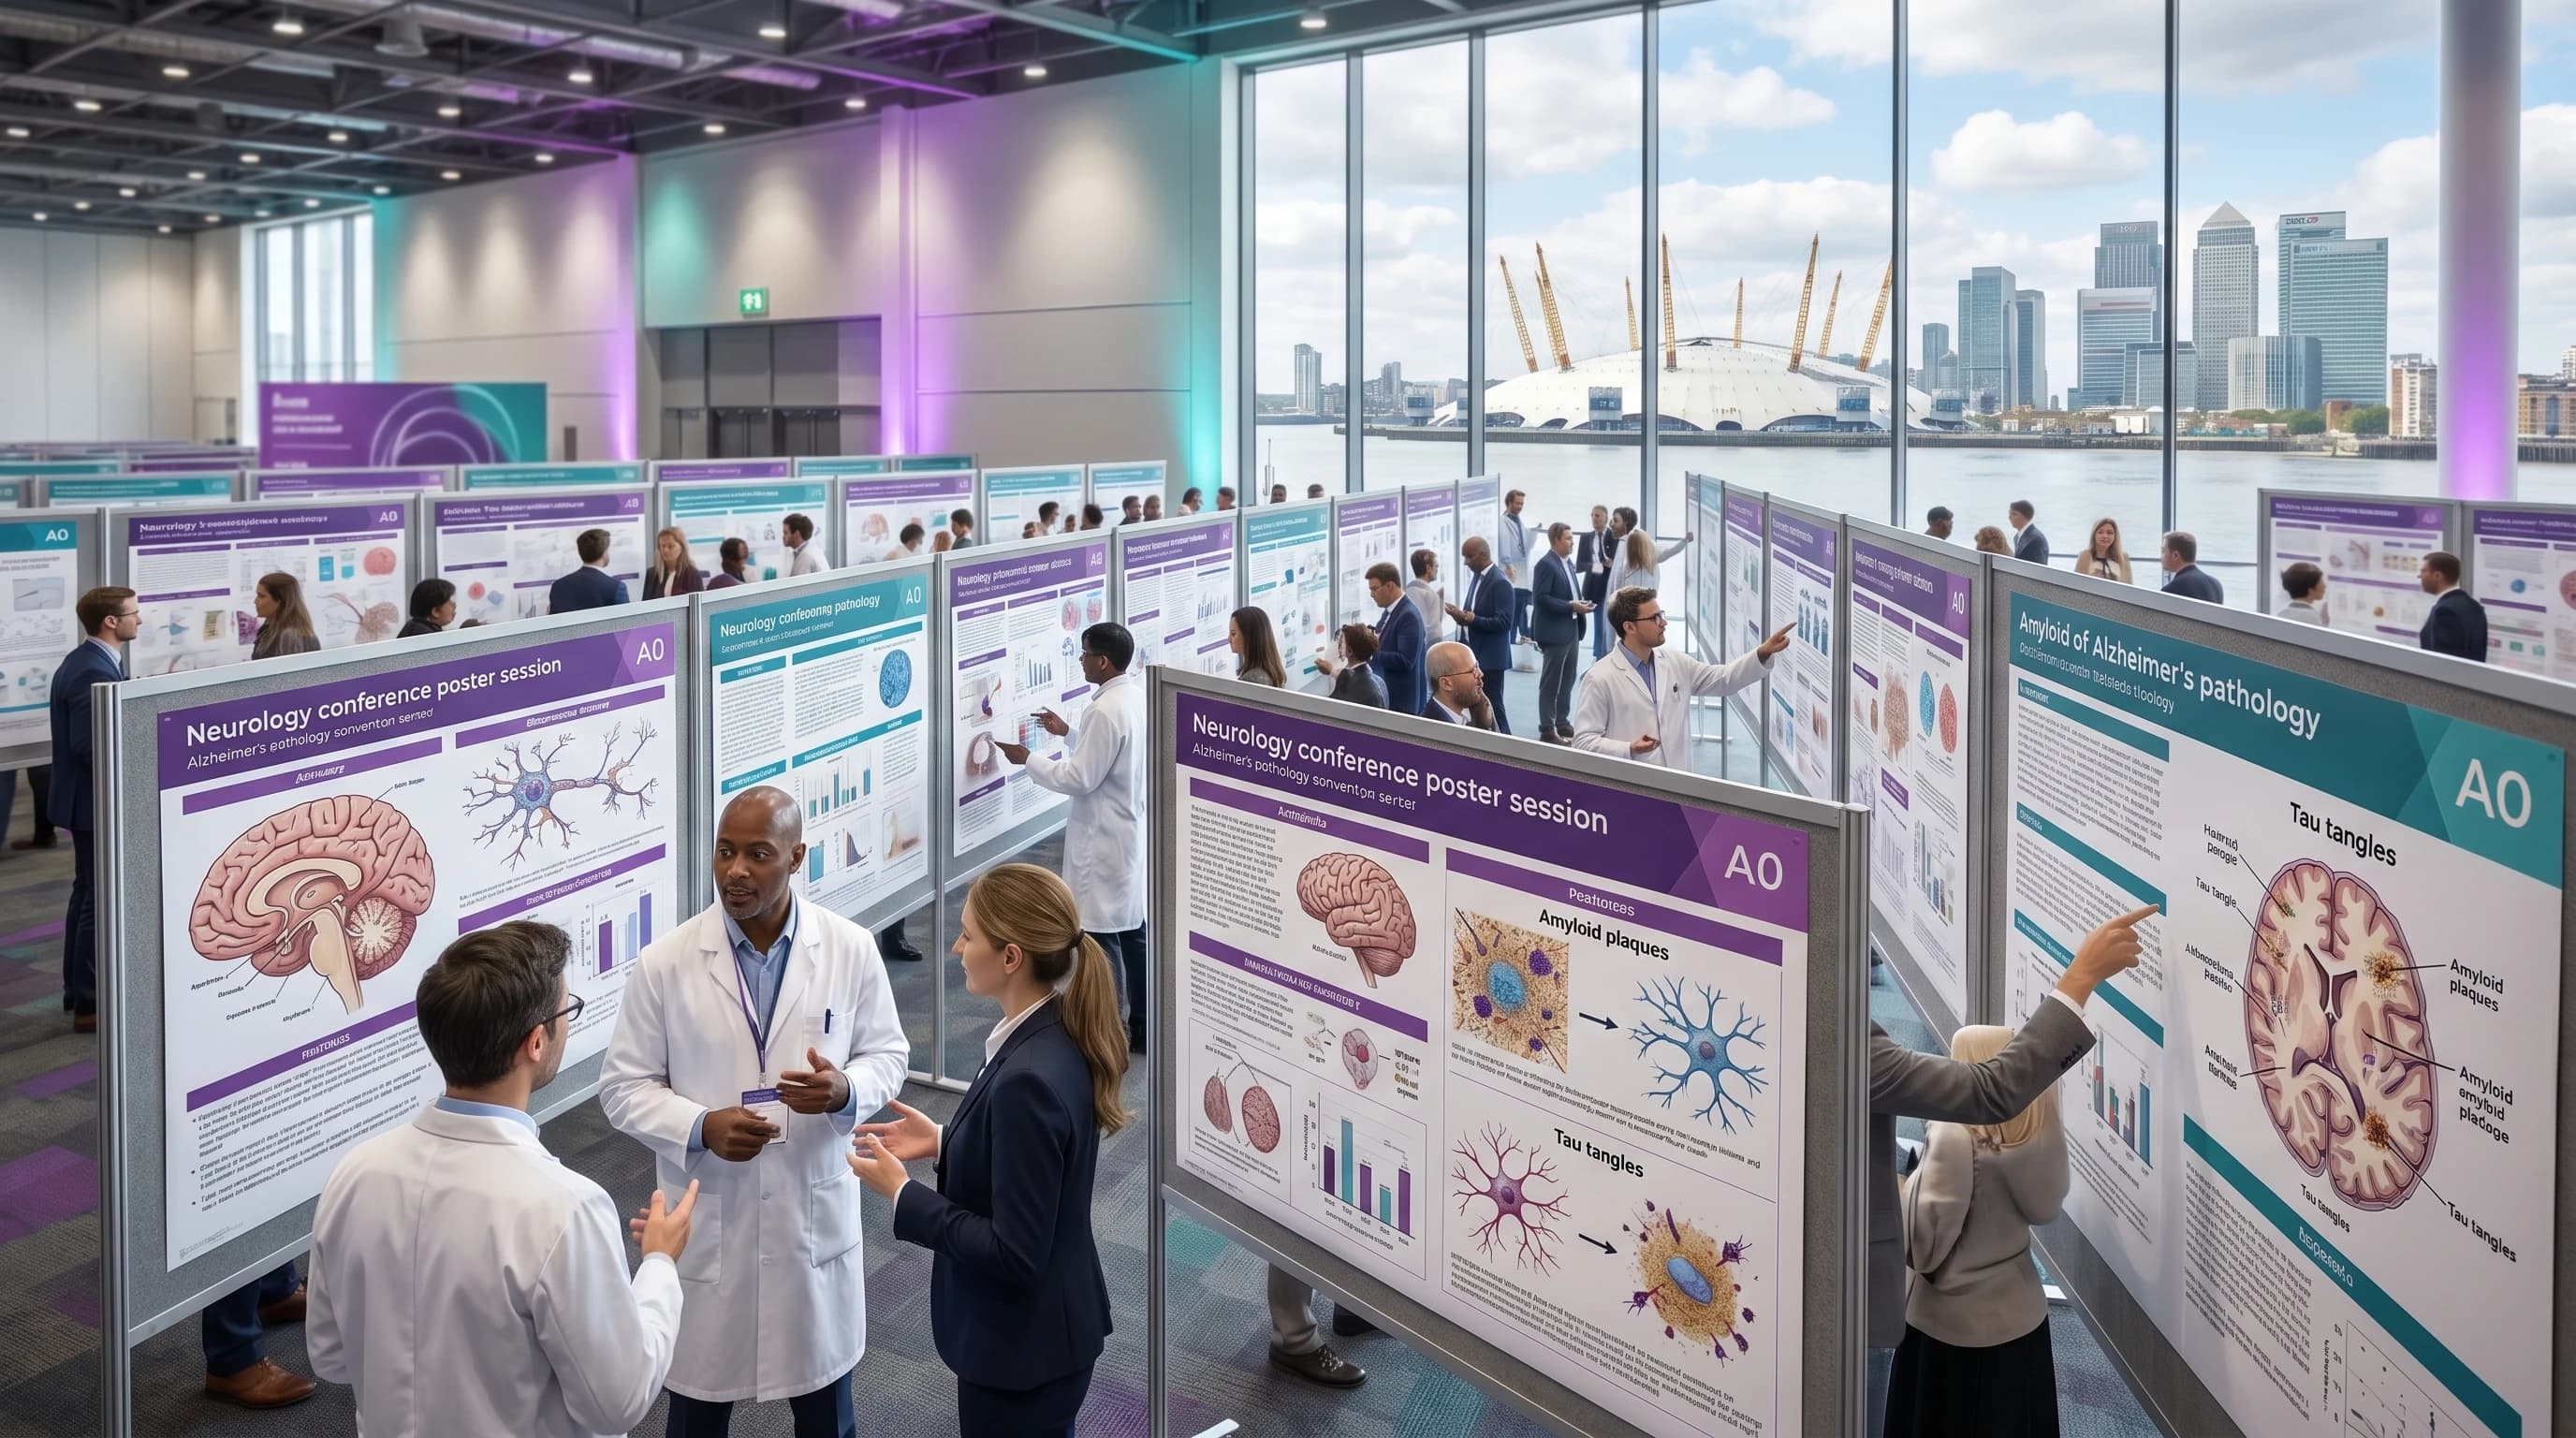
EHA 2026 hematology poster session in Stockholm: A0 posters with CAR-T and leukemia diagrams (Figure generated with SciFig)
Transparency note: Illustrations in this article were generated with SciFig AI and reviewed by the author for scientific accuracy. Cited claims link to peer-reviewed sources and official EHA materials.
1. EHA 2026 at a Glance: Dates, Venue, and the Four Acceptance Tiers
The European Hematology Association Congress 2026 returns to Northern Europe at Stockholmsmässan, Stockholm, from 11–14 June 2026 (official EHA2026 details). This year's congress will host approximately 15,000–20,000 hematology professionals across two poster sessions, three full days of scientific programming, and a parallel virtual track that keeps content accessible until 15 October 2026. All accepted abstracts publish as a supplement to HemaSphere, EHA's official open-access journal — your work will be citable from the moment you present.
EHA 2026 venue overview: aerial view of Stockholm International Fairs glass facade with attendees in lanyards, Sweden blue-yellow accents (Figure generated with SciFig)
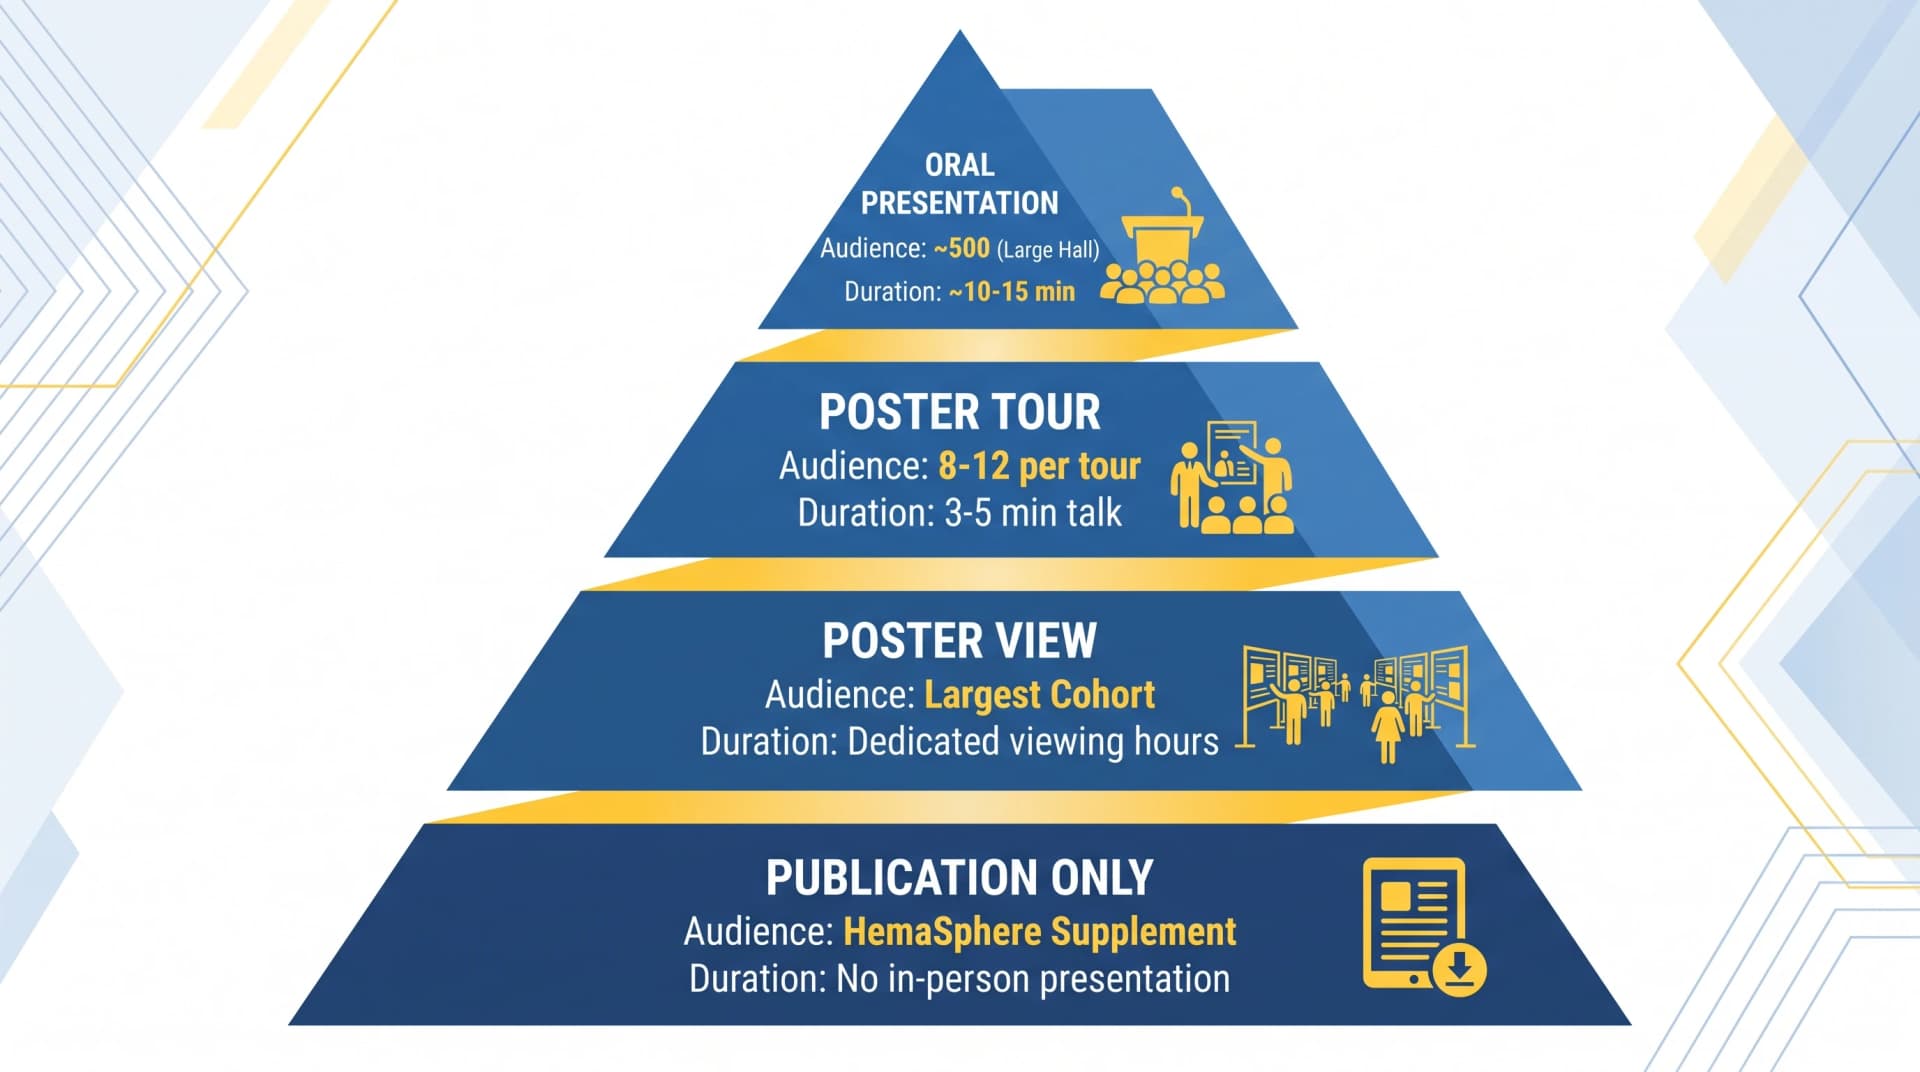
The acceptance pyramid is hierarchical. Of the abstracts submitted by the January 15 deadline, the Scientific Programme Committee allocates a small fraction to Oral Presentation, more to Poster Tour, more still to Poster View, and the remainder to Publication Only. Knowing which tier you landed in shapes every preparation decision that follows.
2. EHA 2026 Submission Timeline: Critical Deadlines from Acceptance to Stockholm
Here is what is behind you and what is ahead.
EHA 2026 horizontal timeline: 6 milestones from Feb abstract submission → Mar notification → poster design phase → final submission → Jun 11-14 conference (Figure generated with SciFig)
Date
Milestone
1 January 2026
Abstract submission and travel grant applications opened
1 March 2026
Abstract submission deadline
24 April 2026
Regular abstract acceptance notifications sent ← you are here
30 April – 7 May 2026
Late-breaking abstract submission window
1 May 2026
Withdrawal deadline (regular abstracts)
12 May 2026
Accepted regular abstracts available online on the EHA Library
22 May 2026
Late-breaking abstract notifications sent
2 June 2026
Accepted late-breaking abstracts available online
11–14 June 2026
EHA2026 Congress, Stockholm
17 June – 15 October 2026
On-demand content available on Congress platform
If your regular abstract was accepted on 24 April, you have 49 days until Congress. If your late-breaking acceptance arrives 22 May, that window collapses to 20 days. Plan accordingly.
3. Your Submitted Abstract Format (Quick Reference)
The submission rules are behind you, but they shape the poster you are now building. Your abstract had:
A title up to 200 characters
A body up to 3,500 characters across Background, Aims, Methods, Results, and Summary/Conclusion
One image at 100–500 pixels per dimension, 1 KB to 1 MB
A primary topic chosen from EHA's 40 official categories — from acute myeloid leukemia biology to gene therapy and cellular immunotherapy
That image you embedded? It set expectations for what your poster will visualize. The five-section structure? It dictates the architecture your poster should mirror. Reviewers — and later, poster session walkers — will look for the same logical flow on your A0 sheet that they read in your abstract.
4. From Abstract Acceptance to EHA Poster: Your 7-Week Preparation Window
Forty-nine days sounds generous. It isn't. Subtract international travel logistics, your day job, weekend obligations, and the four to six business days a print shop needs to produce and ship a poster, and the useful preparation window is closer to four working weeks.
A realistic schedule:
Week 1 (immediately after acceptance) — Decide your tier strategy. Map the five sections of your abstract to four to five poster panels. Sketch the hero figure on paper or a whiteboard, before any software is opened.
Week 2 — Generate visual assets. This is where modern AI illustration tools earn their keep — what would have taken a week with Adobe Illustrator can compress to one focused day of prompting and iteration.
Week 3 — Layout, typography, peer review. Send the draft to two colleagues outside your immediate team. They will catch the unlabelled axis and the ambiguous abbreviation you have read so many times you no longer see them.
Week 4 — Final polish, print proof, shipping. Many delegates use a Stockholm-based print partner to avoid carrying poster tubes through airports — book early; June is high tourist season and print queues lengthen.
Late-breaking authors have half this timeline, which means the visual generation stage has to compress to hours, not days. We will return to this below.
5. The Four Presentation Formats Explained: Oral, Poster Tour, Poster View, and Publication Only
EHA places accepted abstracts into one of four tiers (defined in the official abstract submission guidelines), each with distinct expectations and audiences:
Oral Presentation — The top tier. Selected by the Scientific Programme Committee based on peer review scores. Typically 10–12 minutes plus discussion, in a session hall holding several hundred delegates. Slides matter as much as the underlying science. Your supporting poster, if you also have one, reaches a smaller audience but functions as your "office hours" after the talk for delegates who want to dig deeper.
Poster Tour Presentation — A guided tour where 8–12 delegates walk between three to five posters with a session chair who asks each presenter to summarize in 3–5 minutes. Your poster has to work two ways at once: as a standalone artifact for tour members reading ahead, and as a presentation companion you can walk through aloud. Expect pointed questions; expect to defend your methodology in real time.
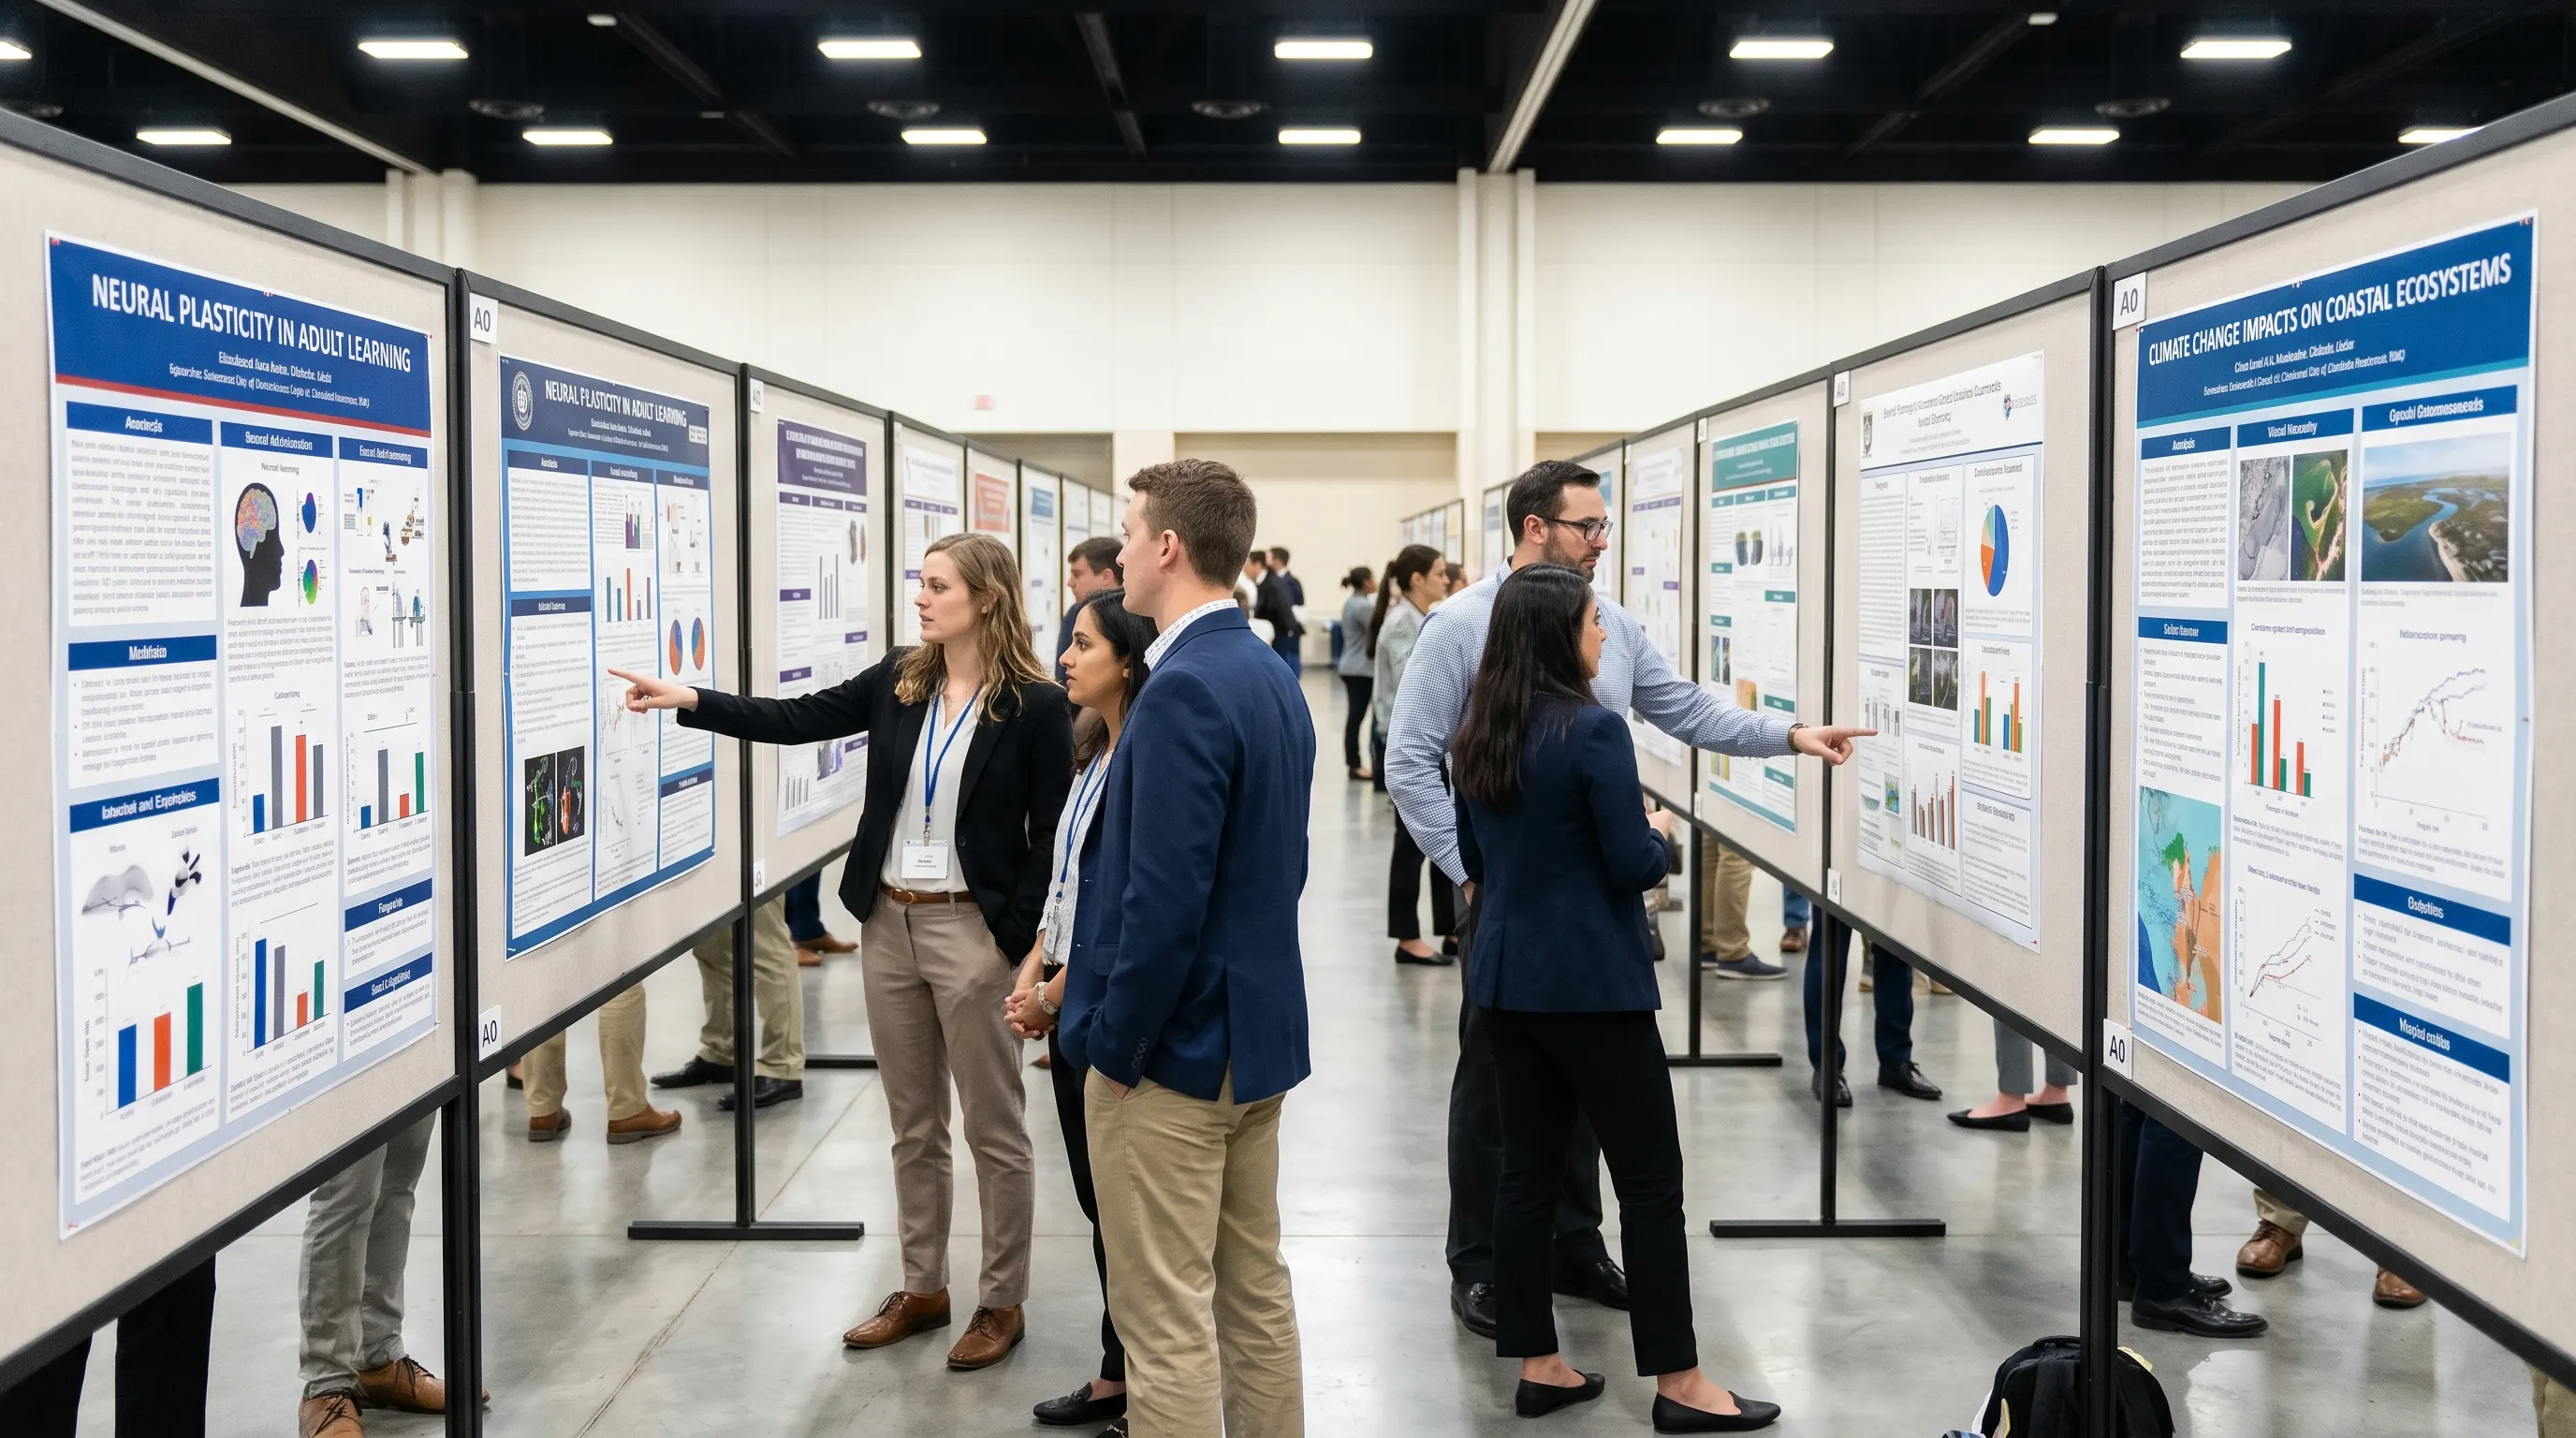
Poster View — The classical conference poster. You stand by your work during dedicated viewing hours, engage with delegates one-on-one, and the printed sheet does the talking when you step away to find coffee. The vast majority of accepted EHA abstracts land in this tier — and the bar for visual clarity is highest, because your poster competes for attention with hundreds of others in the same hall.
Publication Only — Your work publishes in HemaSphere as part of the supplement but you do not present in person. This is not a rejection; it is a formal acknowledgment that the science meets the publication standard while session capacity is finite. The work remains citable from June 11 forward.
EHA 2026 four-tier pyramid: Oral, Poster Tour, Poster View, Publication Only, with audience size (Figure generated with SciFig)
Whichever tier you landed in, your visual strategy diverges. Oral and Poster Tour presenters need narrative-driven figures that read coherently during a 3-minute walkthrough. Poster View authors need standalone information density that survives a 90-second skim by a delegate juggling a coffee and a conference badge.
6. EHA 2026 Poster Visual Anatomy: Five Essential Figures Every Hematology Poster Needs
Walk through any EHA poster hall and you will see the same five visual elements appear across nearly every accepted abstract. These are not aesthetic suggestions; they are the structural backbone of how hematologists communicate translational science to one another.
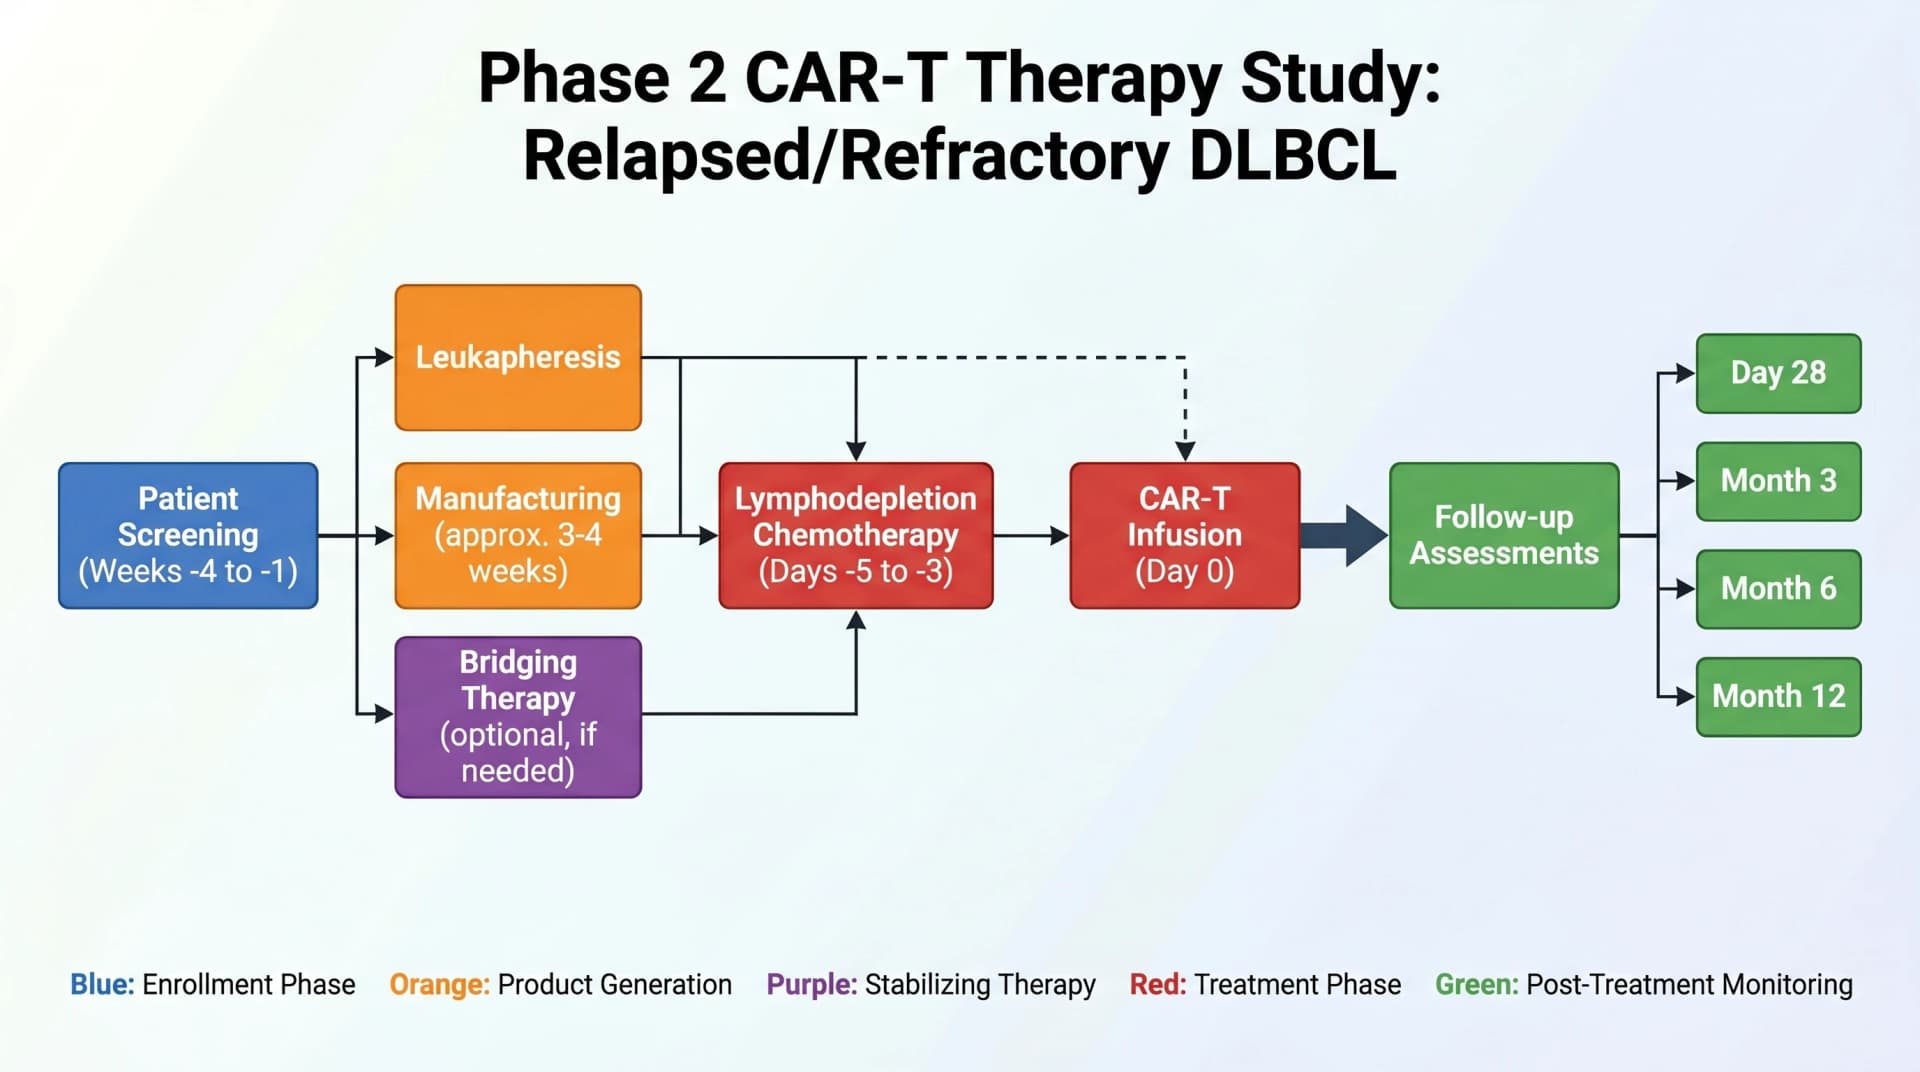
Trial Schema or CONSORT Flow Diagram
Every clinical abstract — and many translational ones — opens with a study design figure. For interventional studies the CONSORT framework is the de facto standard: enrollment, allocation, follow-up, analysis. For observational studies, a horizontal timeline with patient milestones. These figures earn their space because they answer "what did you actually do?" before the reader commits to your methods section.
CAR-T trial schema for r/r DLBCL: leukapheresis → manufacturing → infusion → Day 28 / Month 3-12 follow-up (Figure generated with SciFig)
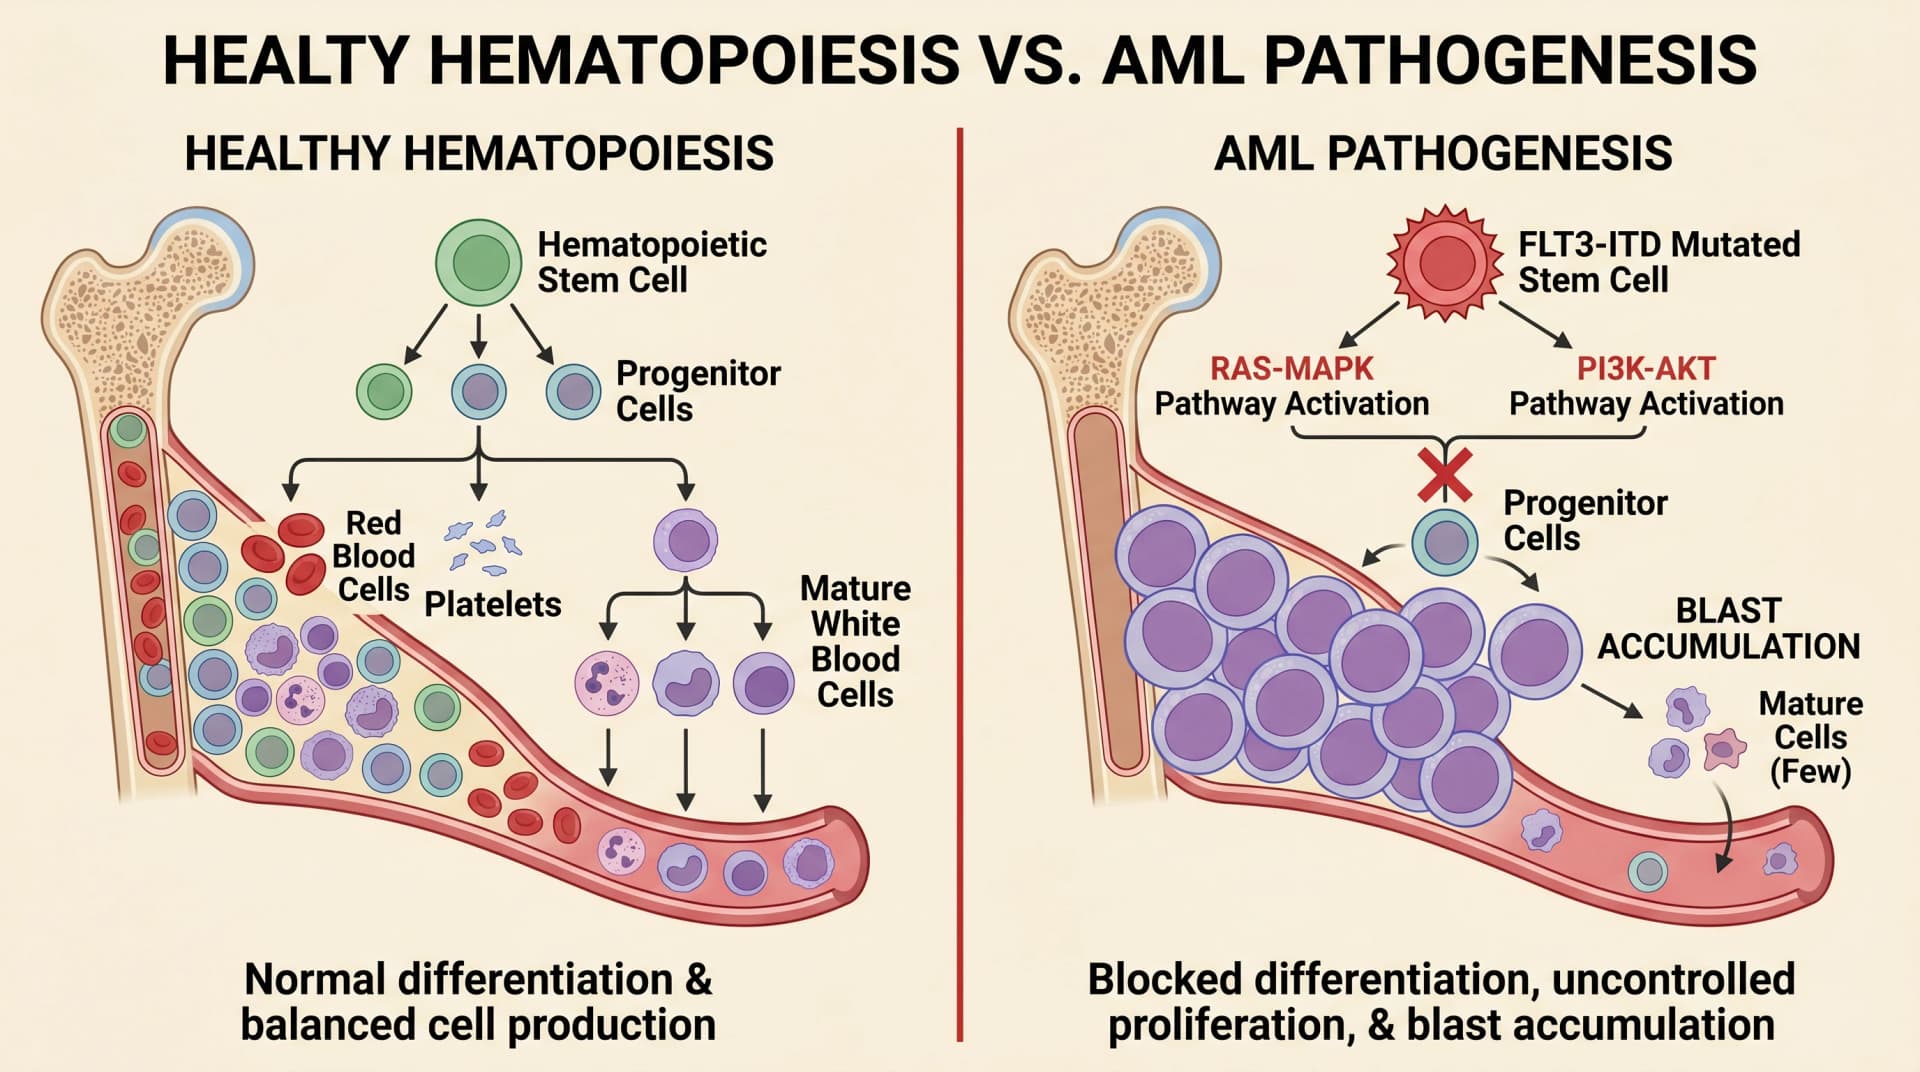
Disease Mechanism Diagram
This is the figure that determines whether your poster gets read. For an AML abstract, a schematic of FLT3-ITD signaling and blocked myeloid differentiation. For a multiple myeloma paper, BCMA expression on the plasma cell and the bone marrow microenvironment. For a DLBCL CAR-T trial, the immunological synapse between engineered T cell and CD19+ tumor cell. These mechanism figures are universally expected and historically the slowest to produce — a single high-quality pathway diagram in Adobe Illustrator runs four to eight hours of skilled design labor. Before reroll-then-fix wastes that day, scan the five most common mistakes researchers make on scientific figures so your first draft avoids the most expensive ones.
AML mechanism: FLT3-ITD activates RAS-MAPK and PI3K-AKT, blocks myeloid differentiation, vs healthy hematopoiesis (Figure generated with SciFig)
Hematopoiesis Context Tree
If your work touches stem cells, leukemia, lymphoma, myeloma, or transplantation, a simplified hematopoiesis tree anchors the reader. The differentiation lineage from HSC through MPP through CMP and CLP to mature blood cells is so foundational that most accepted EHA posters include it in the introduction panel — sometimes annotated to highlight the specific cell of origin or differentiation block your study addresses.
Disease-Specific Signaling Pathway
These four — JAK/STAT for myeloproliferative neoplasms, BCR signaling for CLL, NF-κB for DLBCL, RAS-MAPK for AML — are what hematologists informally call fingerprint pathways: the specific molecular cascades whose dysregulation defines each disease entity at the cellular level. A pathway diagram done well doesn't just decorate your poster; it tells the reviewer that you understand exactly which signal node your study is intervening on. The visual literacy bar is correspondingly high. A reviewer who studies CLL has seen a thousand BCR diagrams. Yours needs to add something — a novel intermediate, a specific phosphorylation site, an unexpected feedback loop — or, at minimum, present the canonical pathway with publication-grade clarity. For the layered iteration approach that lets you adjust an arrow or add a phosphorylation site without rerolling the entire image, see our walkthrough on creating cell signaling pathway diagrams with AI.
Survival Curves, Forest Plots, and Statistical Figures
Kaplan-Meier curves. Hazard ratios. Subgroup forest plots. Waterfall and swimmer plots. These come from your statistical software — GraphPad Prism, R with survminer, SPSS — and have to be exported with publication-grade defaults. Note: AI illustration tools do not generate these from raw data; they remain the job of your statistics package. Be honest about the division of labor. For a deeper look at hitting journal-grade figure quality on a research-budget without enterprise software licenses, see our guide on creating Nature-level figures on a budget.
The first four elements — schema, mechanism, hematopoiesis, pathway — are where 90% of poster preparation time historically went. They are also where AI-assisted illustration has compressed the curve most dramatically.
7. AI-Powered Hematology Poster Workflow: Generate Mechanism Diagrams with Text-to-Figure and PDF-to-Figure
Here is what the modern workflow looks like for an EHA acceptance recipient. You already have two things in hand that competitors and earlier-career colleagues do not: your accepted abstract PDF (attached to the April 24 decision email) and clear knowledge of your study's mechanism. Use both.
Path 1 — Upload your accepted abstract PDF. Drag the PDF into SciFig's PDF-to-Figure tool. It parses the Background, Methods, and Results sections and generates a starter mechanism diagram in one click. For most clinical abstracts this produces a first draft of the trial schema and disease mechanism figures within seconds — no blank canvas, no prompt engineering. You start refining, not from zero, but from a 70%-there draft that already understands your study's biology.
Path 2 — Copy a structured prompt. For the supporting figures (hematopoiesis tree, signaling pathway), Text-to-Figure with a written prompt gives more control. Copy this prompt verbatim and adjust to your disease:
Schematic of AML pathogenesis showing FLT3-ITD mutation, downstream
RAS-MAPK and PI3K-AKT pathway activation, blocked myeloid differentiation,
blast accumulation in bone marrow. Side-by-side healthy hematopoiesis
vs AML state.
Path 3 — Sketch on a tablet, scan the napkin. If you sketched your hero figure on paper during Week 1, photograph it and drop it into Sketch-to-Figure. The model preserves your topology and produces a publication-style version.
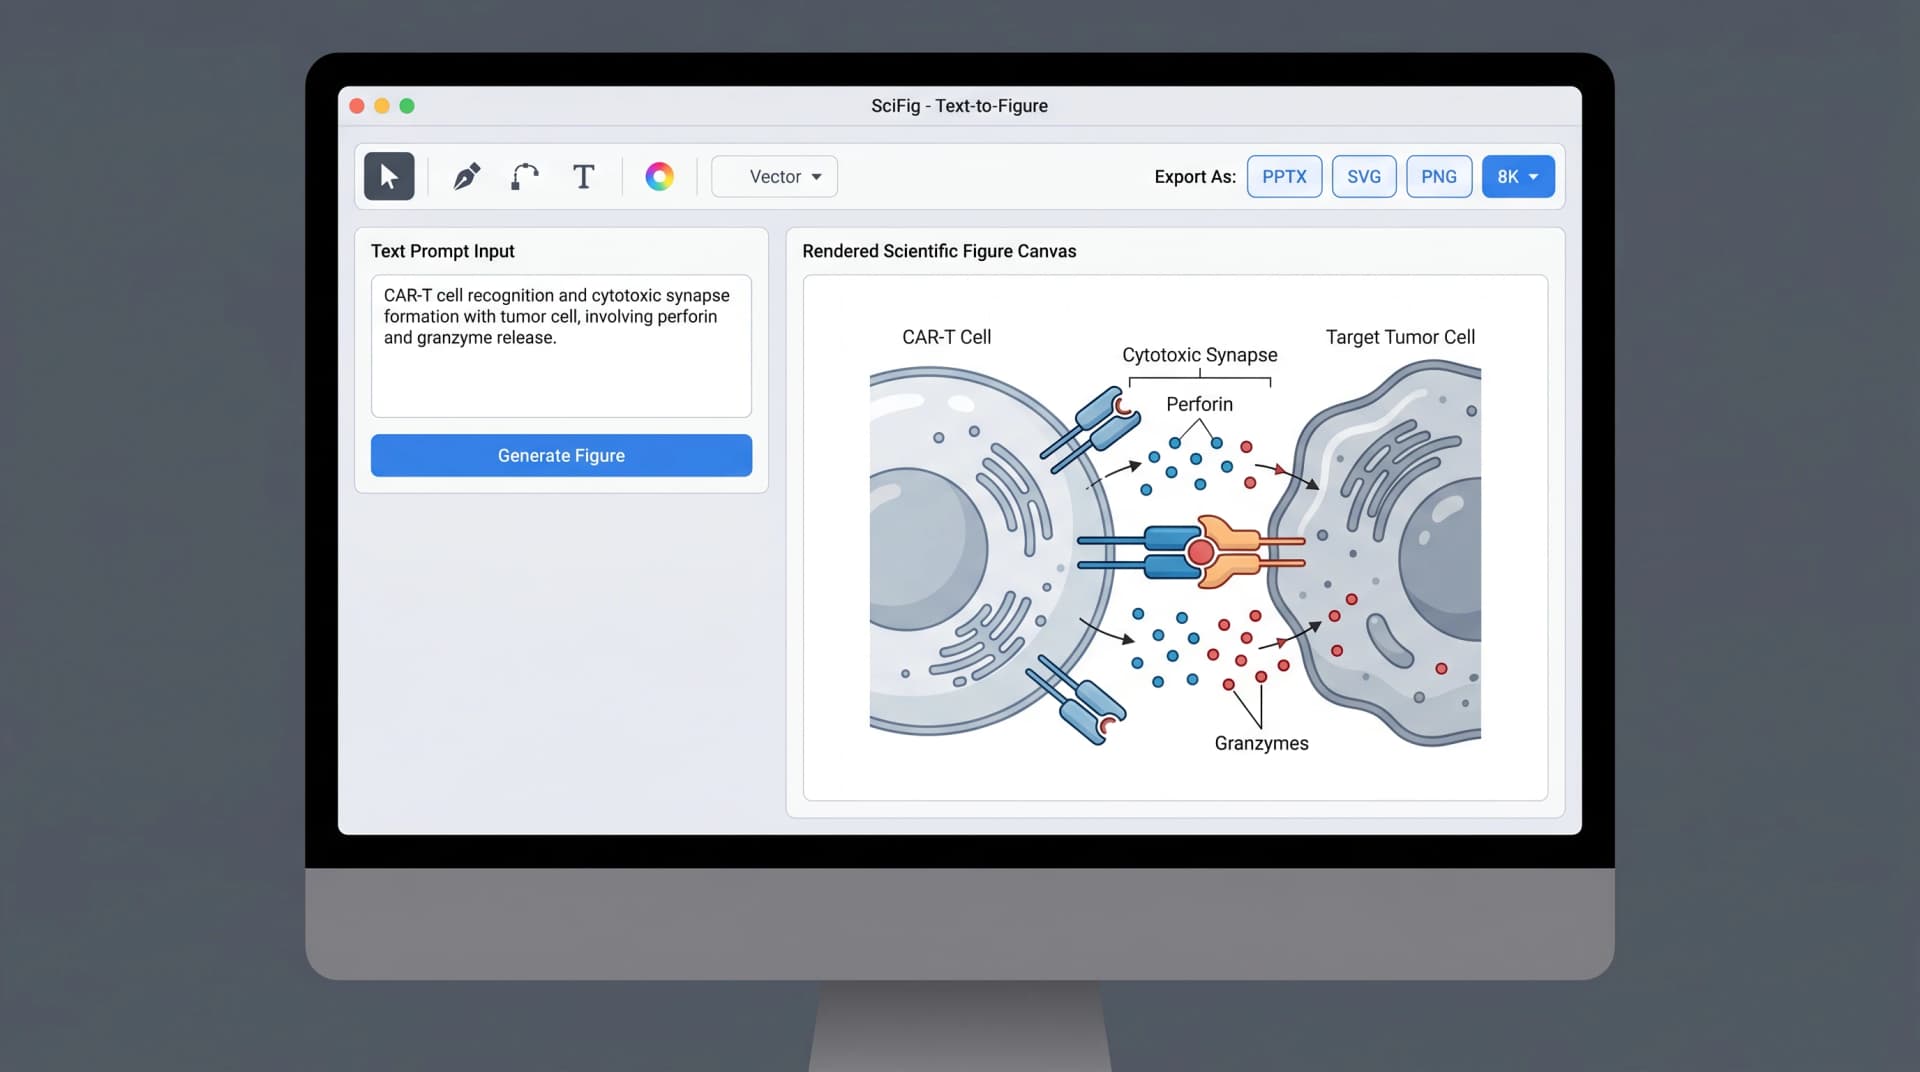
SciFig Text-to-Figure workflow: CAR-T mechanism prompt → canvas diagram with vector edits and PPTX/SVG export (Figure generated with SciFig)
From any of the three paths, you can:
Refine the prompt or sketch to emphasize specific receptors, mutations, or signaling intermediates
Edit individual elements in the vector canvas, including text labels and color palette
Export to editable PPTX or layered SVG for final composition in your lab's preferred design tool
Generate at 8K resolution for A0 poster printing without artifacting
For a Poster View author building five core figures — schema, mechanism, hematopoiesis, pathway, and a conclusion summary visual — the time investment moves from 25–40 hours of design work to 4–6 hours of prompting and refinement. For a late-breaking author whose preparation window is half as long, this is not a "nice to have" — it is the difference between meeting the deadline and not. For broader context on how AI text-to-figure changes the research-illustration workflow overall, see Visualize Research Instantly.
A new SciFig account starts with 150 starter credits plus 50 refill credits every day. Five publication-style figures typically consume 30–60 credits, depending on iteration count. Most EHA Poster View authors complete the entire visual set within their first week without any additional purchase — review the pricing page if you anticipate heavier iteration or want annual coverage. Once your figures are drafted, the next question is how to compose them into a poster that wins its tier — covered in detail in how to design a winning EHA 2026 poster.
See PDF-to-Figure Extraction in Action
Upload a research PDF — SciFig extracts and regenerates any figure inside as an editable SVG.
☐ All five core figures drafted (schema, mechanism, hematopoiesis, pathway, results visual)
☐ Title visible from 3 meters at the standard reading angle
☐ Key finding stated in plain language above the methods panel
☐ No trade names or commercial logos (EHA prohibits brand drug names; use generic INN)
☐ Author disclosures linked or printed per EHA policy
☐ Embargo respected (no pre-publicizing embargoed data on social media or preprint servers)
☐ Poster file exported as PDF or PPT, A0 landscape, single page
☐ Backup digital copy on USB and cloud storage
☐ Print proof reviewed at full size — what looks crisp at 25% zoom can be unreadable when blown up to 100%
☐ Print scheduled with a Stockholm-based partner or shipped well in advance of June 10
☐ Three-minute walkthrough rehearsed out loud at least twice
If your acceptance is late-breaking, halve this timeline and skip the international shipping option entirely. A Stockholm same-day print partner is essential.
Tip
The single highest-leverage decision in your remaining preparation window is which figure becomes the hero. Pick the figure your delegates need to remember 24 hours later — usually the mechanism diagram or the trial schema with key result overlaid — and design the rest of the poster around it, not the other way around.
How Your 150 Starter Credits Cover Your EHA Poster
For most EHA Poster View authors, the workflow is:
Upload your accepted abstract PDF → PDF-to-Figure → starter trial schema + disease mechanism (~10–15 credits)
Iterate with vector edits or sketch upload → refinement (~10 credits)
Total typical credit consumption: 35–50 credits. Your 150-credit starter pack covers all five core figures plus iteration, and your 50 daily refill resets for any next-day adjustments. Late-breaking authors who lose two weeks compared to regular acceptance can finish their full visual set in a single weekend.
Extract Figures from Any PDF
Turn any scientific paper's figures into editable, publication-ready illustrations.
EHA has not publicly released physical dimensions for the 2026 poster sessions, but the European-standard default for hematology and oncology conferences is A0 landscape (841 × 1189 mm, or 33.1 × 46.8 in). Plan your layout to this size unless EHA confirms otherwise closer to Congress. Posters oriented portrait risk not fitting the supplied board hardware. When in doubt, confirm with the EHA secretariat the week before printing, and use the pre-Congress checklist above to lock down format details before sending the file to your print partner.
EHA Poster Tour is a guided session for 8–12 delegates walking between three to five posters with a chair who asks each presenter for a 3-5 minute summary. Poster View is the classical conference format — you stand by your poster during dedicated viewing hours and engage with delegates one-on-one. Tour authors need a poster that doubles as a 3-minute talk backbone; View authors need standalone information density that survives a 90-second skim. The visual strategy diverges sharply between the two — covered in detail in Section 5 of this guide.
The EHA 2026 late-breaking abstract submission window runs 30 April to 7 May 2026, with acceptance notifications sent 22 May 2026 and accepted abstracts published online 2 June 2026. If your late-breaking abstract is accepted on 22 May, you have approximately 20 days until the 11 June Congress opening — half the regular acceptance window. This compressed timeline makes AI-assisted figure generation not optional but essential, especially for the mechanism diagrams and trial schemas that dominate hematology posters.
Many delegates choose a Stockholm-based print partner to avoid the cost, fragility, and customs friction of carrying a printed A0 poster tube through European airports. Lead time is typically 2–3 business days at local print shops, plus 1 day for hotel delivery — book early because June overlaps with peak Scandinavian tourist season. International shipping from your home country is feasible but requires a 4–6 day buffer plus customs paperwork. If your late-breaking acceptance came on 22 May, local Stockholm printing is the only realistic option given the 20-day window.
Oral Presentation is the top tier — selected by the Scientific Programme Committee based on the highest peer-review scores, typically 10–12 minutes plus discussion in a session hall holding several hundred delegates. Poster Tour is the next tier — a guided walk where 8–12 delegates move between three to five posters with a session chair who asks each presenter for a 3–5 minute summary. Oral authors invest most preparation time in slides; Poster Tour authors invest most in a poster that doubles as both standalone artifact and 3-minute talk backbone. The visual strategy diverges sharply between the two — covered in detail in Section 5.
Disclaimer: This article is educational content focused on scientific figure design for conference posters and publications. It is not medical advice and should not be used for clinical decisions. The disease mechanisms, drug indications, and treatment protocols described here are summarized from peer-reviewed sources cited above; for clinical practice, consult primary literature, official treatment guidelines (e.g., NCCN / ESMO / ASH), and licensed clinicians. SciFig is a scientific illustration tool — it does not diagnose, treat, or advise on patient care.