
Scientific Illustration Insights
Tutorials, tool comparisons, and prompt frameworks for researchers creating publication-ready scientific figures.
Articles
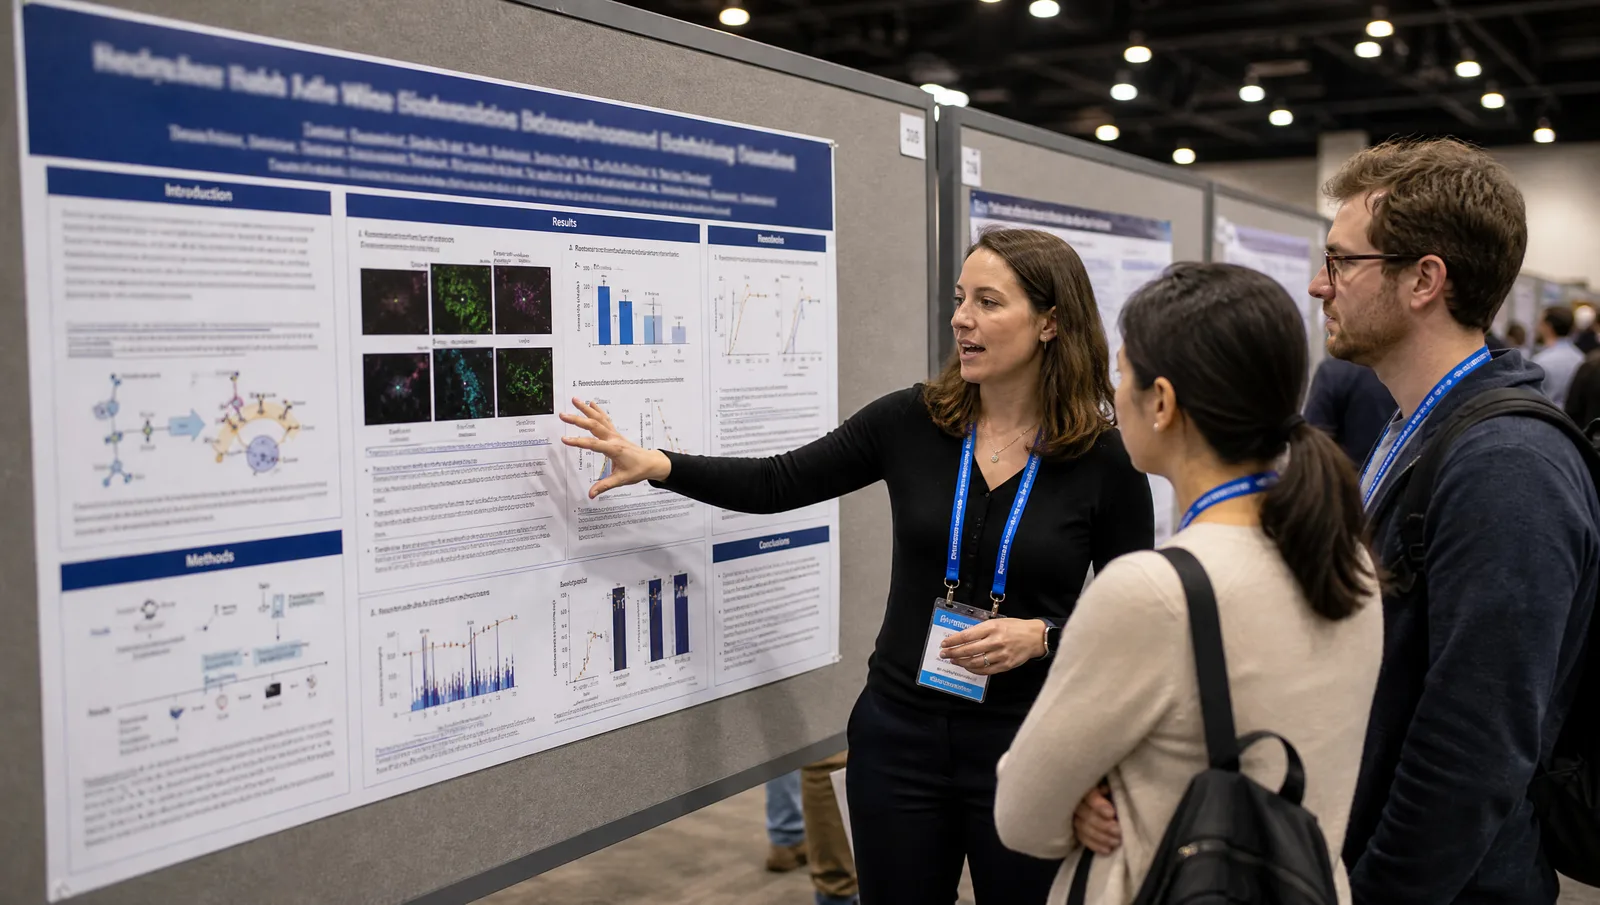
Cell Bio 2026 Poster & Presentation Guidelines and Template
Official Cell Bio 2026 poster guidelines: the 6 ft landscape board, the Sept 14 abstract deadline, minisymposium talk times, and the MBoC abstract supplement.
 SciFig Team·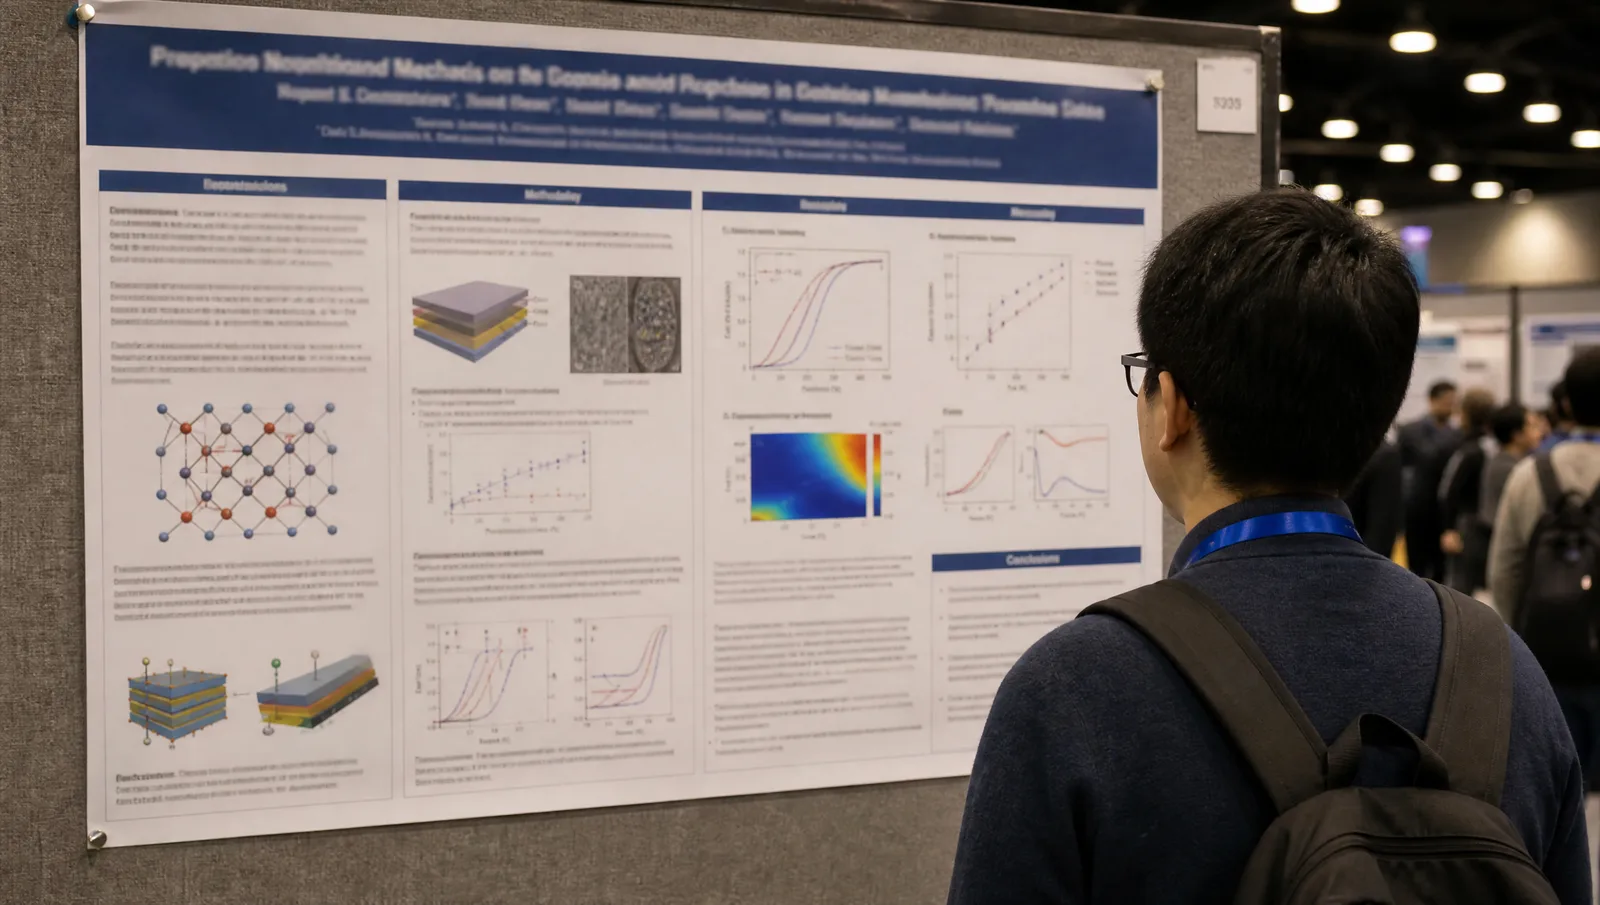
MRS Fall 2026 Poster Template and Guidelines
MRS Fall 2026 poster guide: what MRS has published on board size so far, talk timing, 16:9 slides, mid-August confirmations, Nov 29-Dec 4 in Boston.
SciFig Team·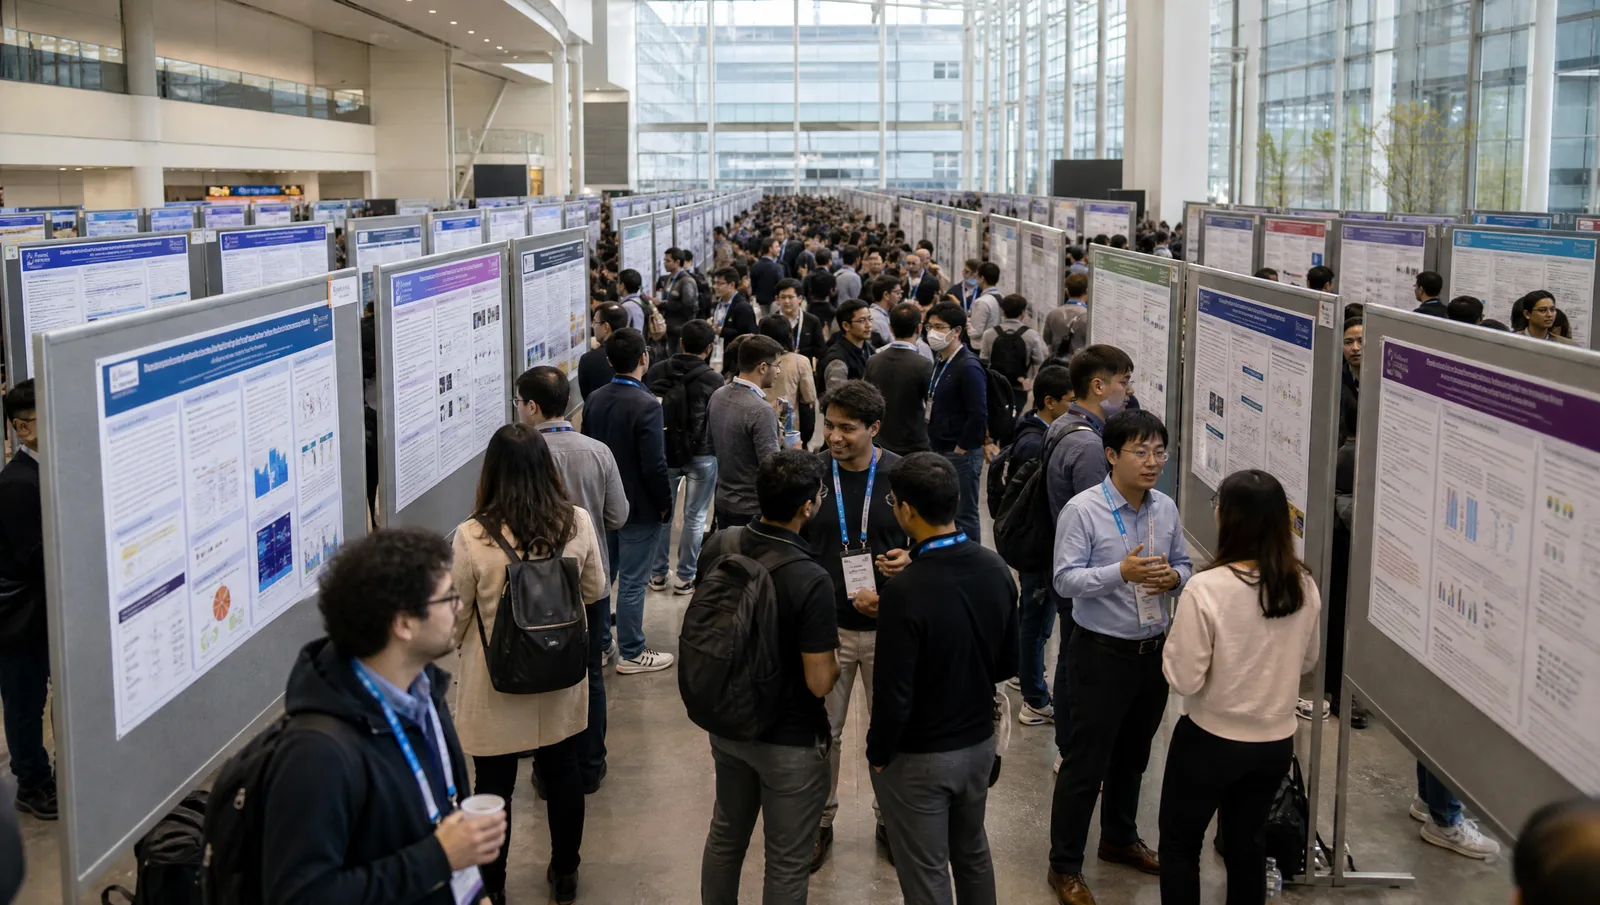
NeurIPS 2026 Poster & Presentation Guidelines and Template
Official NeurIPS 2026 poster and presentation guidance: three host cities, the author LLM policy, accessibility rules, and what poster specs are still pending.
SciFig Team·
eLife Acceptance Rate 2026: 35% Sent for Review
eLife makes no accept/reject decision. In 2025 it sent 1,013 of 2,853 submissions for review — 35%. What that number means for your paper, with sources.
 Alex Carter·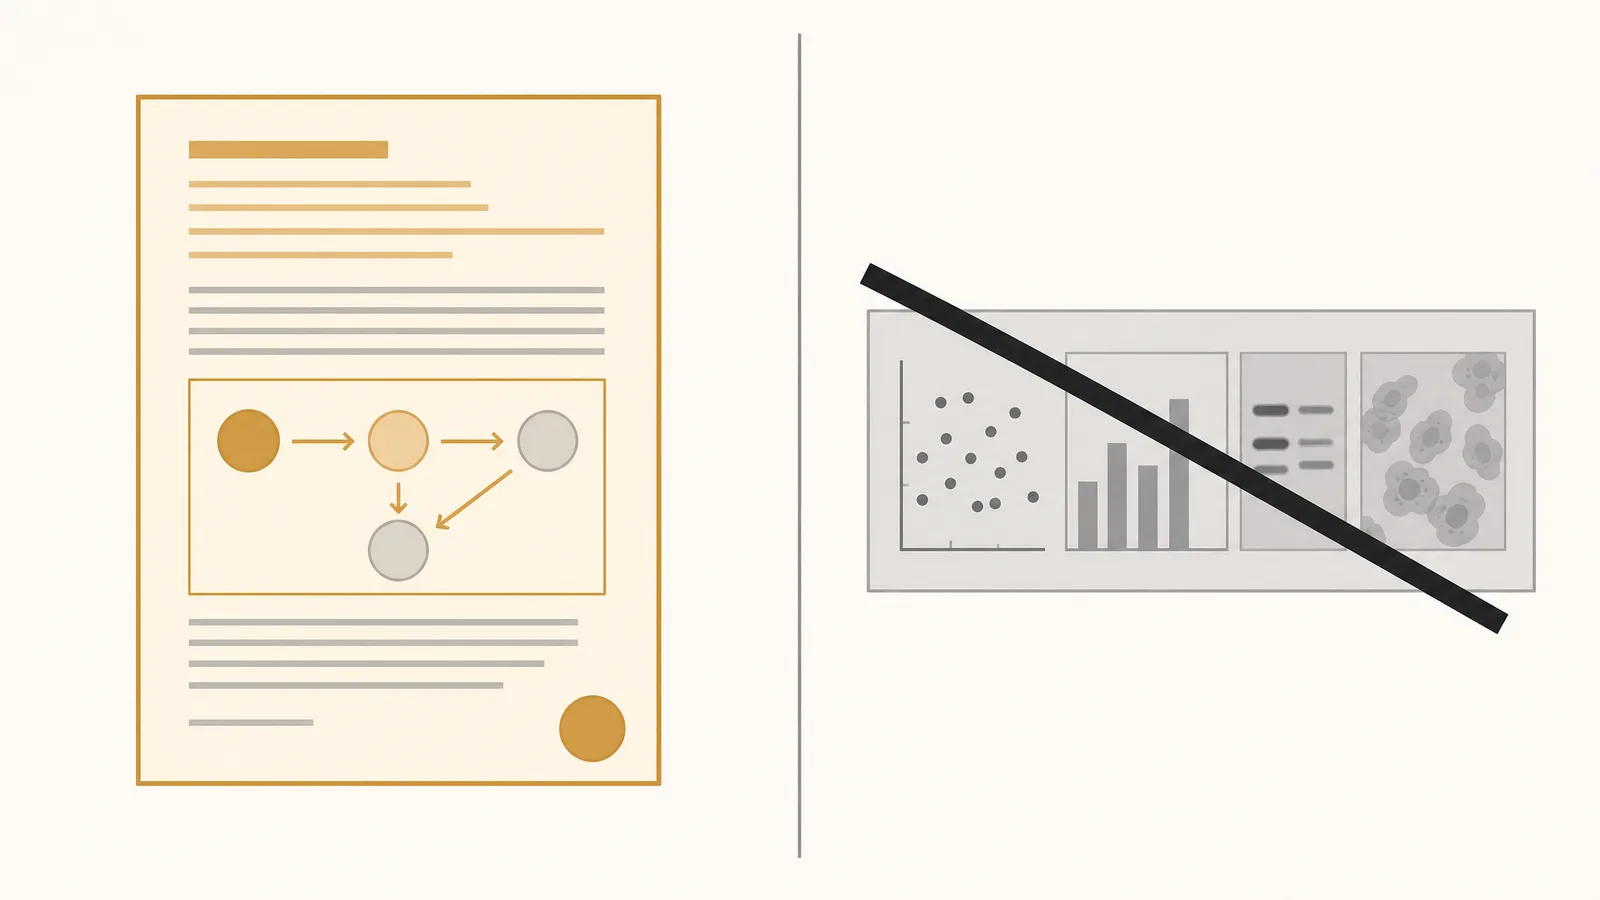
eLife AI Policy 2026: AI-Generated Figures & Disclosure
eLife requires AI disclosure in Materials and Methods. Check figure-integrity rules separately; AI-generated striking images are prohibited.
Alex Carter·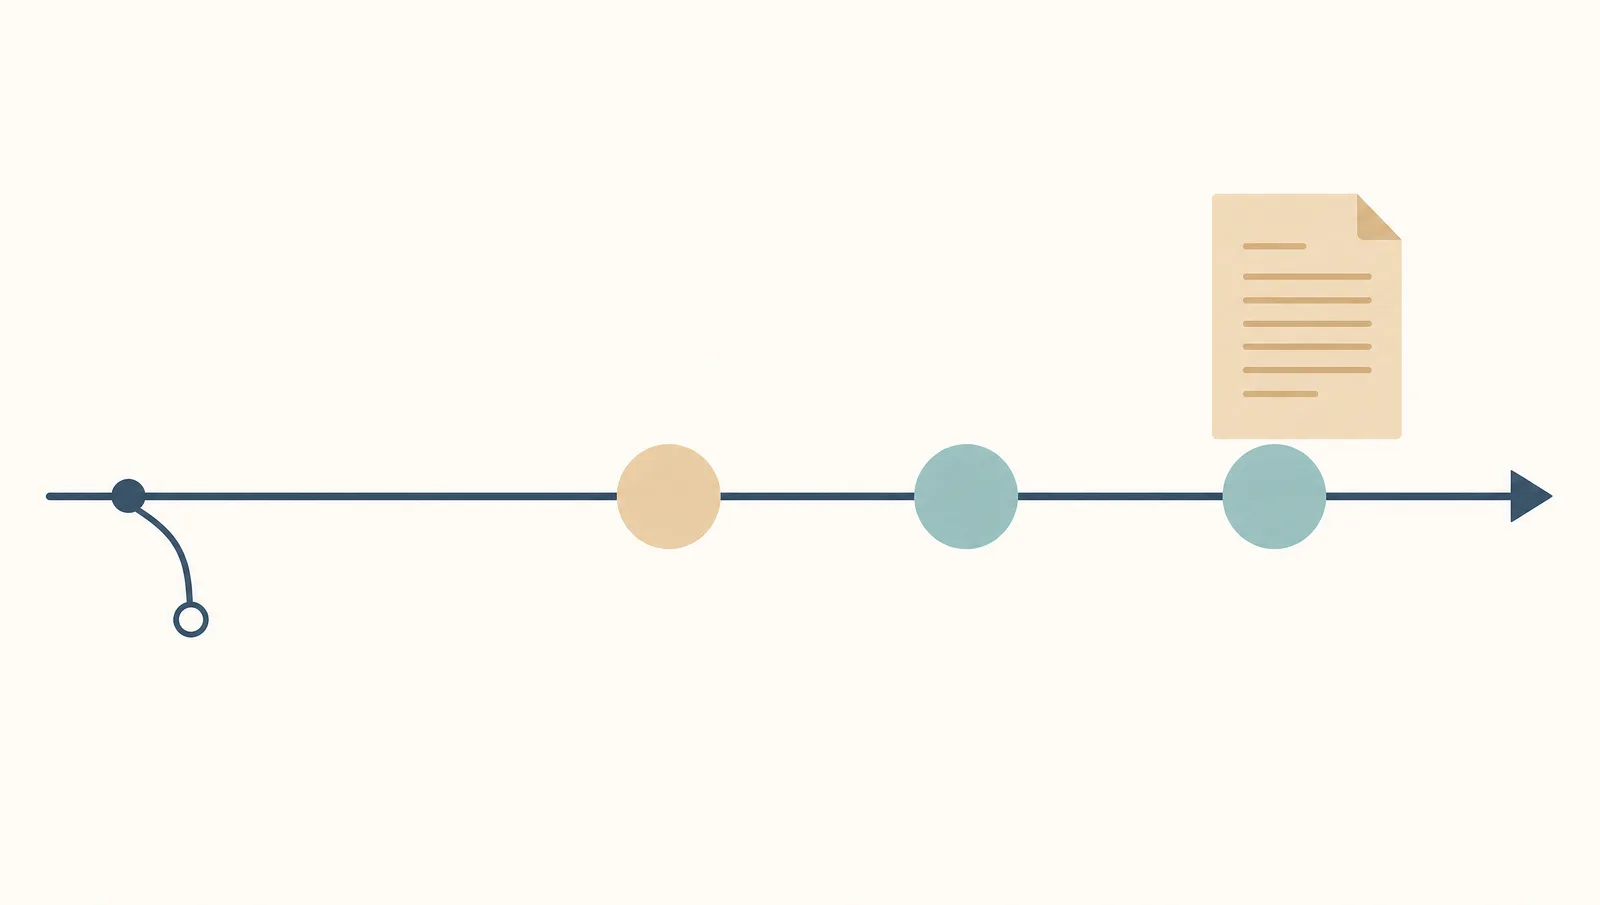
Nature Communications Review Timeline 2026: 9 Days to Decide
Nature Communications reports a 9-day median to first editorial decision and 242 days to acceptance. What each submission status means and when to worry.
Alex Carter·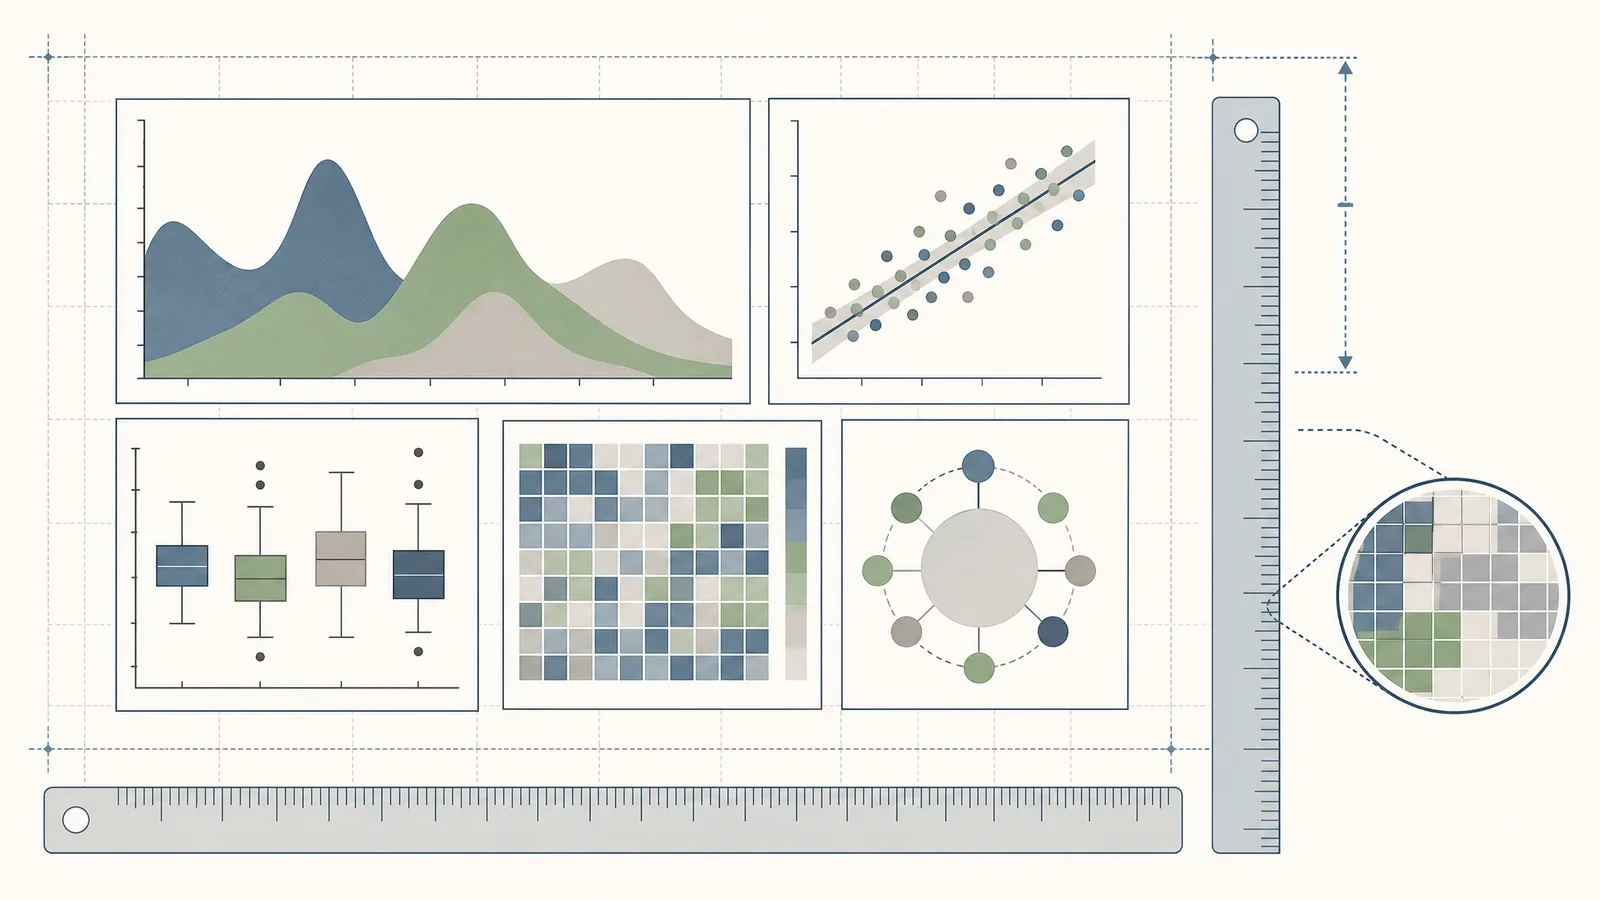
eLife Formatting Requirements 2026: Figures & Limits
eLife formatting: 300 dpi figures at 10cm minimum width, no limit on figures or supplements, article-type word guidance, and what must be in each legend.
Alex Carter·
eLife Impact Factor 2026: Why There Isn't One
eLife has no impact factor because Web of Science indexes it only partially — a status eLife accepted rather than change its model. What that means for authors.
Alex Carter·
eLife Submission Guide 2026: Preprint First, $3,750 Fee
How to submit to eLife: post a preprint first, $3,750 fee charged at review not acceptance, public reviews, article types and word limits, and full waivers.
Alex Carter·
Nature Communications Formatting Requirements 2026
Nature Communications formatting: vector line art, 300 DPI photos, 88mm and 180mm column widths, 10 display items, 5,000 words and a 200-word abstract.
Alex Carter·
Nature Communications Impact Factor 2026: 18.1
Nature Communications impact factor is 18.1, with a five-year JIF of 18.9. What the number covers, and why a 2026 search returns a 2025 value.
Alex Carter·
Nature Communications Submission Guide 2026: Format & Fees
How to submit to Nature Communications: format-flexible first submissions up to 30MB, 5,000-word guidance, 10 display items, and the $7,350 APC.
Alex Carter·More on scientific figures
SciFig
Free AI Scientific Figure Generator for Illustrations, Images, Charts and Flowcharts
Pricing
View pricing
Tools
Three AI workspaces for figures, charts, and diagrams, plus free tools for every research figure.
Models
Default to GPT Image 2 for journal papers; switch to Nano Banana Pro for slides and posters; pick Nano Banana 2.1 for routine figure work
Tutorials
Seven short walkthroughs of the AI scientific figure generator
Inspiration
Explore publication-ready illustrations, charts and flowcharts. Copy a prompt or open any template as the starting point for your own figure.
The Best Color Palettes for Scientific Figures (2026)
Publication-grade and colorblind-safe color palettes for scientific figures, graphs, pie charts, combo charts, and diagrams, with HEX values.
18 Scientific Poster Examples to Learn From in 2026
18 scientific poster examples across biology, chemistry, medicine, and engineering — plus PhD examples, poster templates, and a poster-maker workflow.
How to Add Figures to a Research Paper
Step-by-step guide to including figures in research papers: placement, captions, DPI, vector formats, and journal-specific rules. Avoid common rejection causes.

Ready to start?
Publication-ready scientific figures, in minutes
Start Creating FreeFree to start · No credit card required · Built for researchers