eLife sent 35% of submissions out for peer review in 2025 — 1,013 papers out of 2,853.
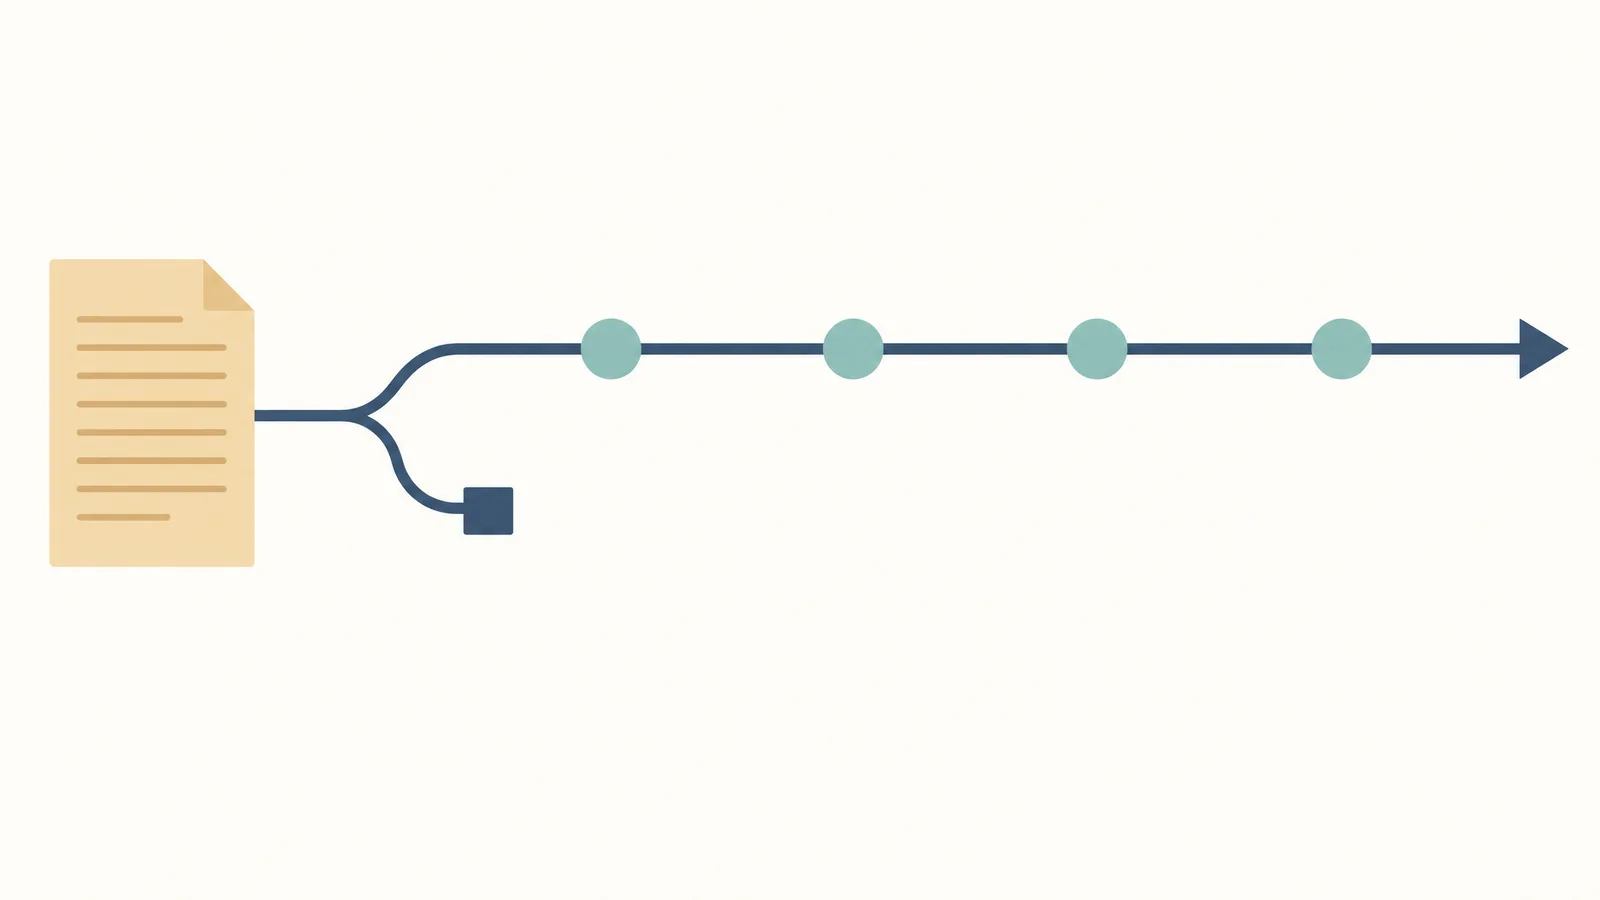
That percentage is the closest thing eLife publishes to an acceptance rate, and it is not the same thing. Since 2023 eLife has not made accept/reject decisions at all. Every paper its editors send to review gets published as a Reviewed Preprint, together with the referee reports and an eLife Assessment. So the selection no longer happens after review. It happens before it, at the desk, and that is the gate this page is about.
What is eLife's acceptance rate?
Here is why the usual metric does not exist. At a conventional journal, an acceptance rate is the proportion of submissions that survive peer review and get a formal "accept." eLife removed that step. In its own words, the model "removes the onus on peer reviewers to make binary accept/reject recommendations for papers when the reality is often far more nuanced."
That makes the gate a genuine selectivity number, and it is the one to plan around.
How many submissions actually get sent for review?
eLife publishes the raw counts each year. These are the official figures, not estimates:
| Year | Submissions | Sent for review | Share |
|---|---|---|---|
| 2023 (Feb–Dec) | 5,590 | 1,513 | 27% |
| 2024 | 6,396 | 1,719 | 27% |
| 2025 | 2,853 | 1,013 | 35% |
eLife's own summary of the trend: "the proportion of articles selected for peer review by our editors increased from 27% to 35%."
What happens after your paper is sent for review?
Passing the desk gate is the decisive event, but it is not the end of the process. Over the model's first two years (31 January 2023 – 31 January 2025), eLife reported:
| Submissions | 12,228 |
| Sent for review | 27.3% |
| Reviewed Preprints published | 3,054 |
| Versions of Record | 1,601 |
| Versions of Record with at least one round of revision | over 96% |
| Median submission → first Reviewed Preprint | 95 days |
| Average submission → final Version of Record | 279 days |
The practical read: expect to revise. Over 96% of Versions of Record went through at least one revision round, and the reviews are public from the first version onward, which means the first version people see is the one with the critique attached.
That is also why the figures you submit matter earlier here than at a conventional journal — the version that goes public alongside its reviews is the version you uploaded.
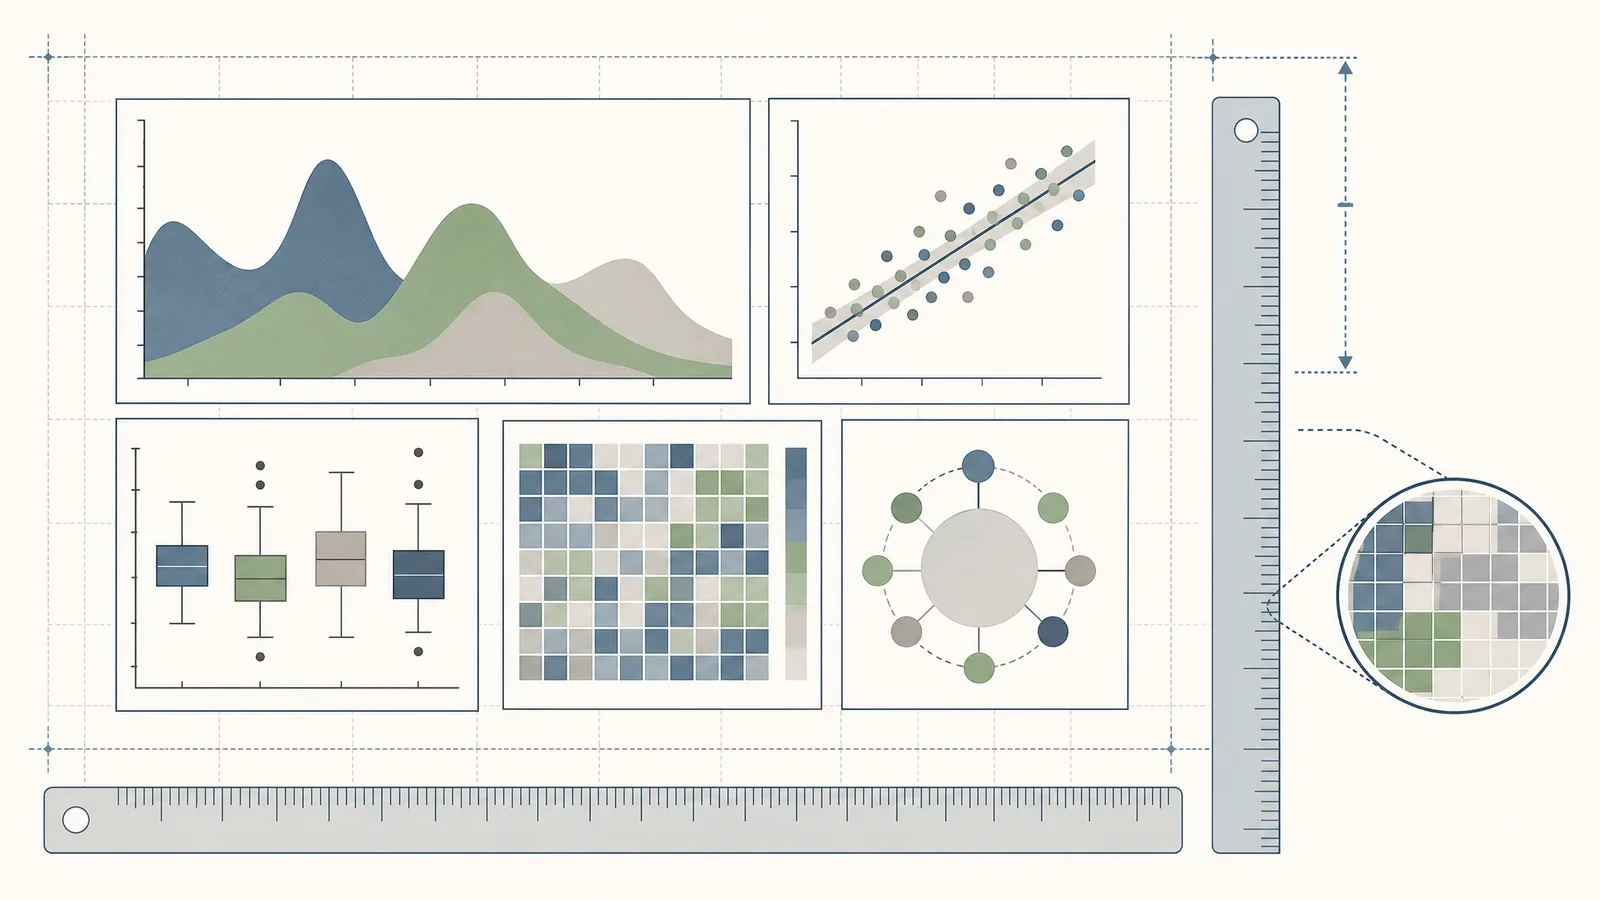
The figures reviewers see are the ones you upload
eLife publishes the reviewed version with its reviews attached, so the figures are part of a permanent public record.
Explore the ToolHow does this compare with a conventional journal?
You cannot compare 35% against a conventional acceptance rate directly. They measure different events: one is "did an editor send this to review," the other is "did this survive review." At most journals the second number is much smaller than the first.
Use it carefully. It undercounts what actually happens to your paper, because every one of the 3,054 Reviewed Preprints is already published, citable and carries a DOI. Papers that stop there are not rejections — most are simply finished, at their authors' choosing.
You may have seen "15%" — here is what that number means
So if you are weighing eLife against a journal quoting a 15% acceptance rate, you are not comparing like with like. The right comparison is: at eLife, one in three gets reviewed and published; elsewhere, one in three might get reviewed and then still be rejected.
What this means for your submission
Three things follow from the numbers above.
Make the central figure carry the claim
The desk gate is where eLife decides. A figure that explains your main result to a non-specialist is doing real work there.
Try FreeWhere to go next
Clearing the desk gate is the hard part. These cover what comes before and after it.
- "What goes in the submission?" — preprint first, $3,750 charged when review starts. eLife submission guide.
- "What do the figures have to meet?" — 300 dpi, 10 cm minimum width, no limit on how many. Because the reviews are published, figure quality is visible in a way it is not elsewhere. eLife formatting requirements.
- "Can I use AI on them?" — yes with disclosure, with one exception. eLife AI policy.
- "And the impact factor?" — eLife has none; the cause is partial Web of Science indexing. eLife impact factor.
Frequently asked questions
Sources
Every figure on this page comes from eLife's own published model updates. Reviewed 2026.
- The eLife Model: Three-year update — 2023–2025 submission and review counts, the 27%→35% review rate, eight-day decline median, 96-day publication median.
- The eLife Model: Two-year update — cumulative totals, Versions of Record, revision rate, 279-day average.
- eLife's New Model: One year on — the 31.4% legacy review rate.
Review rates move year to year, so read any percentage here with its year attached. eLife publishes the underlying counts annually — the links above always carry the current set.