Mind the Graph vs BioRender: a larger illustration library at a lower price, or a polished life-science editor.
Both are template-and-icon editors for scientific figures. Mind the Graph offers more than 75,000 illustrations and 300+ templates for less than half of BioRender's academic yearly price. BioRender has a curated library of 50,000+ icons and templates, team workspaces and an AI agent sold as an add-on. SciFig takes a different route: it generates the figure from your text, paper, sketch, photo or data, then lets you change every label and export editable files. Prices, free plans, AI tools and exports for all three are below.

Mind the Graph vs BioRender vs SciFig at a glance
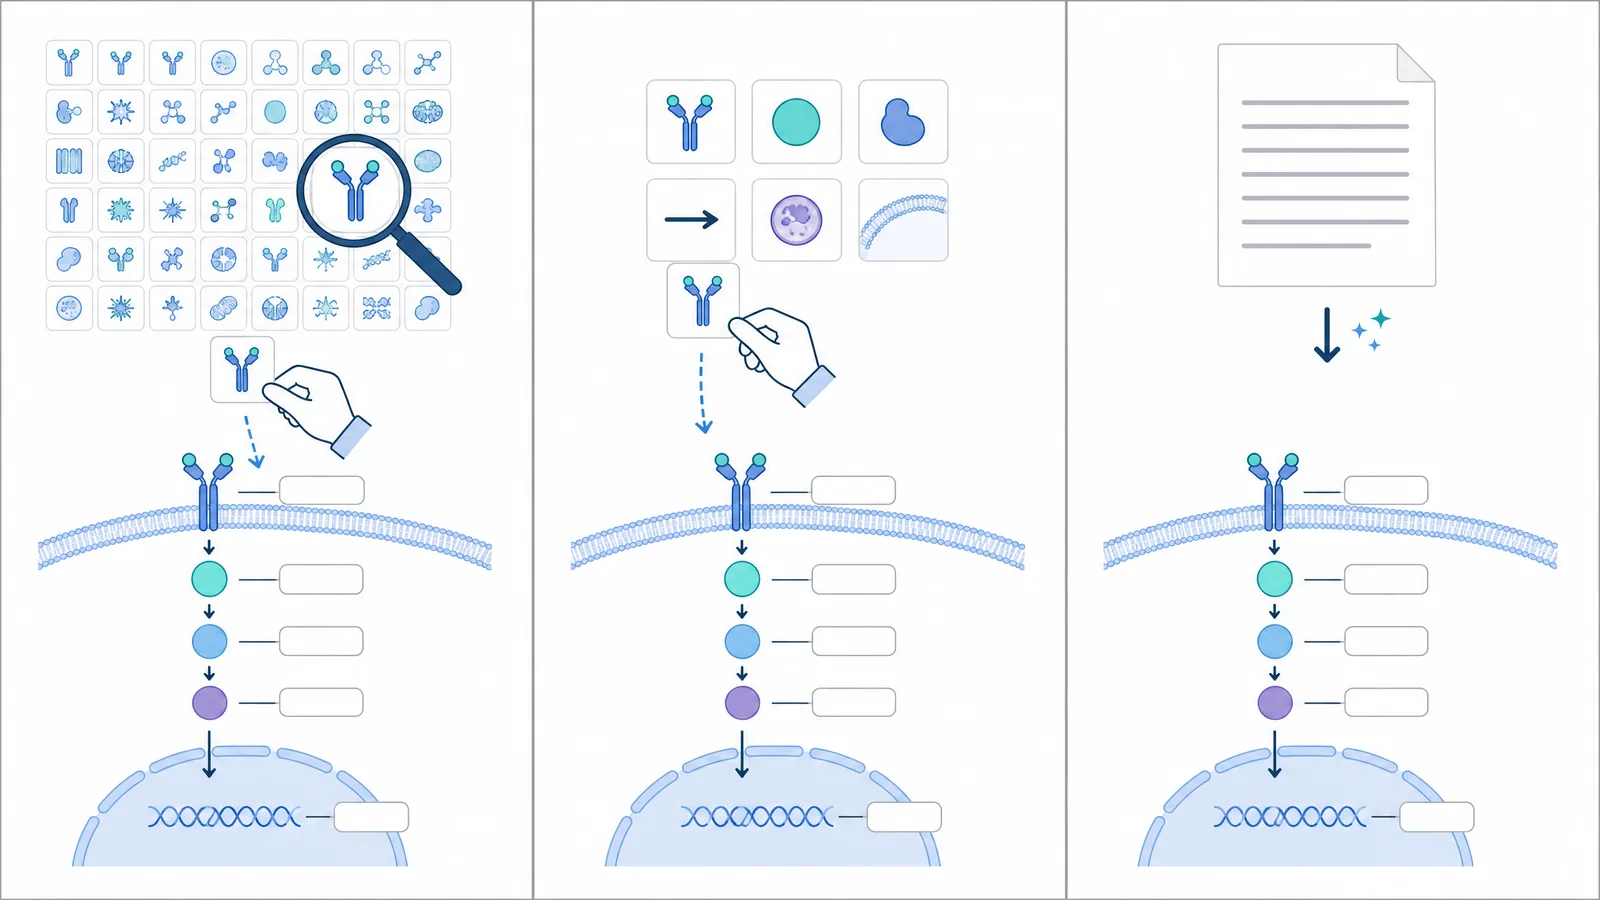
| SciFig | Mind the Graph | BioRender | |
|---|---|---|---|
| How a figure starts | AI generation from text, a PDF, a sketch, a photo or an existing figure; charts from your data; flowcharts from a description | Templates and a library of 75,000+ illustrations in 80+ fields, plus AI image generation | A curated library of 50,000+ icons and templates, plus AI tools led by the Leo agent |
| Free plan | 3 figures on day one, up to ~44 in the first month; publication and commercial use | Up to 4 illustrations, watermark, no vector downloads | Up to 3 figures, watermark, no publication use |
| Entry paid plan | $8.33/month billed yearly | $165/year or $25/month (Researcher) | $35/month billed yearly (Academic Individual) |
| Export | SVG, PNG, JPG, PPTX; SciFig DataChart adds PDF, EPS, TIFF | PNG, PDF, TIFF | PNG, JPG, PPTX, PDF |
| Best fit | Figures from your own material, with labels you can fix and files you can publish | Graphical abstracts, posters and infographics from a large library on a small budget | Life-science labs that share one icon library and team workspace |
Mind the Graph: the bigger library for less money
Mind the Graph is a web editor with more than 75,000 scientific illustrations drawn for 80+ fields and over 300 templates for graphical abstracts, posters, infographics and slides. Its PowerEdit tools change colors, sizes, positions and layers, and paid subscribers can also generate images from a text description and request custom illustrations, five a month on the Researcher plan. Mind the Graph is part of Cactus Communications, the company behind Editage.
SciFig: generate the figure, then edit every part of it
BioRender: the curated editor for life-science teams
BioRender is a drag-and-drop editor built around more than 50,000 life-science icons and templates drawn in one consistent style, with shared folders, team administration and a graphing tool. Its AI tools include Leo, an agent that plans a figure, offers sketches and adds the result to the canvas as editable elements, plus generators for protocols, timelines and flowcharts. Leo and regular AI use need the separate AI Add-On.
See AI Scientific Figure Generation in Action
Watch how researchers create publication-ready scientific figures from text descriptions.
Explore the ToolHow much do Mind the Graph and BioRender cost?

| SciFig | Mind the Graph | BioRender (academic) | |
|---|---|---|---|
| Entry paid plan | $8.33/month billed annually ($100/year), or starts at $19.9/month | Researcher: $165/year or $25/month | Individual: $35/month billed yearly ($420/year) or $39/month |
| Students | Extra 20% off one new purchase, on top of annual savings | Student: $52/year, $22/quarter or $9/month | Student Plan: $180/year or $19.95/month |
| AI generation | Included in every plan | Unlimited AI images on Researcher | AI Add-On from $48/year (about 5 custom figures a month) |
| Cost per AI figure (yearly entry plan) | About $0.35 (24 figures a month for $8.33) | — (unlimited on Researcher) | About $7.80 with Individual plus the AI Add-On |
| Unused paid credits | Roll over and never expire, even after you cancel | — | AI Add-On usage expires at the end of each billing period |
Is Mind the Graph free? Is BioRender free?
Yes, both have free plans, and neither free plan is built for publication-ready figures.
| Free plan | SciFig | Mind the Graph | BioRender Basic |
|---|---|---|---|
| What you get | 3 figures on day one, up to ~44 in your first month | Up to 4 illustrations and 1 editable creation | Up to 3 figures and 1 graphing file |
| Watermark | No | Yes | Yes |
| Resolution and vectors | Full SVG, PNG, JPG and PPTX export | No vector downloads | Standard resolution (72 DPI) |
| Publication | You own the figures; publication and commercial use with a free license PDF | Keep the watermark and cite Mind the Graph; full rights to creations on the Researcher plan | No publication or commercial use |
| Card required | No | No | No |
Refine Figures in the Vector Canvas
Open any AI-generated figure in the editable canvas — layered SVG, 8K PNG, or editable PPTX.
Try FreeWhich has more illustrations and templates?
Mind the Graph has the larger catalog: 75,000+ illustrations and 300+ templates against BioRender's 50,000+ icons and templates. The difference that matters day to day is coverage and style.
- Mind the Graph spreads its illustrations across 80+ fields, from medical science and biology to microbiology, and fills gaps with custom illustration requests on paid plans.
- BioRender concentrates on life-science icons drawn in one matching style, so figures from different lab members look consistent.
- SciFig does not depend on a catalog. A scientific figure for a field neither library covers well, such as a catalytic cycle, a soil profile or a device cross-section, is generated from your description, and every element stays editable.
Do Mind the Graph and BioRender have AI?
Both now have AI for scientific figures, but it sits on top of a manual editor rather than replacing it.
| AI feature | SciFig | Mind the Graph | BioRender |
|---|---|---|---|
| Figure from a text description | SciFig AI Illustration generates the full figure | AI image generation from text (Researcher plan and above) | Leo plans the figure, offers sketches, then a color version |
| Start from your own material | Text, PDF, sketch, photo, reference image or existing figure | Text | Text, an existing image, or reference files such as PDF, PPTX and CSV |
| Charts from data | SciFig DataChart: 50 chart types from CSV or Excel | — | BioRender Graphing, a separate product |
| Fix one label after generation | Edit Text in place, or edit the SVG in Vector Canvas | Retype in the editor | Retype on the canvas |
| How AI is priced | Included in every plan | Included in Researcher | AI Add-On from $4/month billed yearly |
BioRender gives free accounts a one-time trial allowance for its AI image tools; Leo itself needs the AI Add-On. Mind the Graph lists AI generation among the features that start with its paid plans.
Export formats and editable files
A scientific figure has to leave the tool in a format the journal, poster printer or slide deck accepts. Here is what each tool hands you.
| Export | SciFig | Mind the Graph | BioRender |
|---|---|---|---|
| PNG / JPG | ✓ PNG and JPG up to 8K | ✓ PNG | ✓ PNG and JPG |
| SVG (vector) | ✓ editable SVG; SciFig FlowChart native SVG | Vector downloads with the Researcher plan | — |
| PDF / TIFF | ✓ SciFig DataChart (PDF, EPS, TIFF) | ✓ PDF and TIFF | |
| Editable PPTX | ✓ | — | ✓ |
| Publication and commercial use | ✓ you own your figures; free license PDF | Full rights with a Researcher subscription | Paid plans; commercial rights on Industry plans |
Mind the Graph vs BioRender: which should you pick?
By role
- PhD student on a small budget: start in SciFig for free and publish what you make; Mind the Graph's Student plan is the cheaper library option if you prefer to assemble figures by hand.
- Lab manager choosing for a group: BioRender's Lab plan ($99 a month billed yearly for five seats) suits a team that standardizes on its icon set. SciFig covers illustrations, charts and flowcharts for the whole group, and paid credits never expire.
- Researcher outside the life sciences: chemistry, materials, earth science and engineering figures depend on generation rather than a biology catalog, which is where SciFig is strongest.