Free Origin alternatives include SciFig DataChart, LabPlot, Veusz, SciDAVis and Python; GraphPad Prism is paid.
OriginPro Prices and Free Options
OriginPro has a 21-day free trial. Its free Viewer opens and copies Origin project content, but it is not a full analysis program. Origin is the lower-priced edition without OriginPro's extended analysis tools.
| License or cost | OriginPro | Origin | SciFig |
|---|---|---|---|
| Student, one year | $69 in US/Canada; 30 project windows | — | Free to start |
| Academic, one year | $310 | $245 | 20% off for students, teachers and researchers |
| Academic, three years / perpetual | $837 / $980 | $661 / $770 | — |
| Commercial, one year | $755 | $550 | $8.33/month billed annually ($100/year) |
| Commercial, three years / perpetual | $2,038 / $2,360 | $1,485 / $1,730 | — |
| Cost per chart | — | — | About $0.69 on yearly Starter |
| Paid credits roll over, never expire | — | — | Yes |
Does OriginPro Run on Mac or Linux?
No. OriginPro is Windows software with no native Mac or Linux version. On a Mac it runs only inside a Windows virtual machine, so you need a Windows environment before making the first graph.
These alternatives work on a Mac without Windows:
- SciFig DataChart: in the browser, on Mac, Windows and Linux.
- LabPlot: native on macOS, Windows and Linux.
- Veusz: native on macOS, Windows and Linux/Unix.
- Python with SciPy and Matplotlib: on any system that runs Python.
- GraphPad Prism: paid, on Mac and Windows only.
On Linux, use LabPlot, Veusz, Python or SciFig in the browser.
How many computers can one OriginPro license use?
A node-locked OriginPro license runs on one computer per seat. To use it on both a laptop and a lab desktop, you need a seat for each machine or a multi-seat license. SciFig runs in the browser, so you can sign in from any of your computers.
OriginPro Alternatives Compared: Free and Paid
| Tool | Price | Platform | Fitting and statistics | Best for |
|---|---|---|---|---|
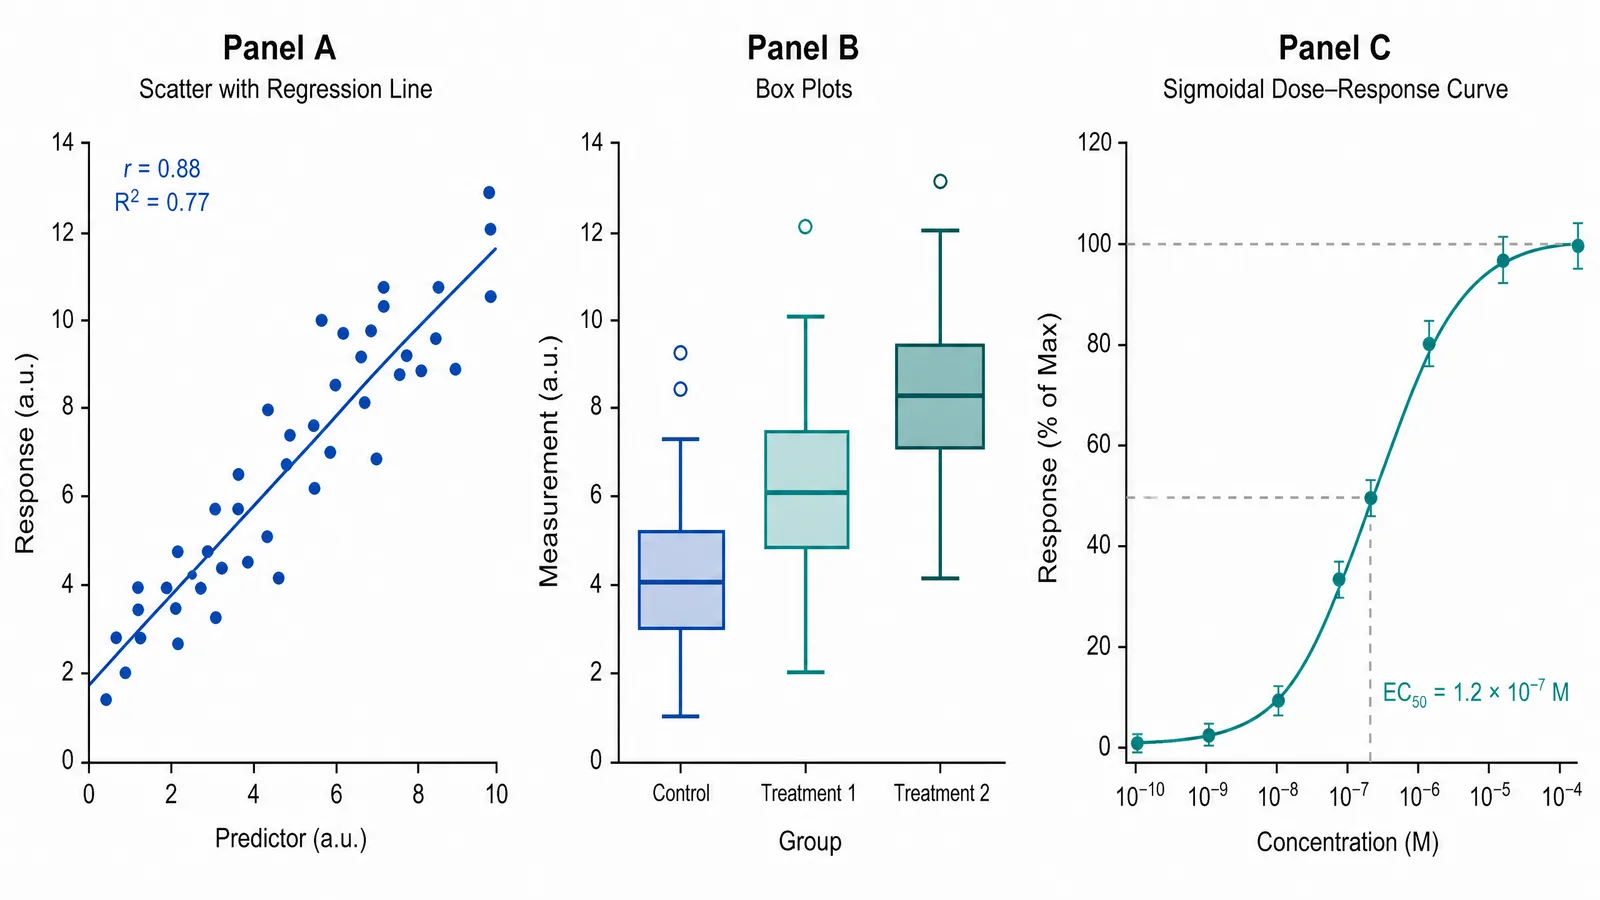
| SciFig | Free to start; free publication license | Browser: Windows, Mac, Linux | Regression, 3PL/4PL fits, t-tests, ANOVA | Charts from data plus illustrations and flowcharts |
| LabPlot | Free, open source | Windows, macOS, Linux | Statistics, regression, curve and peak fitting | Peak fitting, notebooks |
| SciDAVis | Free | — | — | Scientific data analysis and visualization |
| Veusz | Free | Windows, macOS, Linux/Unix | Fits functions to data | Vector plot output |
| Python / Matplotlib | Free, open source | Any system with Python | SciPy curve fitting and statistics | Plots defined in code |
| GraphPad Prism | Paid, from $142/year (student) | Windows, Mac | Statistics and curve fitting | Labs with a paid desktop package |
OriginPro Alternatives by Tool
LabPlot
LabPlot is free and open source, and runs on Windows, macOS and Linux. It offers statistics, regression, curve fitting and peak fitting, with multi-format import and export. Use it when peak fitting is part of your analysis, or when you want an interactive Python, R or Julia notebook alongside your plots.
SciFig: charts, illustrations and flowcharts in one place
code.py. A DataChart result can be converted to SVG and edited in Figure Editor when a label or layout needs to change.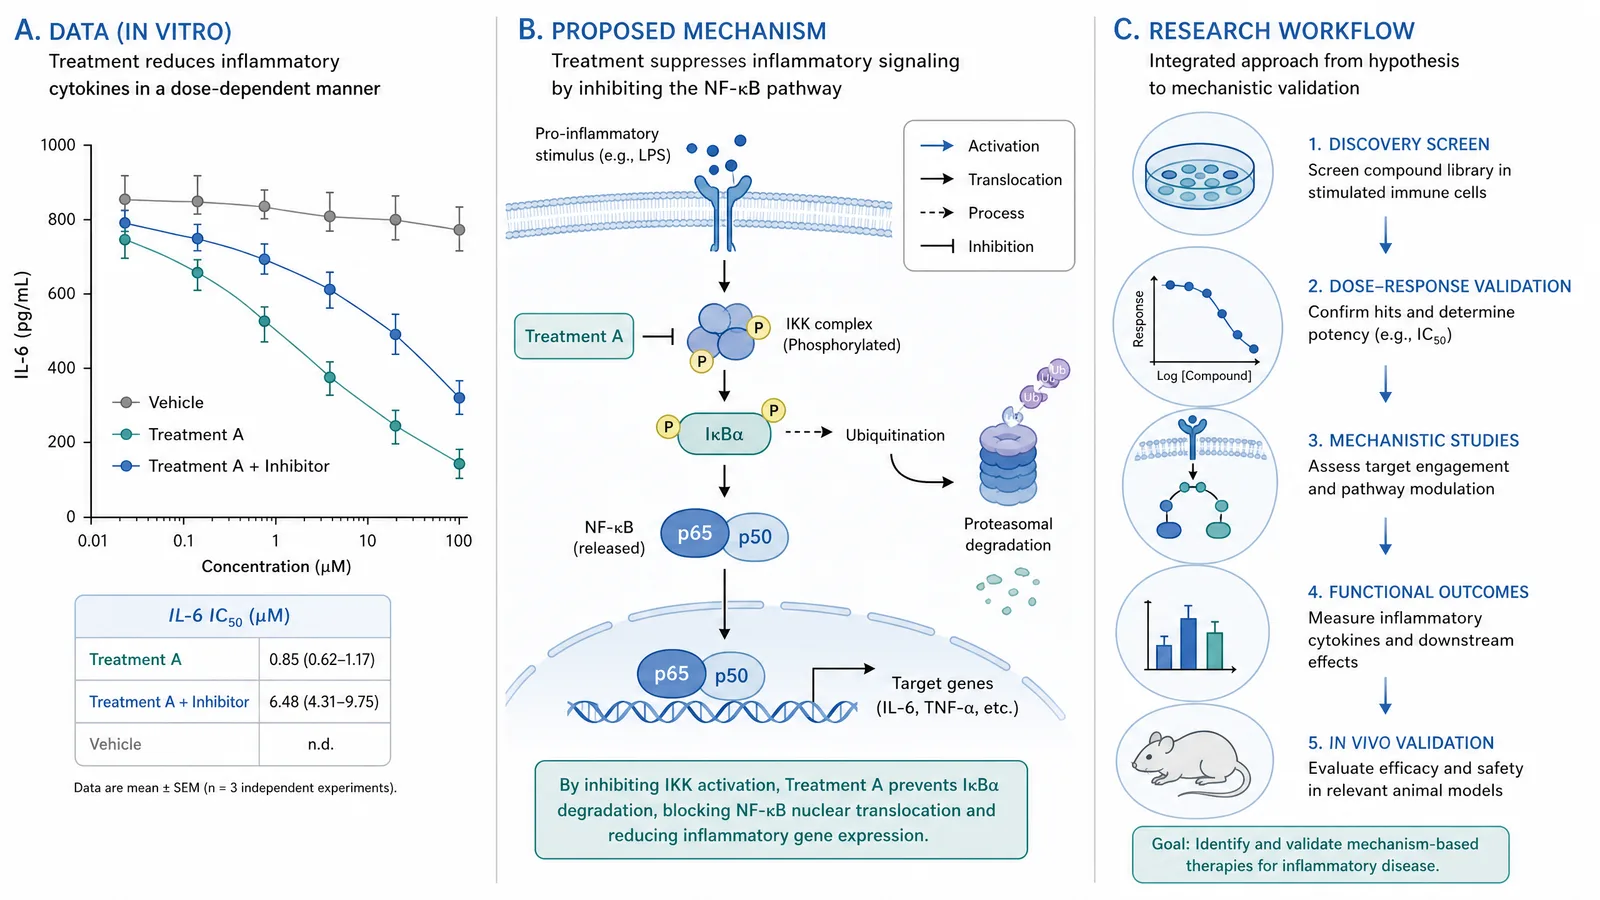
SciDAVis and Veusz
SciDAVis is free and is used for scientific data analysis and visualization.
Veusz is free and runs on Windows, Linux/Unix and macOS. It fits functions to data and exports vector formats including PDF, PostScript, SVG and EMF, as well as bitmaps. Use it when you need a fitted plot in a vector format; it can also be used as a Python module.
Python and Matplotlib
GraphPad Prism
GraphPad Prism is a paid desktop package for Windows and Mac with statistical analysis and curve fitting. Student pricing is $142/year for Standard and $213/year for Pro; academic Standard is $265/year and business Standard is $530/year, and a free trial is available. It fits a lab that has already standardized on Prism files. For a publication graph from a table without a desktop license, SciFig DataChart (charts and graphs from your data) provides named fitting models, group comparisons and journal-format exports.
When to Keep OriginPro
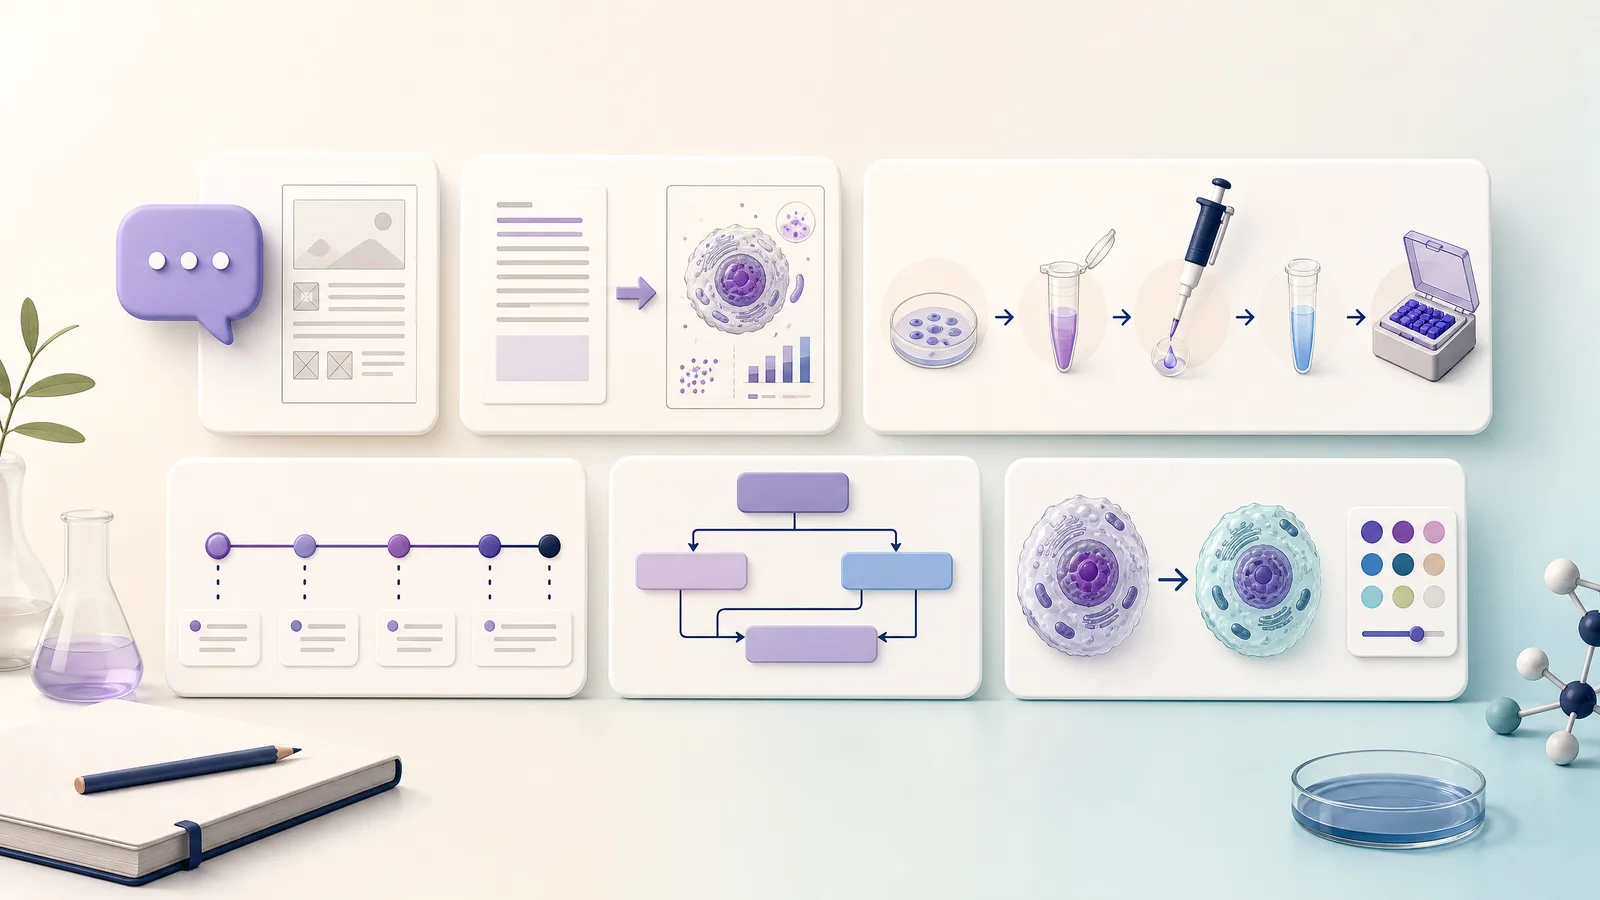
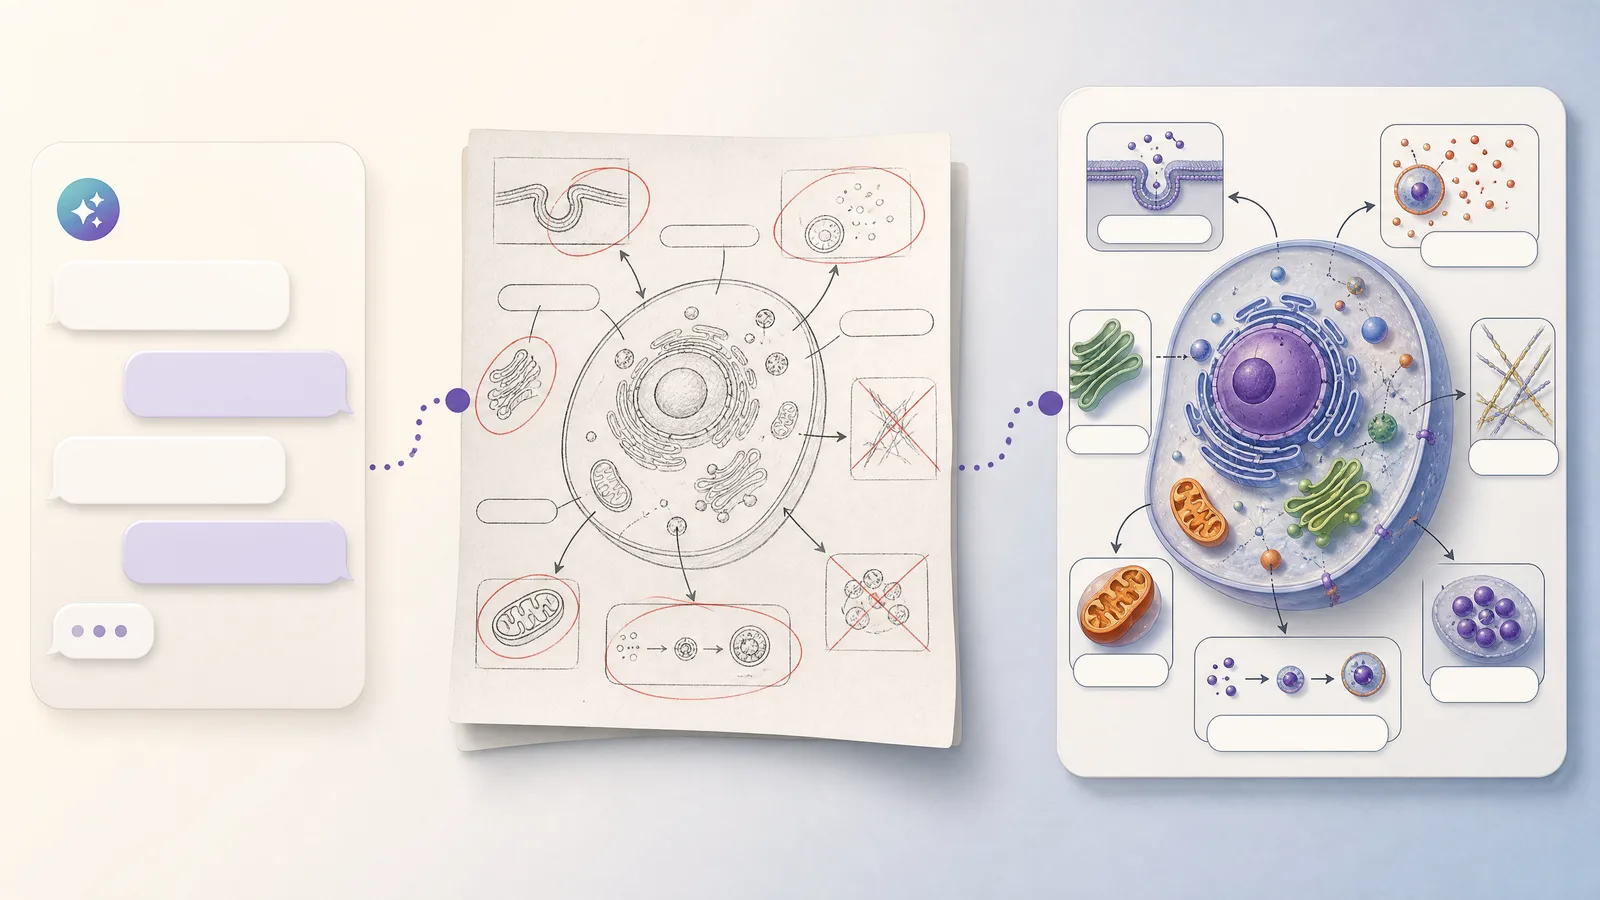
Keep OriginPro when your work depends on peak analysis, 3D surfaces or contour plots, batch processing and scripts, or existing Origin project files; SciFig does not cover these. For the named fits and graphs above, a lab can still use SciFig DataChart (charts and graphs from your data) alongside OriginPro, and SciFig AI Illustration or SciFig FlowChart for the other panels of the paper.
Which OriginPro Alternative Should You Choose?
- LabPlot: choose it for peak fitting or interactive Python, R or Julia notebooks alongside plots.
- SciDAVis: choose it for free scientific data analysis and visualization.
- Veusz: choose it to fit functions and export plots as vector graphics.
- Python and Matplotlib: choose them with SciPy when your team works in code.
- GraphPad Prism: choose it if your lab already standardizes on a paid desktop statistics package (from $142/year for students).
- SciFig: choose it for charts, curve fits and statistics from your data in the browser, plus illustrations and flowcharts for the same paper. Free to start. Make a chart with SciFig.
How to Move From OriginPro
Start with one graph whose data and fit you understand, and keep the original project available.
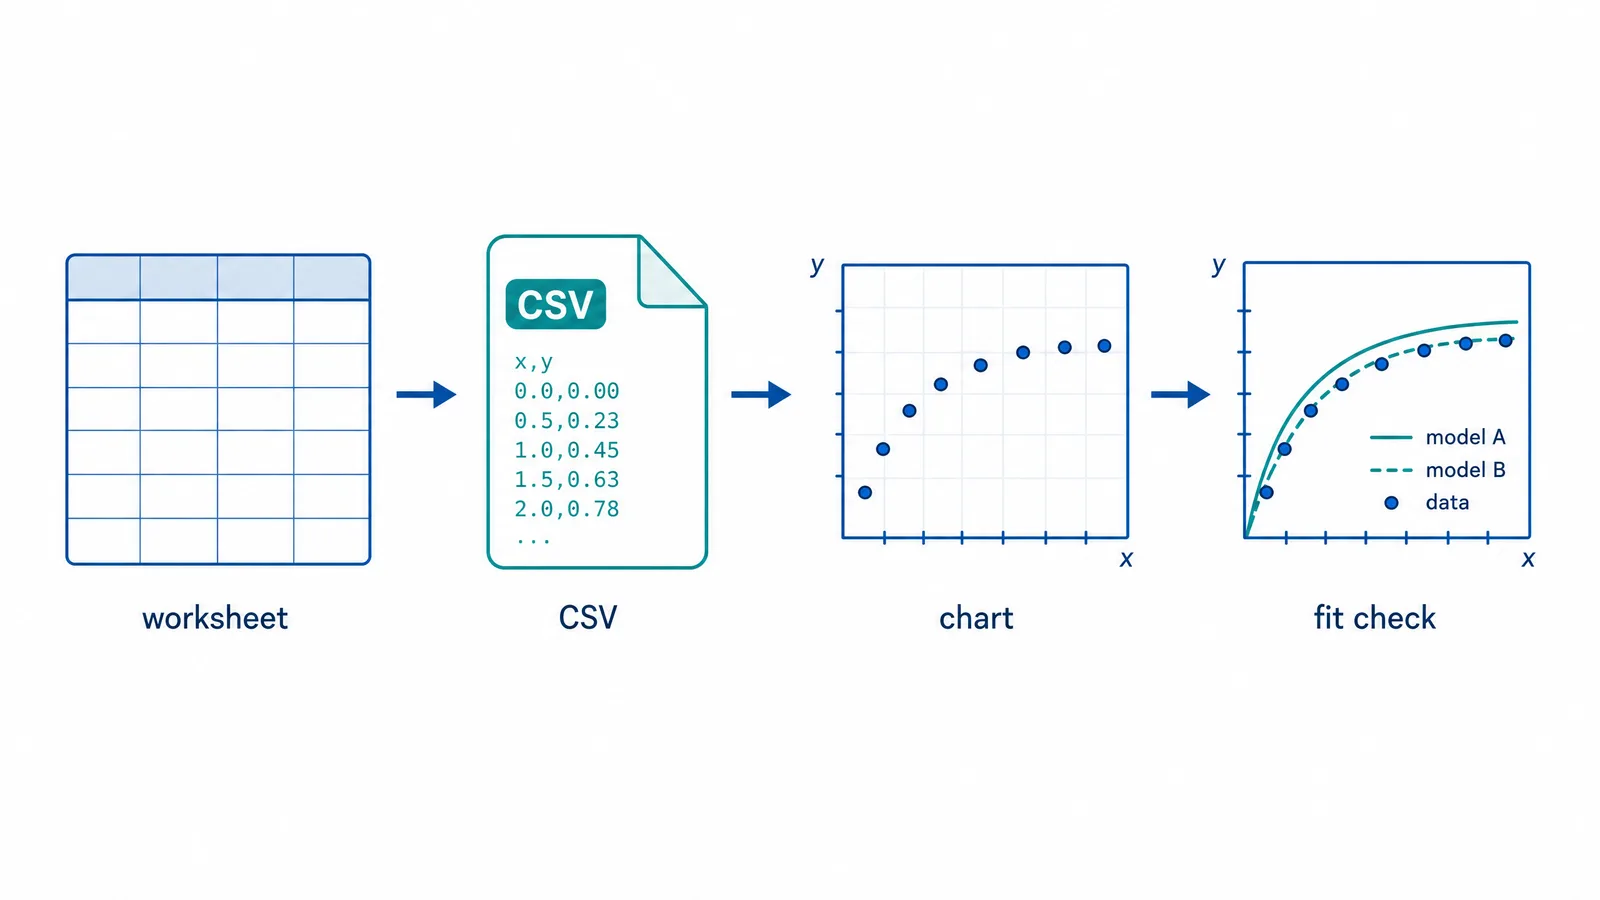
- Export the data table. Take the relevant worksheet data out as CSV or Excel, and note which columns hold the variables or groups for the figure.
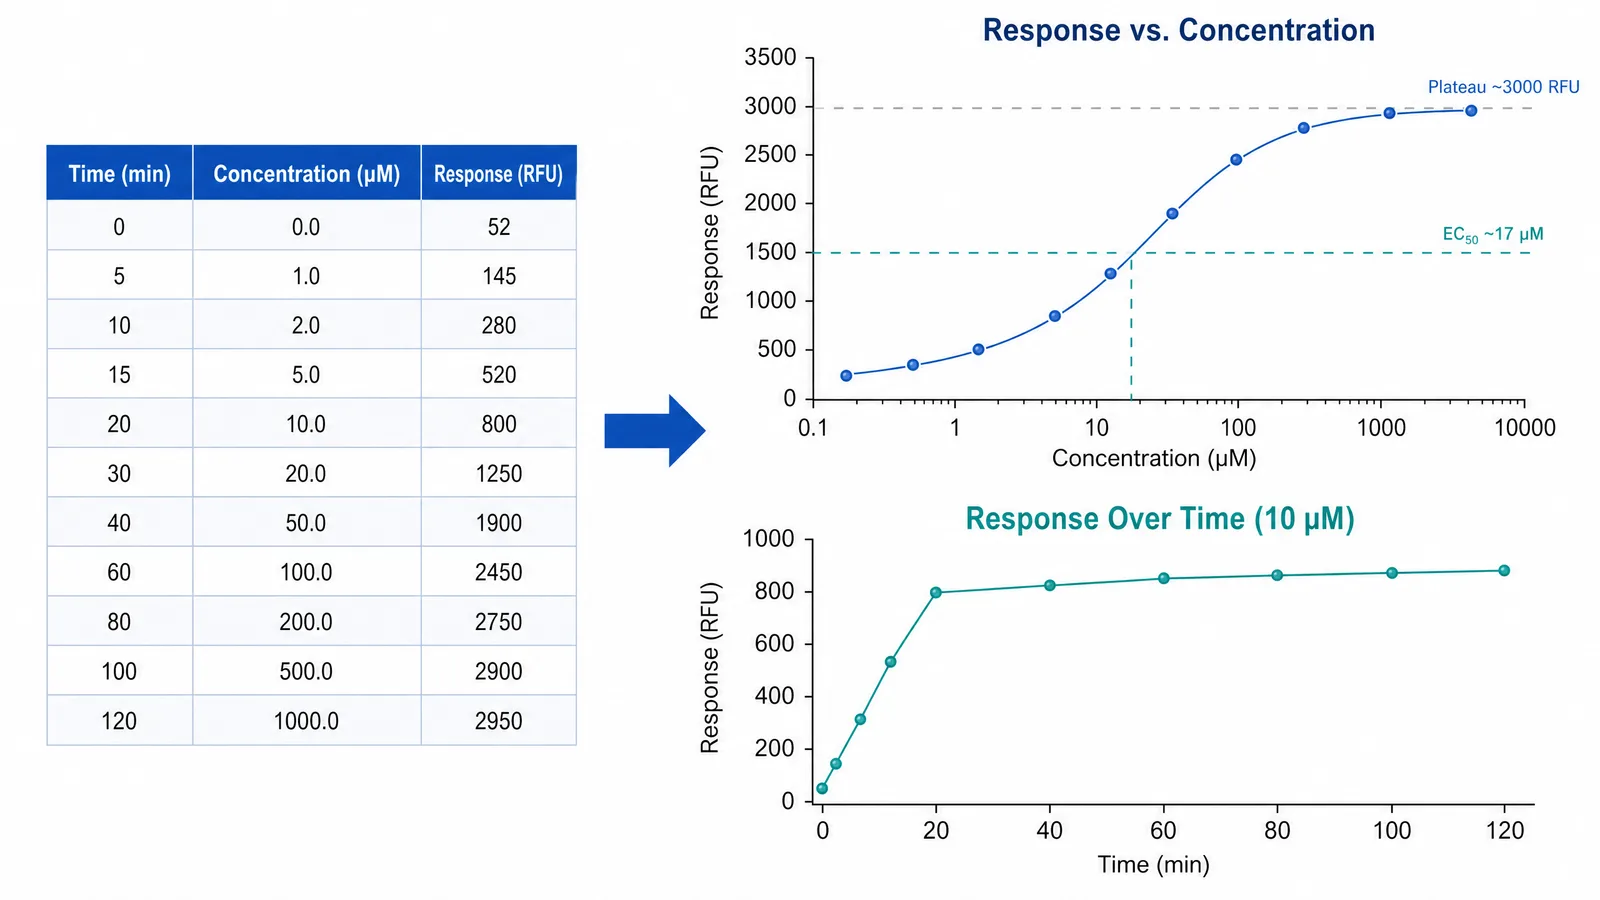
- Recreate one familiar graph. Open the data in your chosen tool. In SciFig DataChart (charts and graphs from your data), upload the CSV, TSV or Excel table and pick the chart type that answers the same question as the original.
- Compare the fit. Use the same model as the original analysis, then compare the fitted parameters and the plotted curve with the OriginPro result. A 4PL dose-response fit and a linear regression answer different questions even if both draw a line.
- Prepare the output. Check the journal's requested file format and resolution. SciFig DataChart provides PDF and EPS as well as 300-DPI PNG and TIFF, and its chart can be converted to SVG for editing.
The worksheet data travels; graphs, analysis settings and scripts saved in the Origin project stay behind and need to be rebuilt.
Create Scientific Figures Now
Describe your scientific figure in natural language — get publication-ready illustrations in minutes.
Try Free