Open source diagram tools for research, compared on licence, offline use, self-hosting, vector export, and keeping diagrams reproducible in version control.
SciFig Team
Scientific Illustration Experts
Open source diagram tools solve two research problems: cost and reproducibility.
Cost is the obvious one, especially for students and for labs outside well-funded institutions. Reproducibility is the more interesting one. A diagram defined as text, under version control, regenerated by a script, is a research artifact in the same sense your analysis code is — and it does not stop working when a licence lapses.
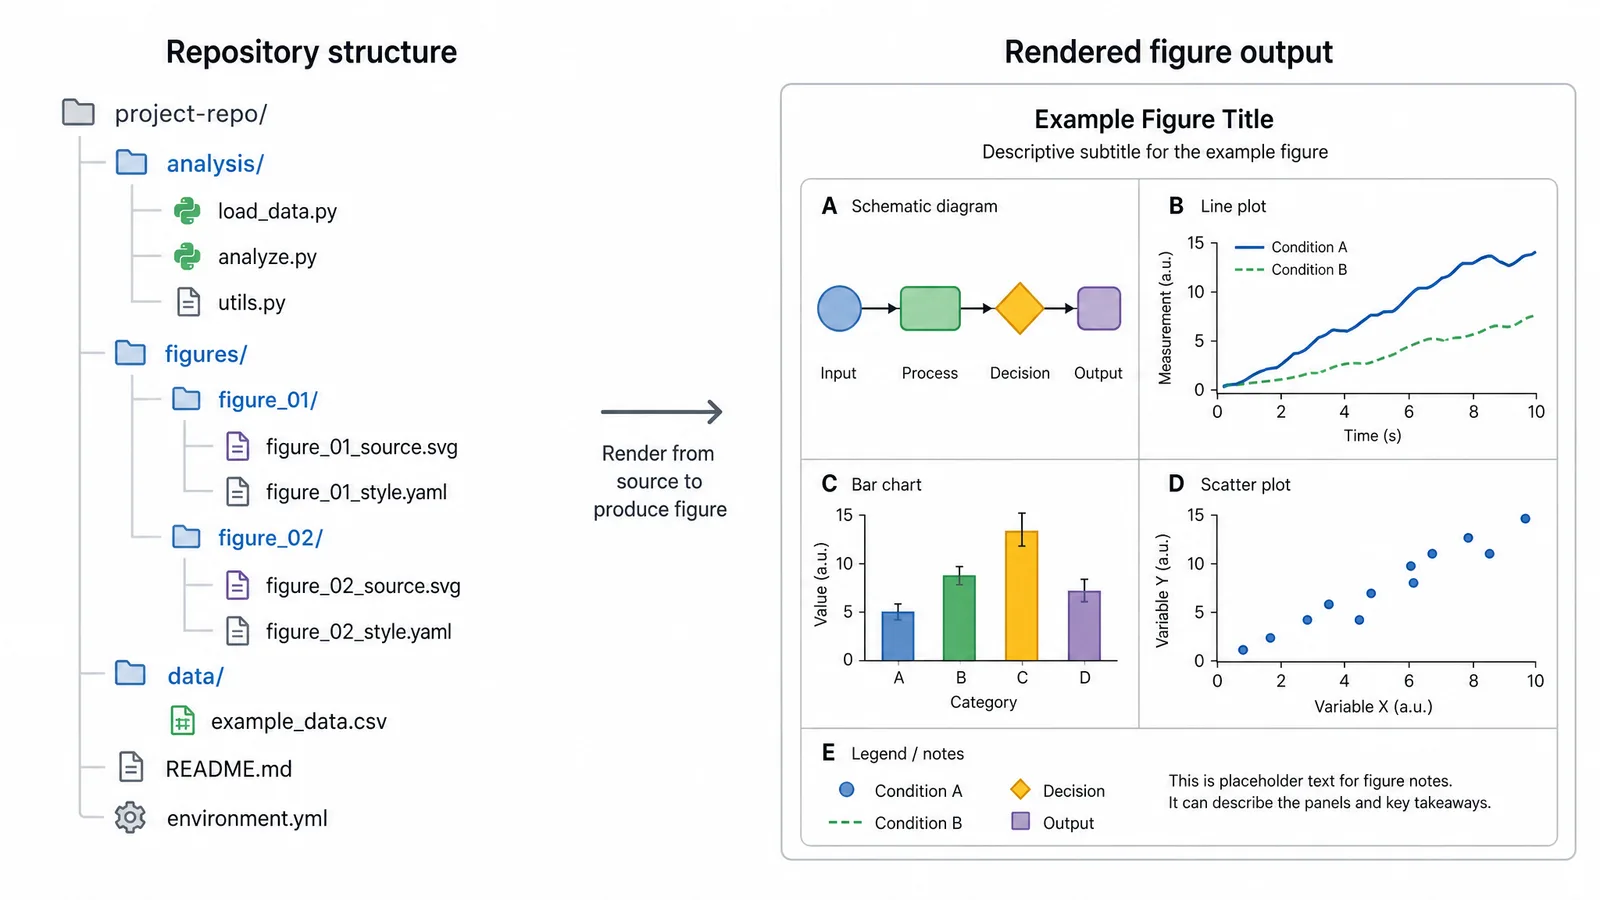
A repository tree showing diagram source files stored alongside analysis code, with the rendered figure output beside it (Figure generated with SciFig)
Three Families
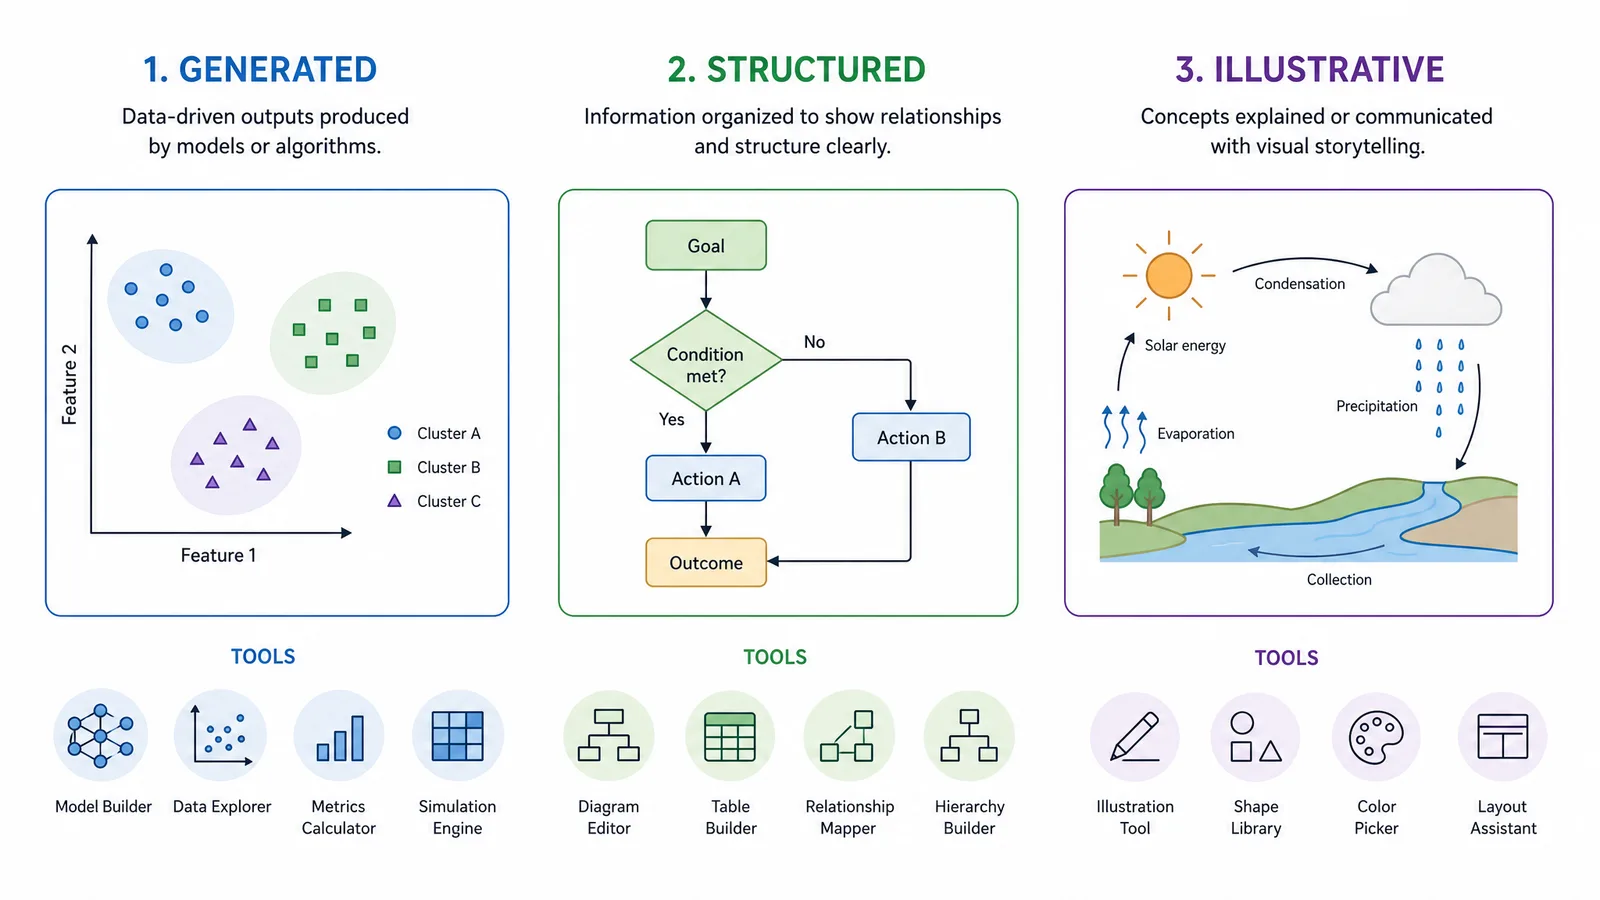
Open source diagram tools split into three groups that suit different jobs.
Family
Tools
You get
You give up
Text-to-diagram
Graphviz, Mermaid, PlantUML, D2
Version control, regeneration, automation
Fine visual control
Direct manipulation
Inkscape, draw.io, Excalidraw, Krita
Precise composition
Reproducibility, diffability
Plot libraries
matplotlib, ggplot2
Data-bound figures, full automation
Suitability for conceptual diagrams
Most research groups end up using one from each family, and the common mistake is trying to force one tool across all three jobs.
See AI Scientific Figure Generation in Action
Watch how researchers create publication-ready scientific figures from text descriptions.
Graphviz is the veteran. You describe nodes and edges in DOT and it computes the layout. For anything graph-shaped — pathways, dependency structures, phylogenies, state machines — it produces a defensible layout without manual fiddling, and exports SVG and PDF.
Mermaid trades some layout power for readability and renders natively in many Markdown environments, which makes it convenient for documentation and lab notebooks.
PlantUML targets software diagrams — sequence, class, component — and is the right choice if you are documenting a computational pipeline.
D2 is the newest and has the strongest layout engine of the four, with a syntax designed to stay readable as diagrams grow.
Direct Manipulation
Inkscape is the reference open source vector editor. Full SVG control, exports PDF and EPS at journal requirements, handles CMYK conversion. It is where figures should finish when appearance matters. The interface takes real time to learn.
draw.io is faster for structured diagrams and requires almost no learning. Open XML format, runs offline.
Excalidraw is for thinking rather than finishing, with a deliberately provisional hand-drawn look.
Krita is a raster painting application, relevant when a figure needs illustration rather than diagramming — anatomical drawings, textured biological structures.
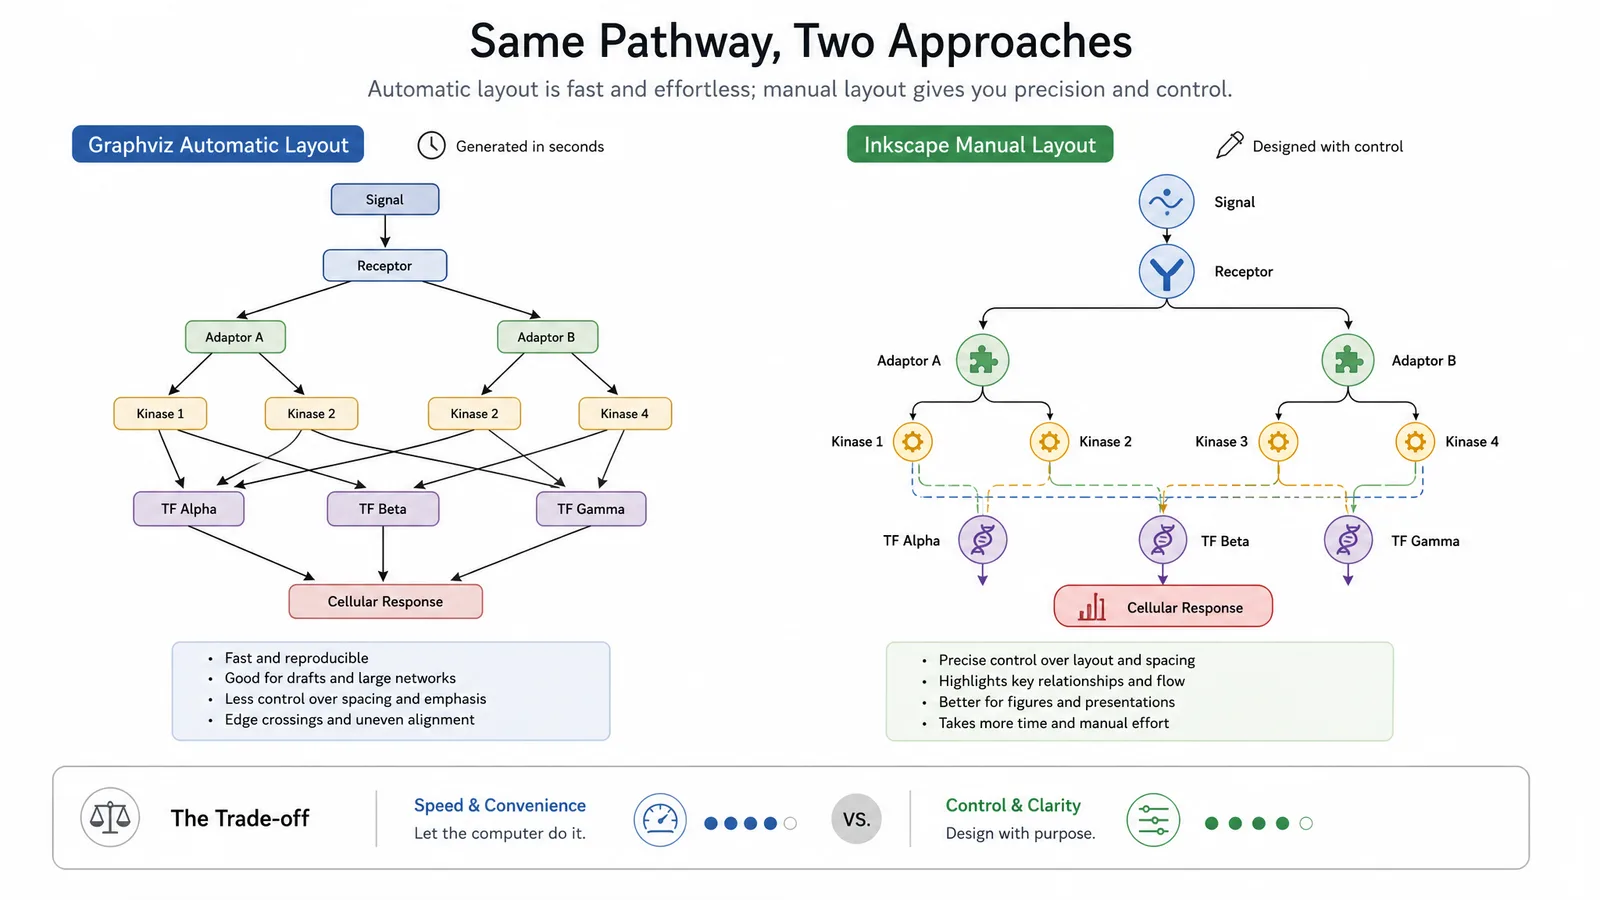
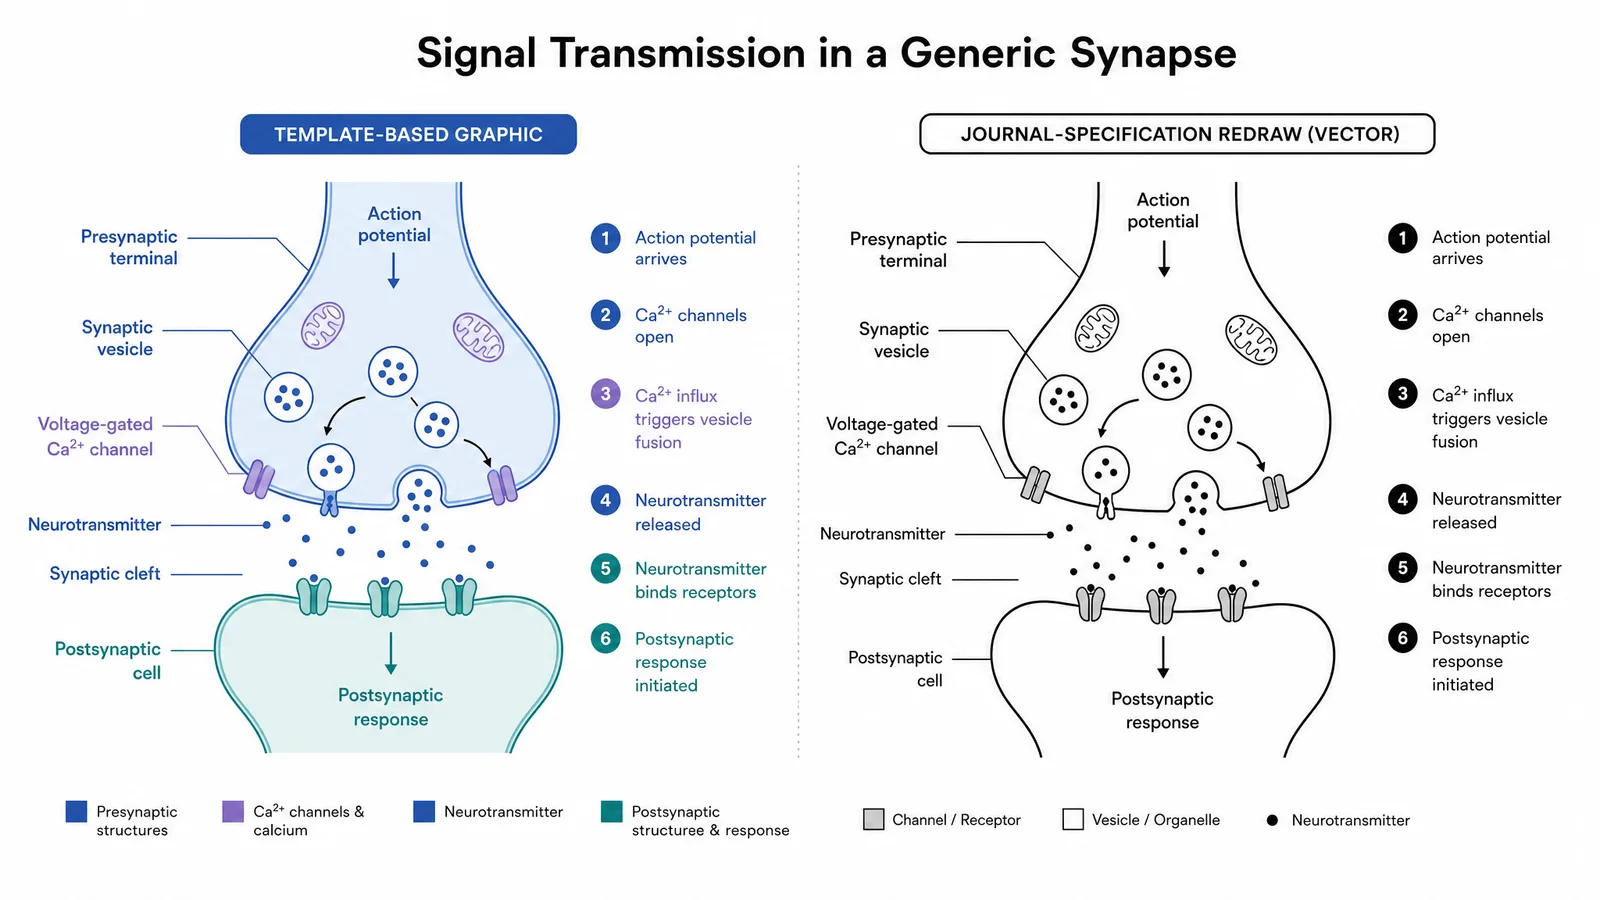
A comparison of the same pathway rendered by Graphviz automatic layout and by hand in Inkscape, showing the trade-off between speed and control (Figure generated with SciFig)
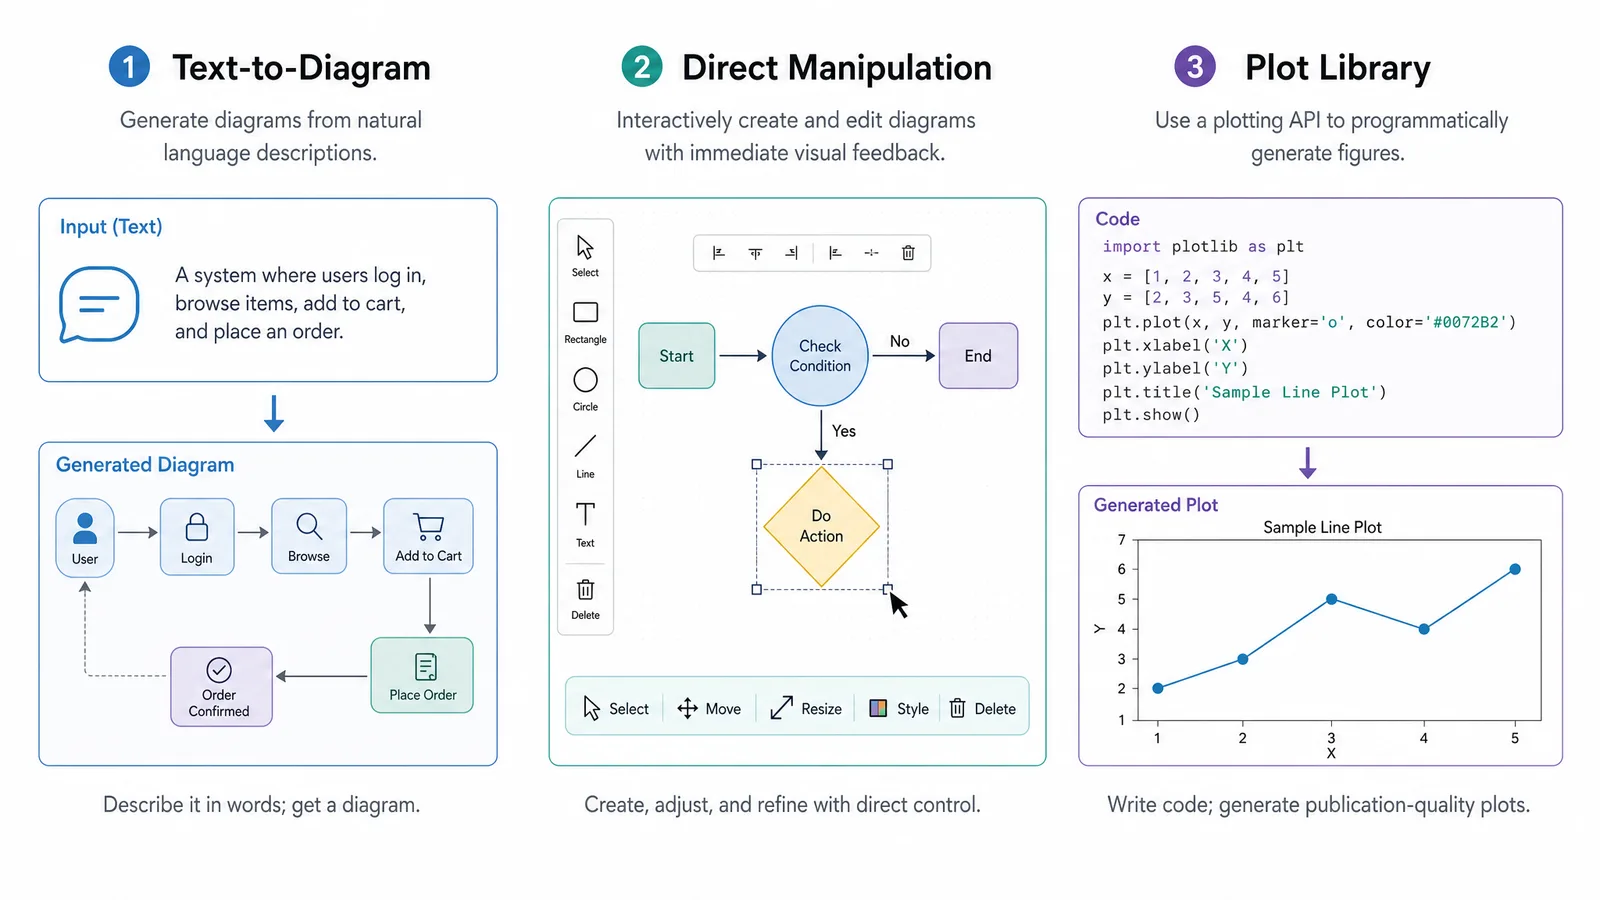
Three example diagrams representing the text-to-diagram, direct manipulation, and plot library families (Figure generated with SciFig)
Reproducibility in Practice
The concrete benefit of a text-defined diagram is that it participates in your existing workflow:
Diffs are meaningful. A pull request shows that one edge was added, not that a binary file changed.
Regeneration is automatic. If the diagram is generated from a data file, updating the data updates the figure.
Provenance is preserved. The commit history records who changed what and why.
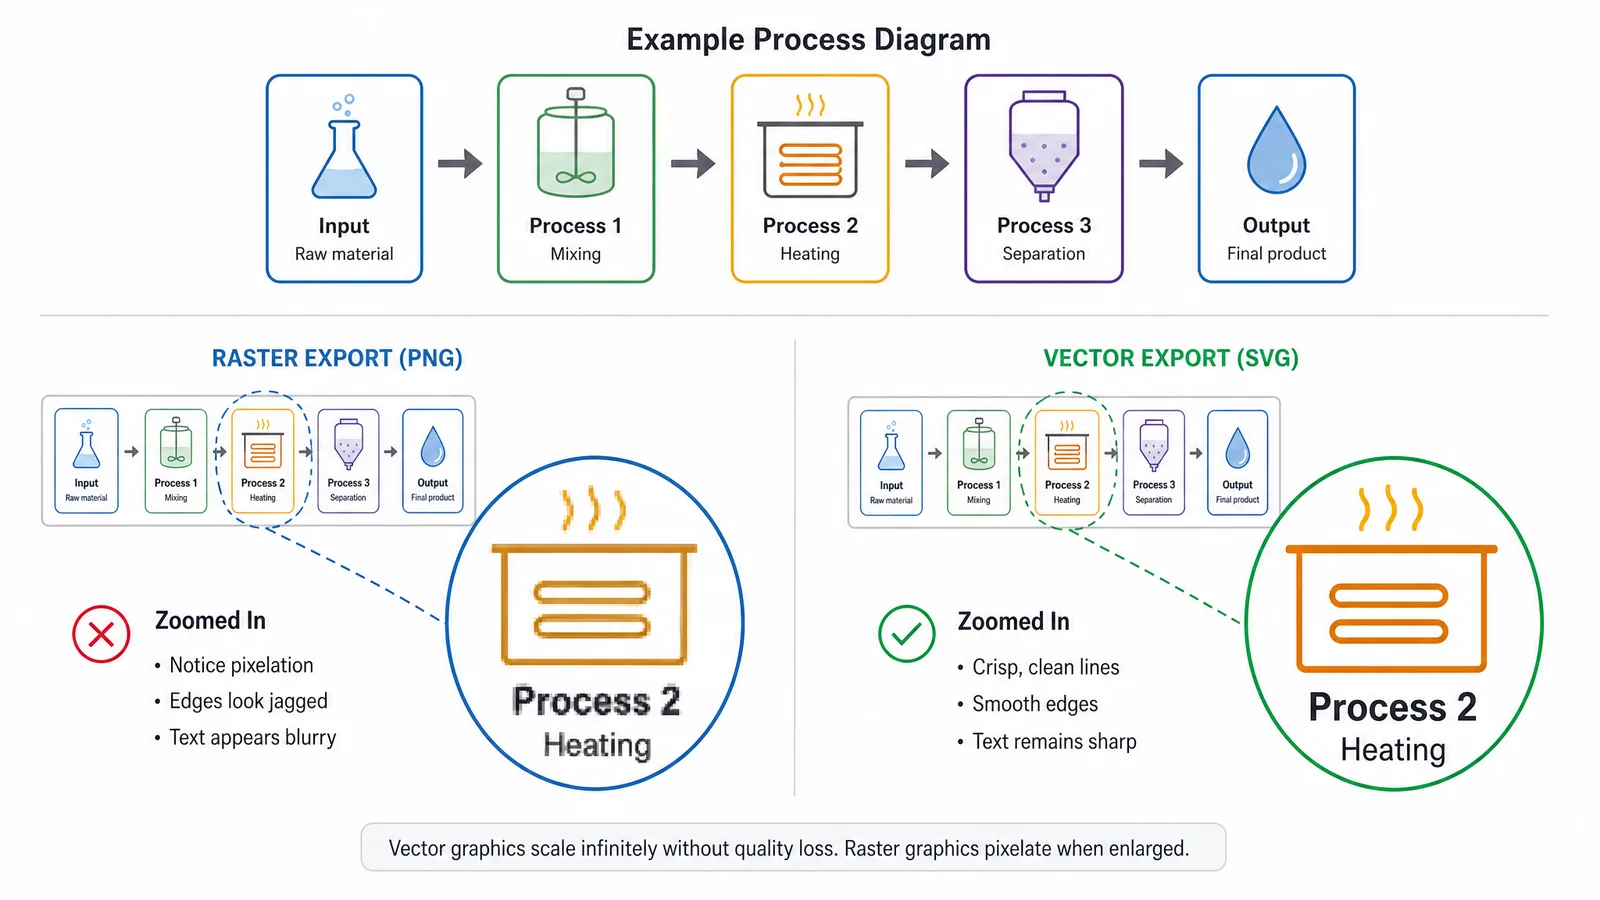
The limit is aesthetic. Automatic layout produces defensible diagrams, not beautiful ones. A pragmatic pattern is to generate structure automatically, export SVG, and do a final pass in Inkscape — accepting that the last step breaks regeneration, and doing it only once the science is settled.
Tip
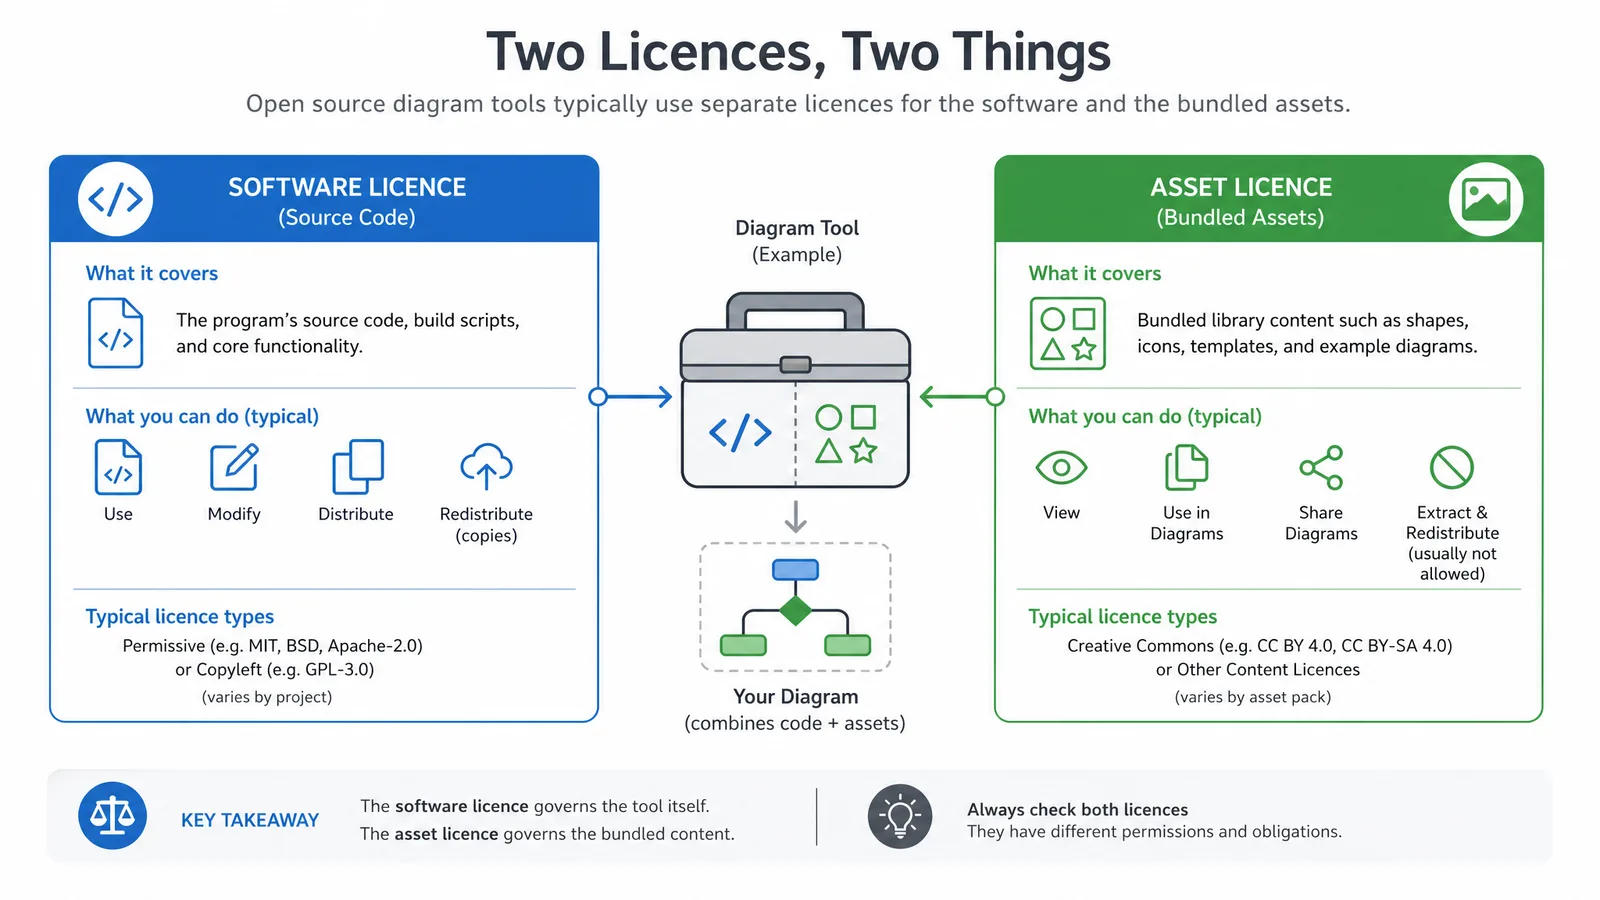
Check licences before publishing, not after. Most of these tools are GPL, MPL, or Apache licensed and place no restriction on the figures you create, but a few icon and font libraries bundled with them carry separate terms. The tool's licence and the asset's licence are different things.
Create Scientific Figures Now
Describe your scientific figure in natural language — get publication-ready illustrations in minutes.
When you want structure without writing DOT syntax, text to diagram generator produces an editable diagram from plain language, and text to figure handles publication figures. Our BioRender alternatives comparison covers the figure-library category alongside these.
A diagram distinguishing the software licence from the bundled asset licence for open source diagram tools (Figure generated with SciFig)
There is no single best. Graphviz and D2 lead for generated structural diagrams, Inkscape for final publication artwork, and draw.io for quick structured diagrams. Most research groups use one from each category.
Yes. Inkscape and draw.io export SVG, PDF, and EPS at journal specifications, and Graphviz and D2 export vector formats directly. No major publisher restricts which software produced a figure.
Diagrams stored as text diff meaningfully in version control, regenerate automatically when underlying data changes, and carry commit history as provenance. The trade-off is reduced control over fine visual composition.
For scientific figures, yes. It provides full vector editing, journal-grade export formats, and CMYK conversion. Its interface is less polished, which mainly costs learning time rather than capability.
The tools generally do not. However, icon sets, fonts, and template assets bundled with a tool may carry their own licences, so check the asset terms separately from the software terms before publishing.
Graphviz or D2, because both compute layouts automatically. Manual placement stops being practical beyond roughly thirty nodes, and automatic layout also produces a more defensible arrangement.
Keep going
Recommended resources
Templates, tools, and further reading for your research