EdrawMax competes on template volume; its alternatives compete on output quality.
That framing helps because template count is the wrong metric for research work. A library of thousands of business templates rarely contains the diagram a specific study needs, and what matters instead is whether the export survives a journal's requirements and whether the file stays editable when a reviewer asks for a change.
Judge on Export, Not on Template Count
Four criteria separate diagram tools for academic use:
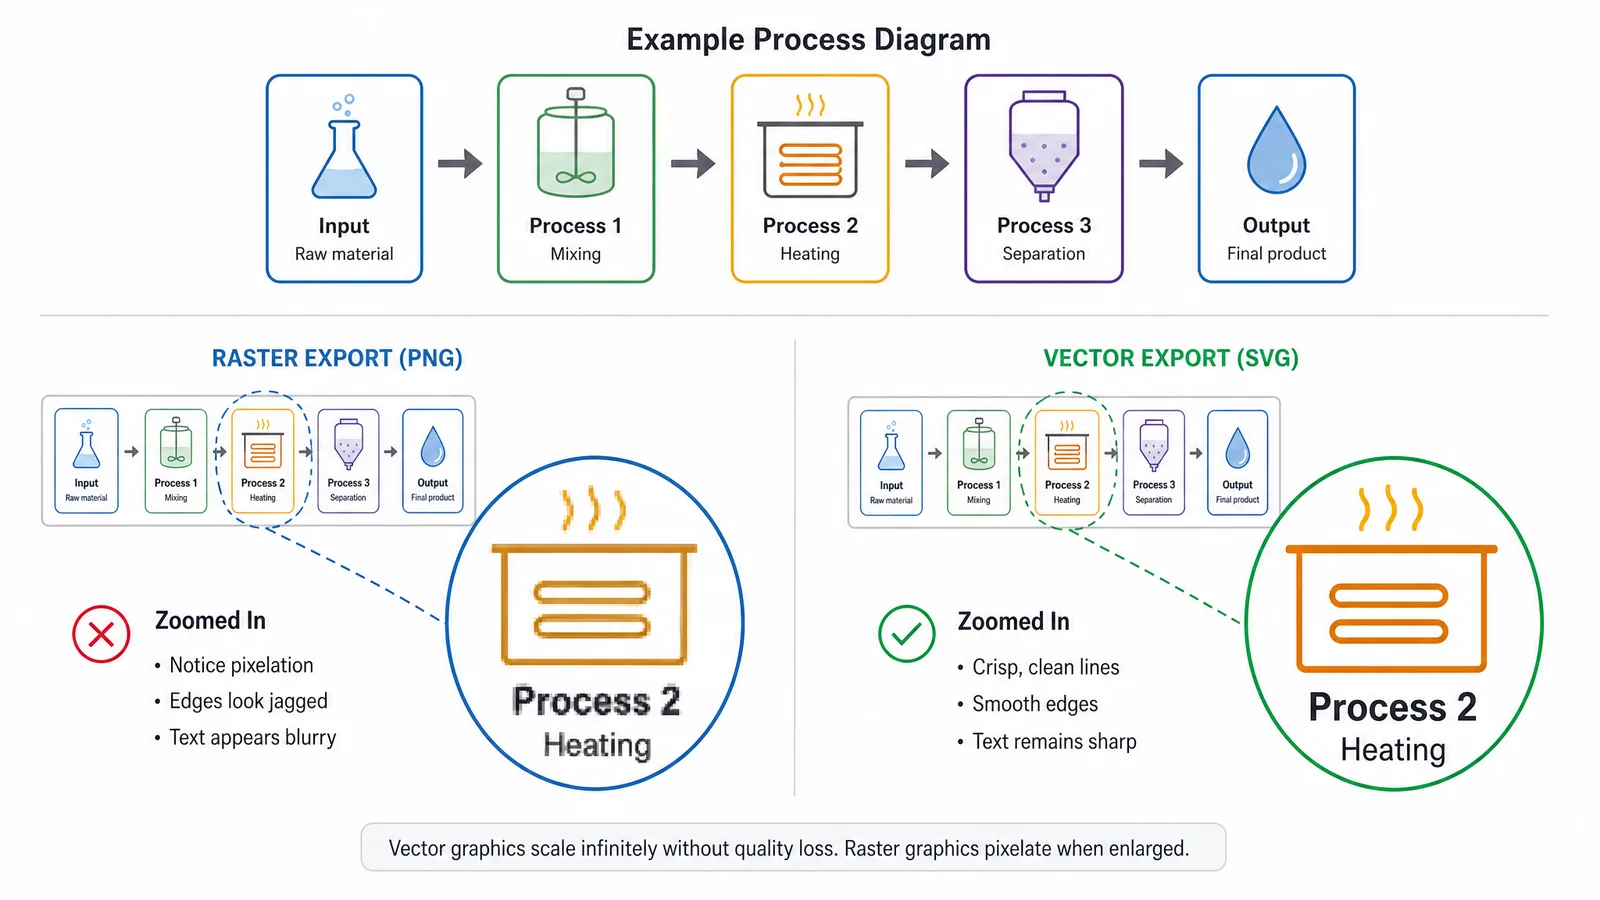
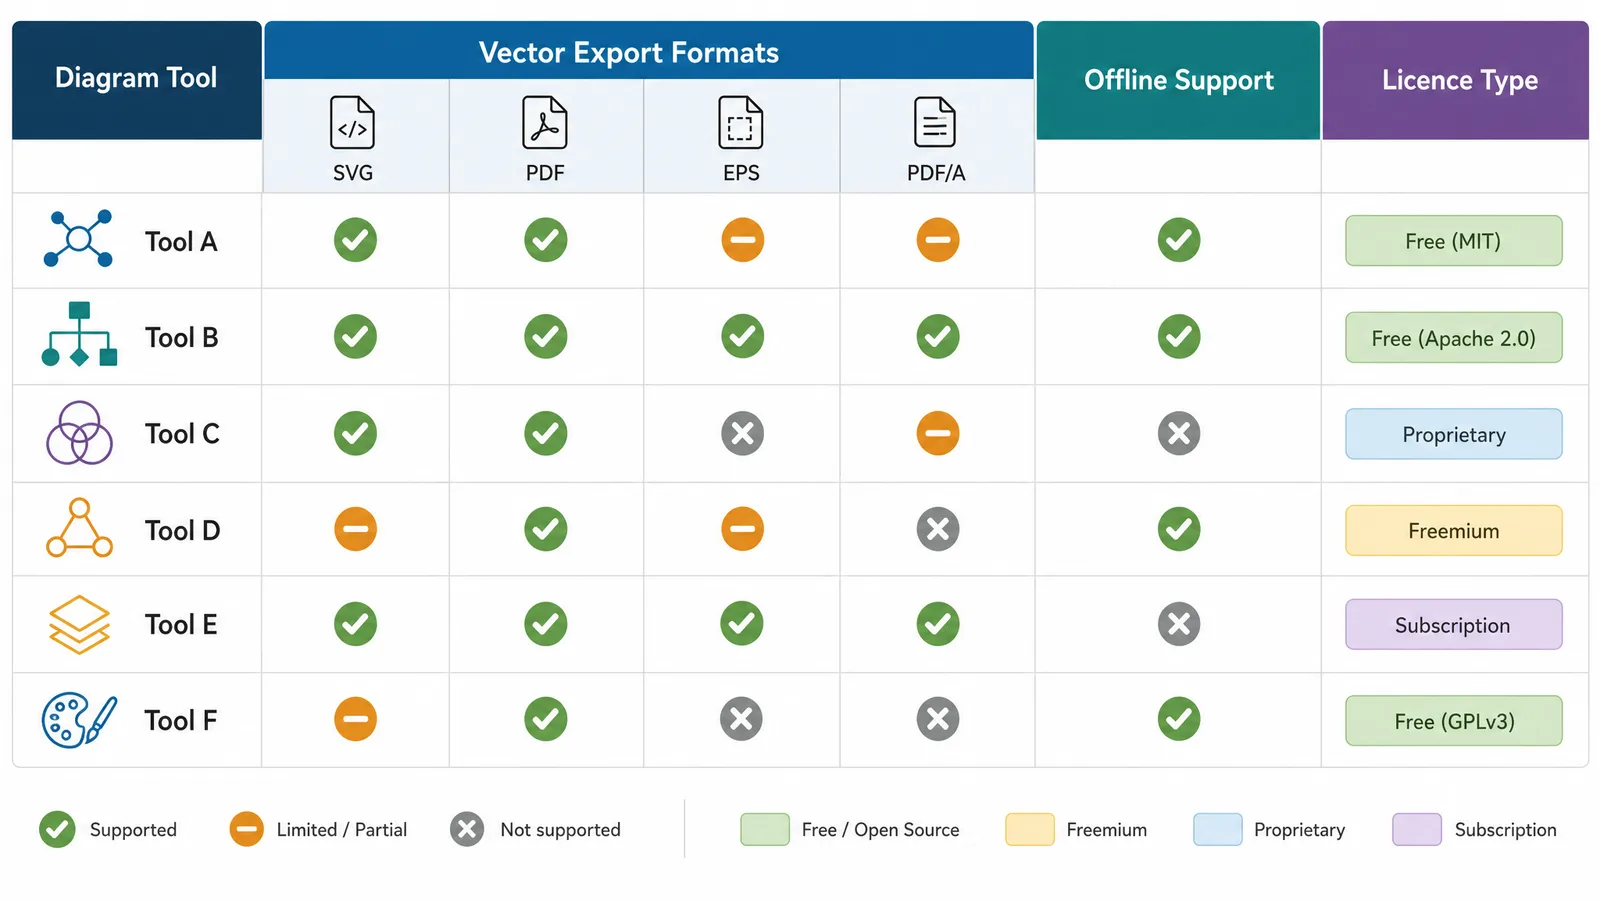
- Vector export. SVG, PDF, or EPS. Raster-only export fails most journal requirements for a scientific figure.
- File portability. Can a collaborator open the source without buying the same licence?
- Offline operation. Needed for fieldwork, secure environments, and unreliable connections.
- Licensing clarity. Perpetual, subscription, or open source — and whether output is usable commercially.
The Alternatives Compared
| Tool | Licence | Offline | Vector export | Strongest at |
|---|---|---|---|---|
| draw.io / diagrams.net | Open source | Yes | SVG, PDF | General technical diagrams |
| Inkscape | Open source | Yes | SVG, PDF, EPS | Final publication artwork |
| Lucidchart | Subscription | Limited | SVG, PDF | Team flowcharts |
| yEd | Free | Yes | SVG, PDF | Large auto-laid-out graphs |
| Graphviz | Open source | Yes | SVG, PDF | Scripted, reproducible graphs |
| Mermaid | Open source | Yes | SVG | Diagrams in version control |
| Affinity Designer | Perpetual | Yes | SVG, PDF, EPS | Illustration-grade artwork |
See AI Scientific Figure Generation in Action
Watch how researchers create publication-ready scientific figures from text descriptions.
Explore the Tooldraw.io / diagrams.net
The closest like-for-like replacement. Free, available as a desktop application, exports clean SVG and PDF, and stores files in an open XML format so collaborators are not locked out. It lacks EdrawMax's decorative template breadth, which for research work is rarely a loss.
yEd
Underrated for anything graph-shaped. Its automatic layout algorithms handle networks with hundreds of nodes far better than manual placement, which makes it the practical choice for interaction networks, dependency graphs, and large hierarchies.
Graphviz and Mermaid
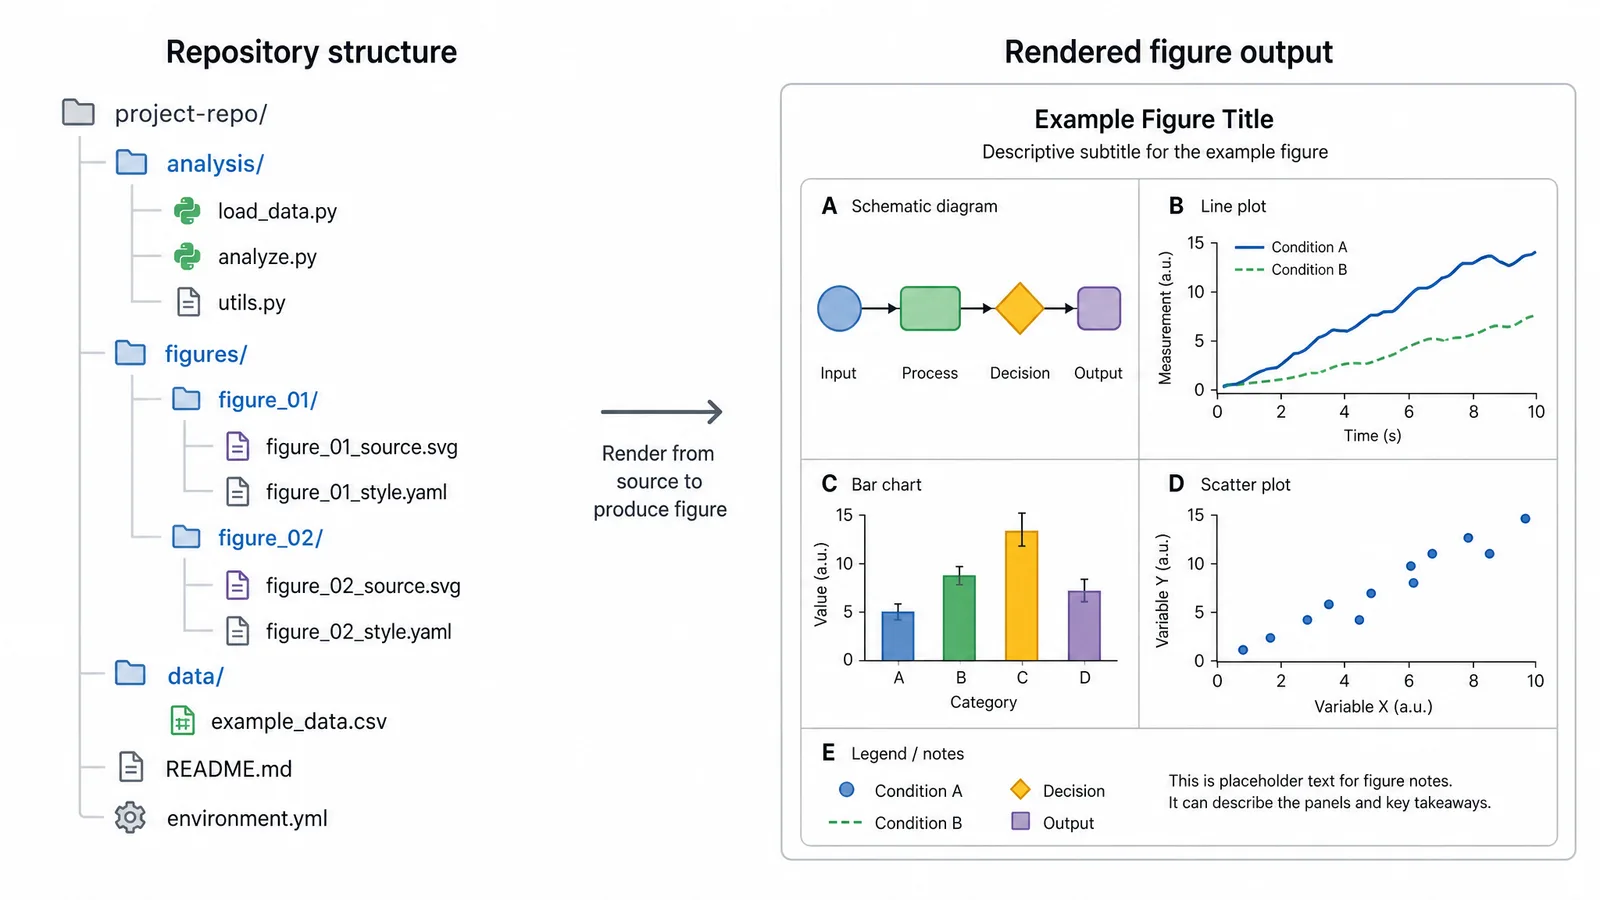
Both generate diagrams from text. That property is worth more than it first appears in research: the diagram lives in your repository, diffs meaningfully in version control, and regenerates automatically when the underlying data changes. Layout control is limited, so they suit structural diagrams rather than carefully composed figures.
Inkscape and Affinity Designer
Where figures should finish when appearance matters. Both give full vector control and export at journal specifications. Inkscape is free with a steeper interface; Affinity Designer is a one-time purchase with a gentler one.
The Lock-In Question
Proprietary diagram formats are a slow-acting problem. Figures outlive the projects that created them: a reviewer asks for a change eighteen months later, a follow-up paper reuses a panel, a thesis collects figures made across four years. If the source file only opens in software with a lapsed licence, the figure has to be rebuilt.
Prefer tools that write open formats. SVG is readable by many applications and by future ones. A text-based format such as Graphviz or Mermaid is even more durable, since it is diffable and regenerable indefinitely.
Tip
Archive both the source file and a PDF export alongside the manuscript, not just the raster image you submitted. The PDF preserves vector quality and the source preserves editability, and together they cost a few megabytes.
Create Scientific Figures Now
Describe your scientific figure in natural language — get publication-ready illustrations in minutes.
Try Free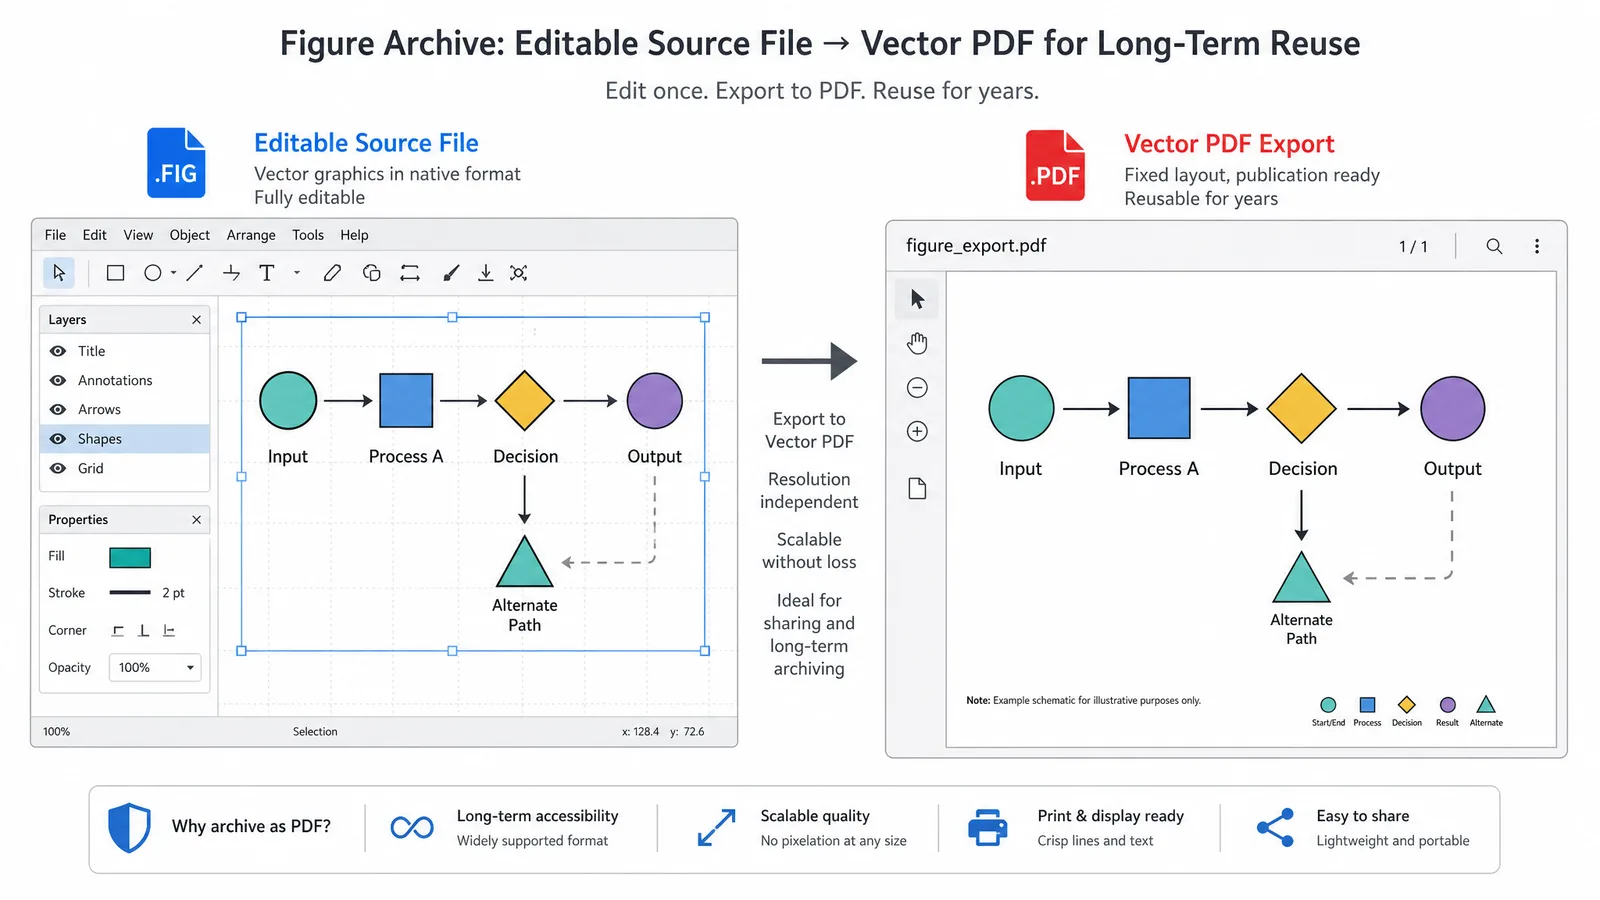
Related Reading
Related reading: 7 Best BioRender Alternatives in 2026 (Free & Paid), 10 Best Scientific Illustration Tools in 2026.