Diagram software compared for research use across generated, structured, and illustrative work, with export formats, licensing, and reproducibility trade-offs.
SciFig Team
Scientific Illustration Experts
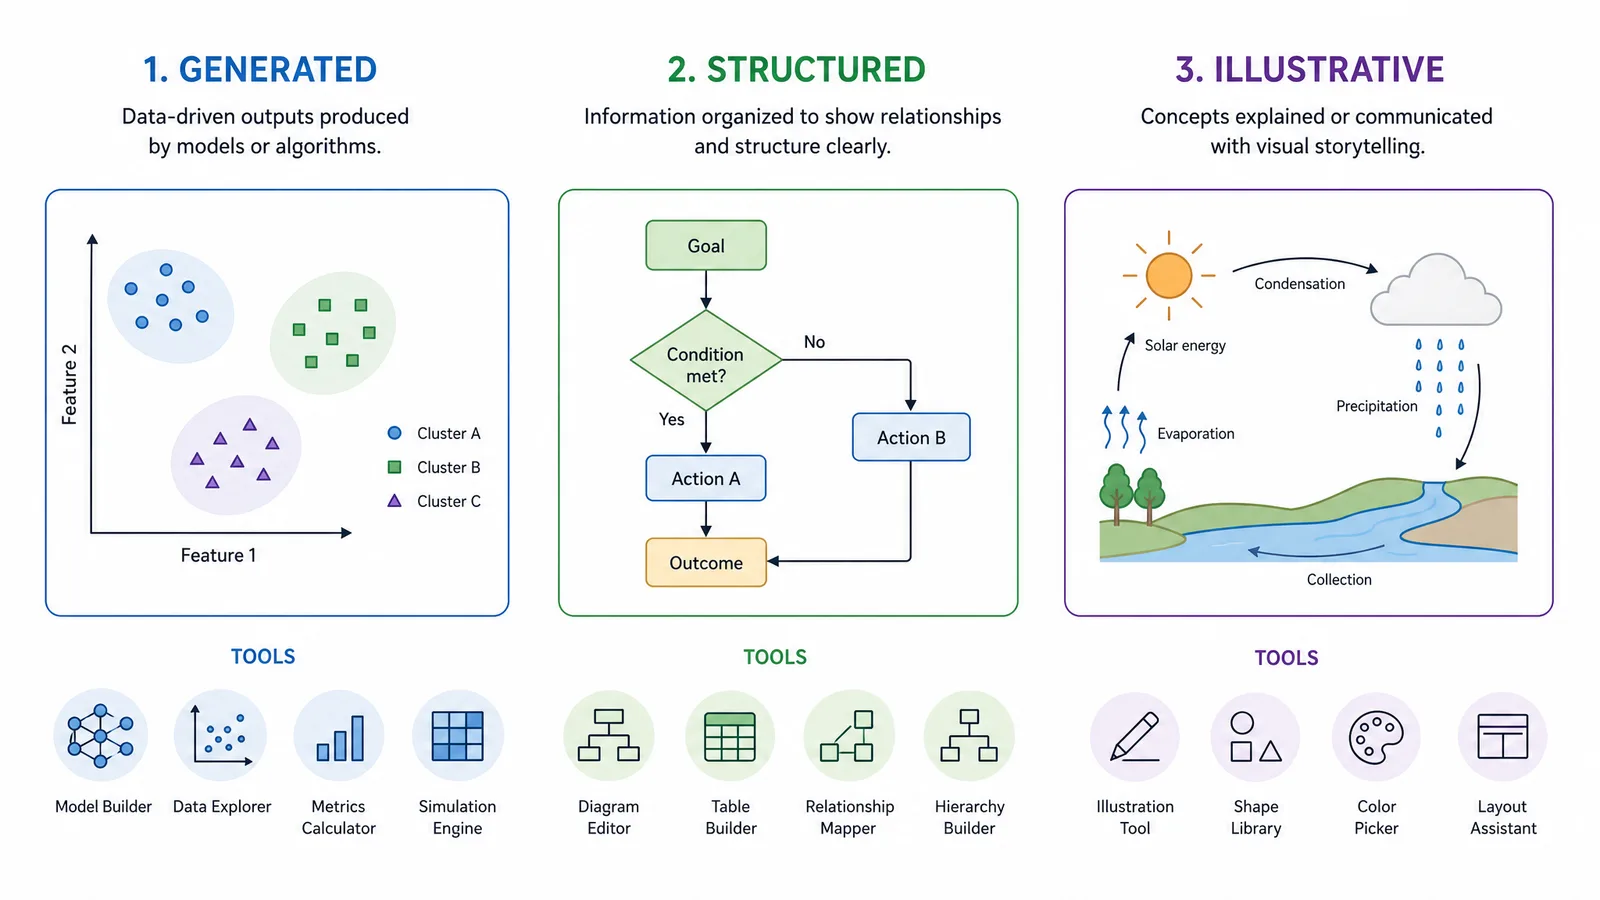
Diagram software divides into generated, structured, and illustrative categories.
Choosing well is mostly a matter of identifying which category your diagram belongs to before comparing products. Almost every complaint that a tool is "clunky" or "too limited" turns out to be a category mismatch: someone using an illustration tool for a generated graph, or a text-to-diagram tool for a figure that needed compositional control.
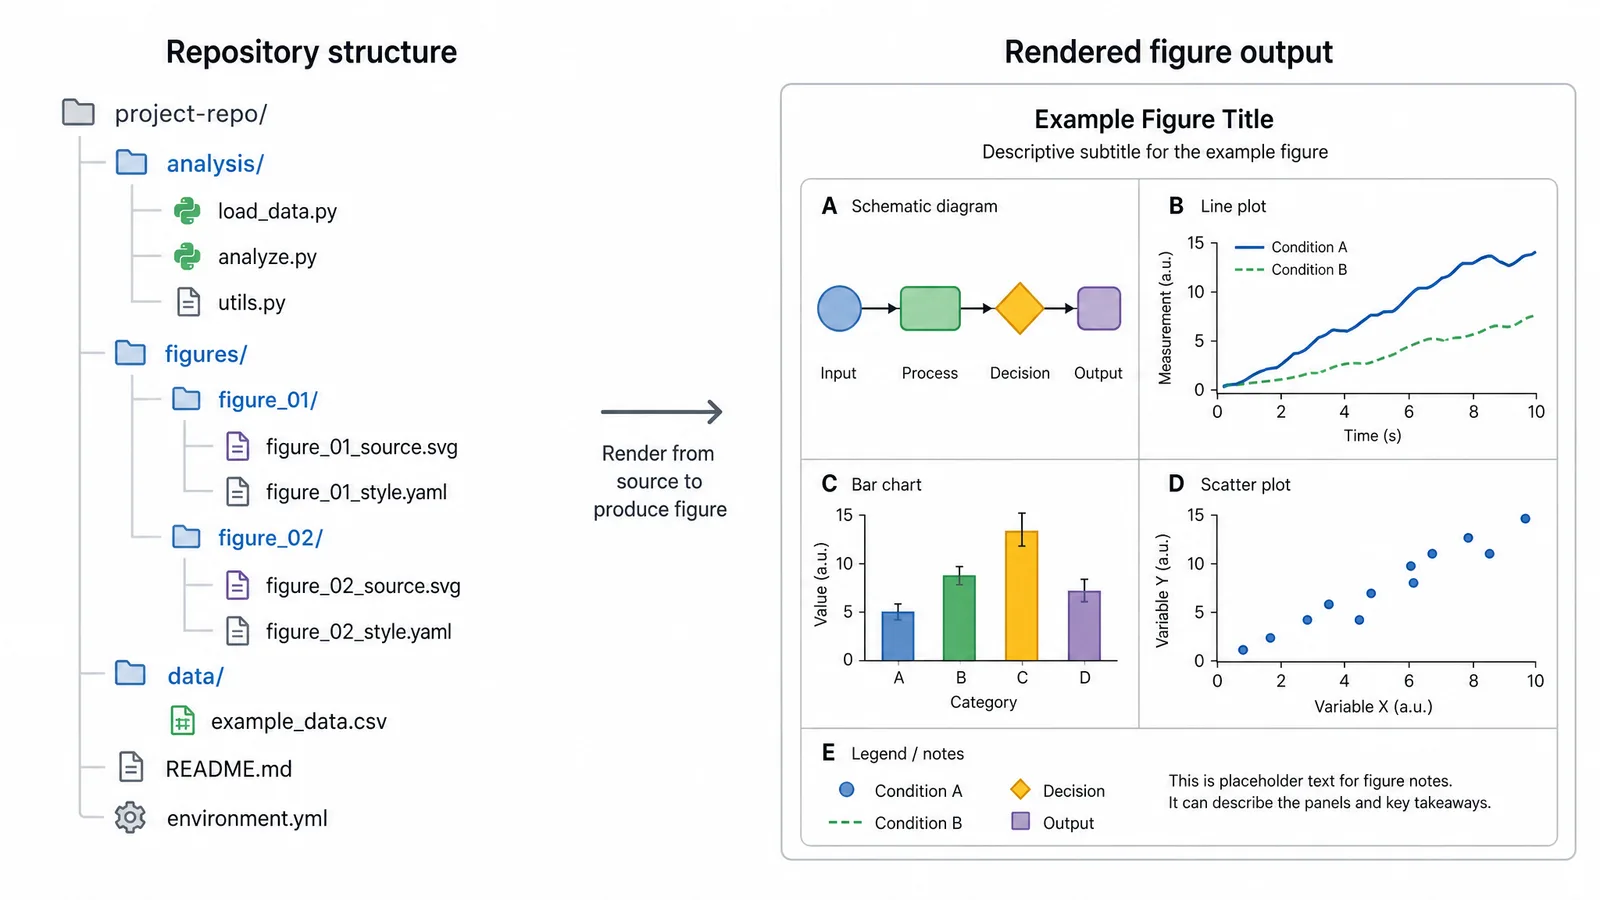
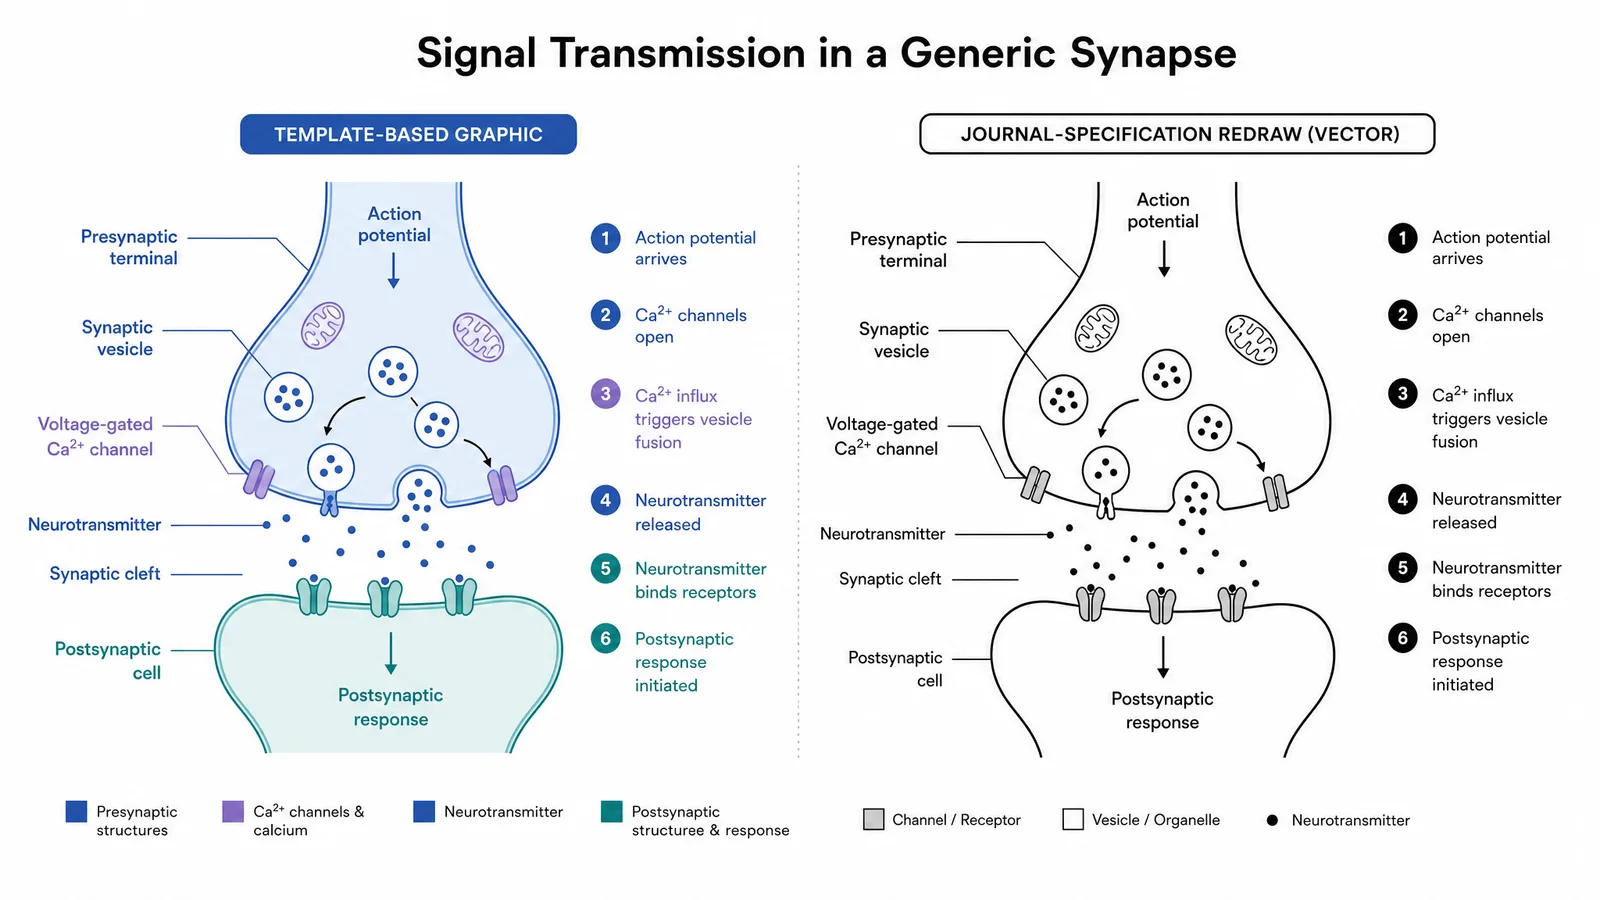
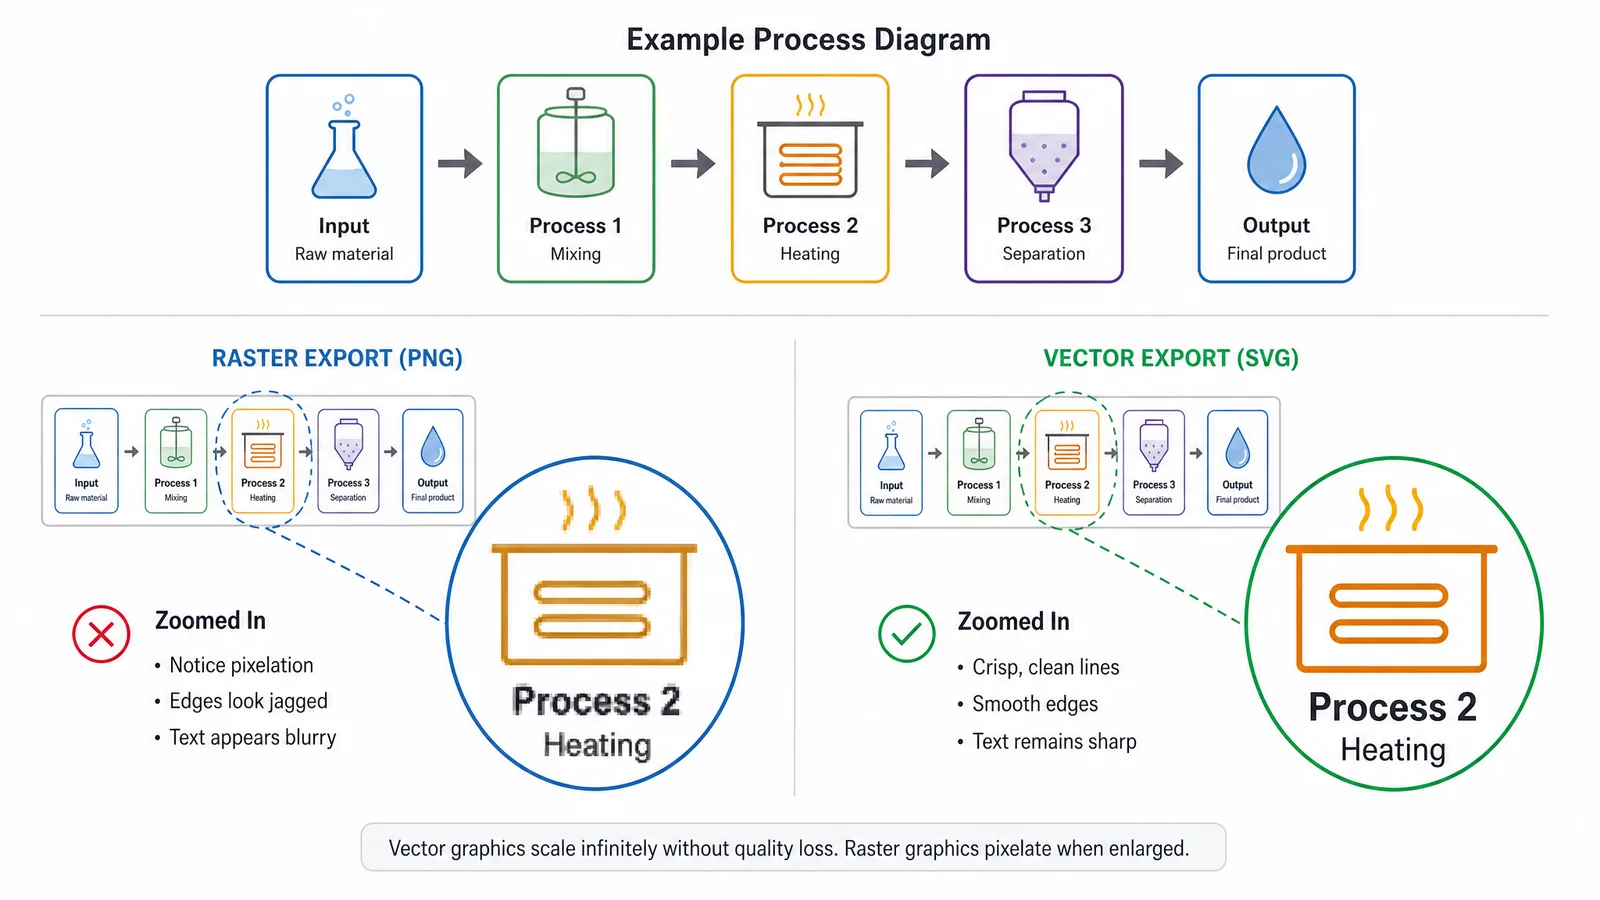
Three example diagrams representing generated, structured, and illustrative categories with their respective tools labeled (Figure generated with SciFig)
The Three Categories
Category
Diagram comes from
Tools
Optimise for
Generated
Data or code
Graphviz, D2, Mermaid, matplotlib
Reproducibility, scale
Structured
A defined process or system
draw.io, yEd, Lucidchart, PlantUML
Speed, correct notation
Illustrative
An idea needing composition
Inkscape, Affinity Designer, figure tools
Visual control, publication polish
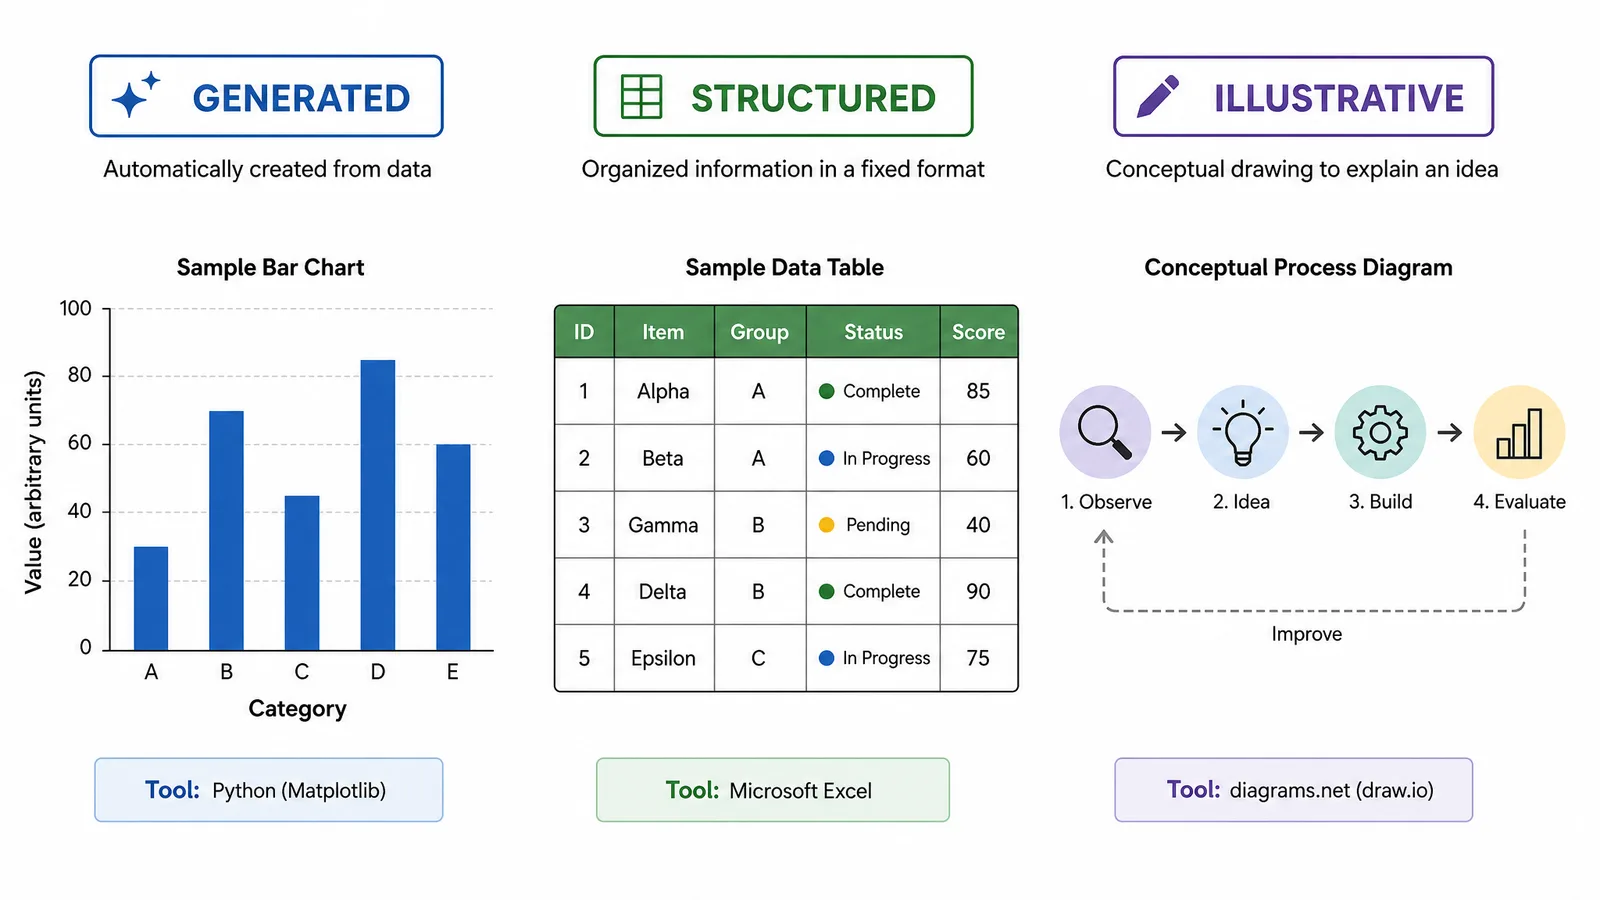
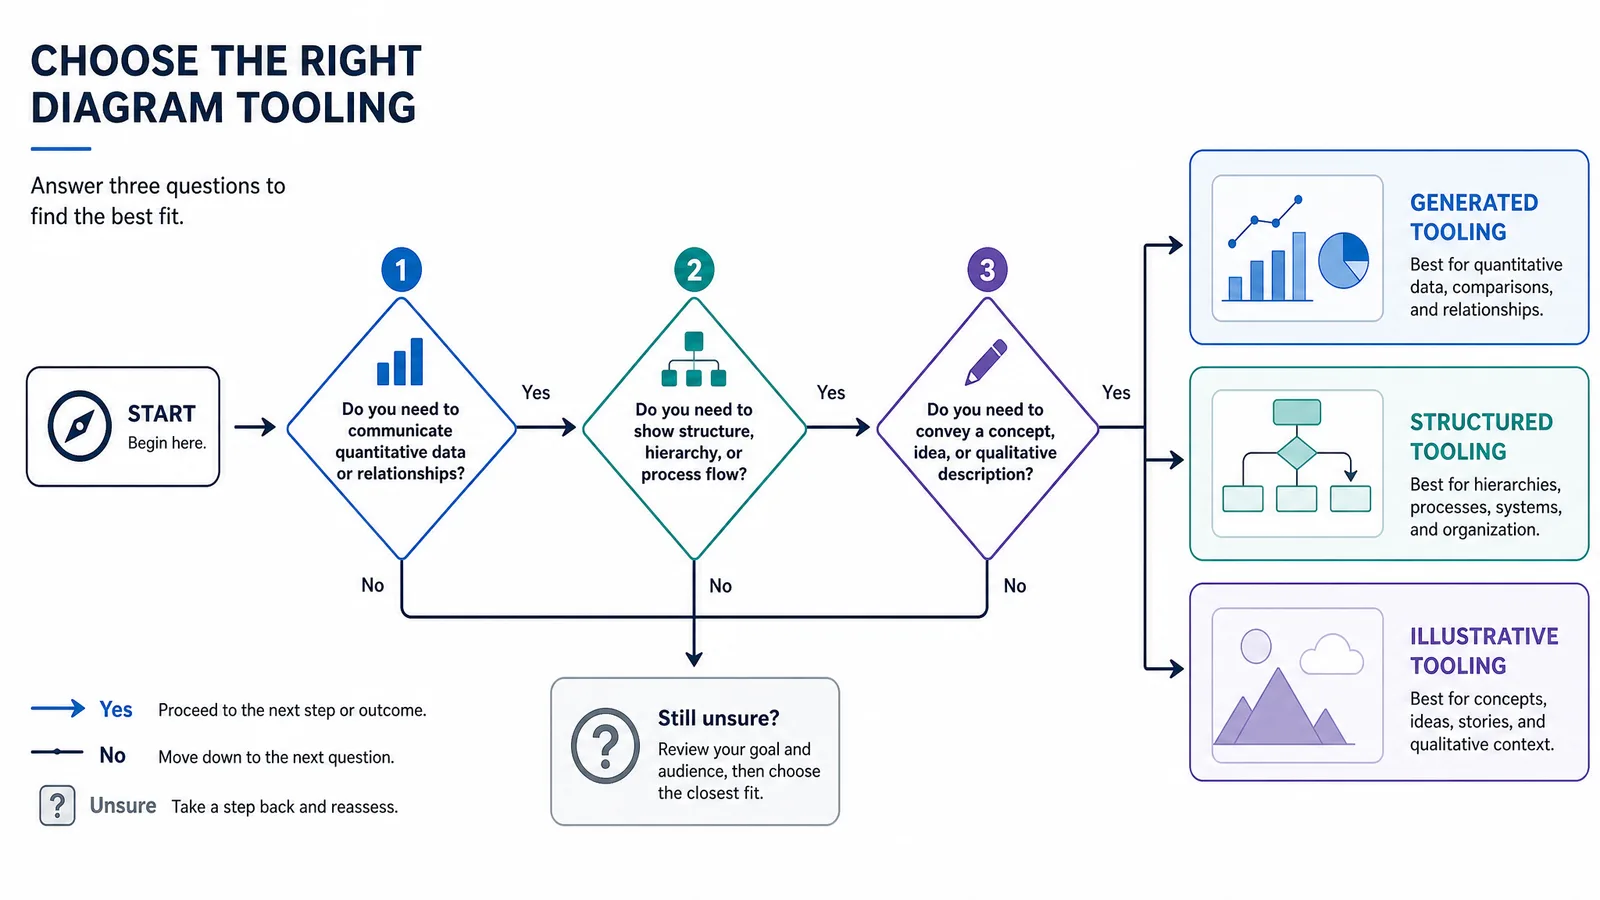
A quick test. If the diagram would change when your data changes, it is generated and should be produced by code. If it follows a standard notation such as a flowchart, UML, or PRISMA, it is structured and a diagramming tool will be faster than drawing it. If neither applies and the value is in how it looks, it is illustrative.
See AI Scientific Figure Generation in Action
Watch how researchers create publication-ready scientific figures from text descriptions.
One diagram from each category — generated, structured, and illustrative — with the tool used labelled (Figure generated with SciFig)
What Actually Decides It
Export format. If your target journal requires EPS or CMYK, that eliminates several otherwise strong tools immediately. Check this first, because it is a hard constraint rather than a preference.
Reproducibility need. For diagrams that change with data, text-defined tools are the only ones that keep the scientific figure in sync automatically. For a one-off conceptual figure, that property is worth nothing.
Who else touches it. A tool requiring a paid account per collaborator becomes a bottleneck during revision. Open formats and free tools remove that friction.
Longevity. Figures outlive projects. Prefer formats that a different tool can open in five years — SVG, or plain text.
A decision flowchart routing a diagram to generated, structured, or illustrative tooling based on three questions (Figure generated with SciFig)
A Workable Default Stack
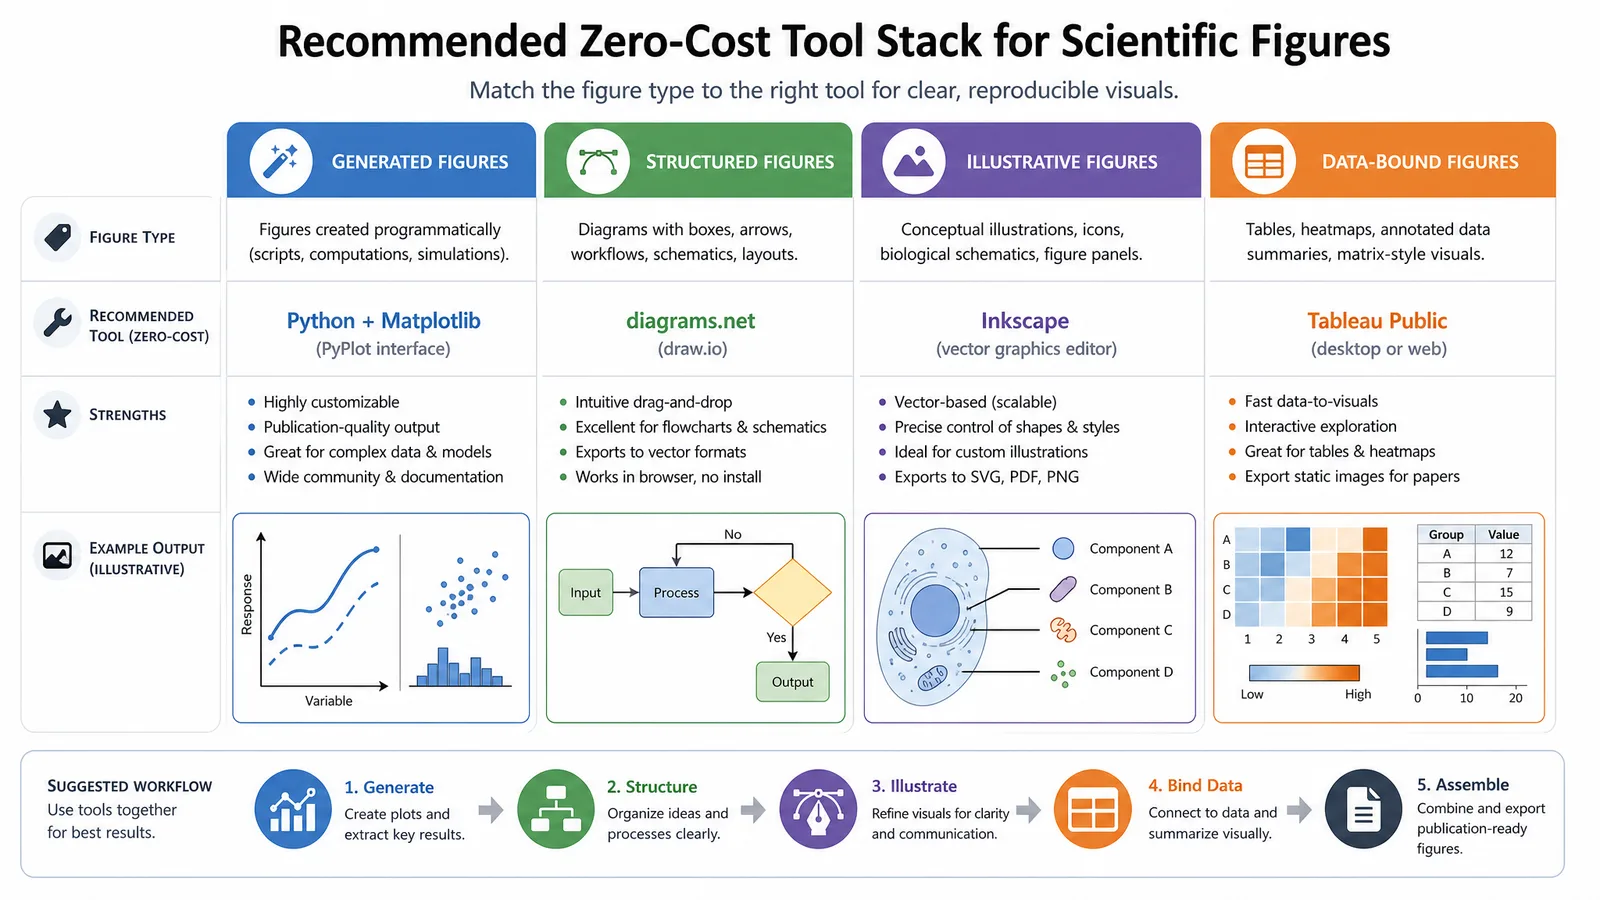
For a research group with no existing standard, a stack that covers nearly everything at zero licence cost:
Graphviz or D2 for generated graphs and pathways
draw.io for flowcharts, study designs, and system schematics
Inkscape for final assembly, panel labelling, and journal export
matplotlib or ggplot2 for anything bound to data
The one deliberate rule worth adopting alongside it: finish in one place. Multi-panel figures assembled in whatever tool made each panel end up with inconsistent fonts and spacing. Pick the finishing tool and route everything through it.
Tip
Standardise the finishing step before standardising the drawing tools. Consistent fonts, panel labels, and spacing across a manuscript do more for how professional the figures look than any individual tool choice.
Create Scientific Figures Now
Describe your scientific figure in natural language — get publication-ready illustrations in minutes.
When you want structure without learning a syntax, text to diagram generator produces editable diagrams from plain language, and text to figure handles publication figures. For figure libraries specifically, see our BioRender alternatives comparison.
A recommended zero-cost tool stack showing which tool handles generated, structured, illustrative, and data-bound figures (Figure generated with SciFig)
Identify the category first. Diagrams that change with data should be generated by code, diagrams following standard notation suit a structured diagramming tool, and diagrams whose value is compositional need an illustration tool.
There is no single best, but draw.io covers the widest range of structured diagram needs for free and offline. Most research groups pair it with a plotting library and a vector editor for finishing.
Text-defined tools such as Graphviz, D2, Mermaid, and PlantUML store diagrams as plain text, so they diff meaningfully and regenerate automatically. GUI tools store binary or complex XML that diffs poorly.
Usually not. Open source tools cover generated, structured, and illustrative work with journal-grade export. Paid tools mainly buy convenience, performance on large documents, and collaboration features.
Because panels were finished in different tools. Assemble and finish every panel in one application so fonts, spacing, and label styles match across the figure.
Check the target journal's required export formats first, since EPS or CMYK requirements eliminate some tools outright. Then consider reproducibility needs, collaborator access, and whether the file format will still open in several years.
Keep going
Recommended resources
Templates, tools, and further reading for your research