Most Lucidchart alternatives win on cost, offline access, or data control.
Lucidchart is a capable browser-based diagramming tool, and the reasons research groups look elsewhere are usually structural rather than about features: per-seat pricing that scales badly across a lab, a browser-only model that fails offline, and cloud storage that conflicts with data policies for sensitive projects.
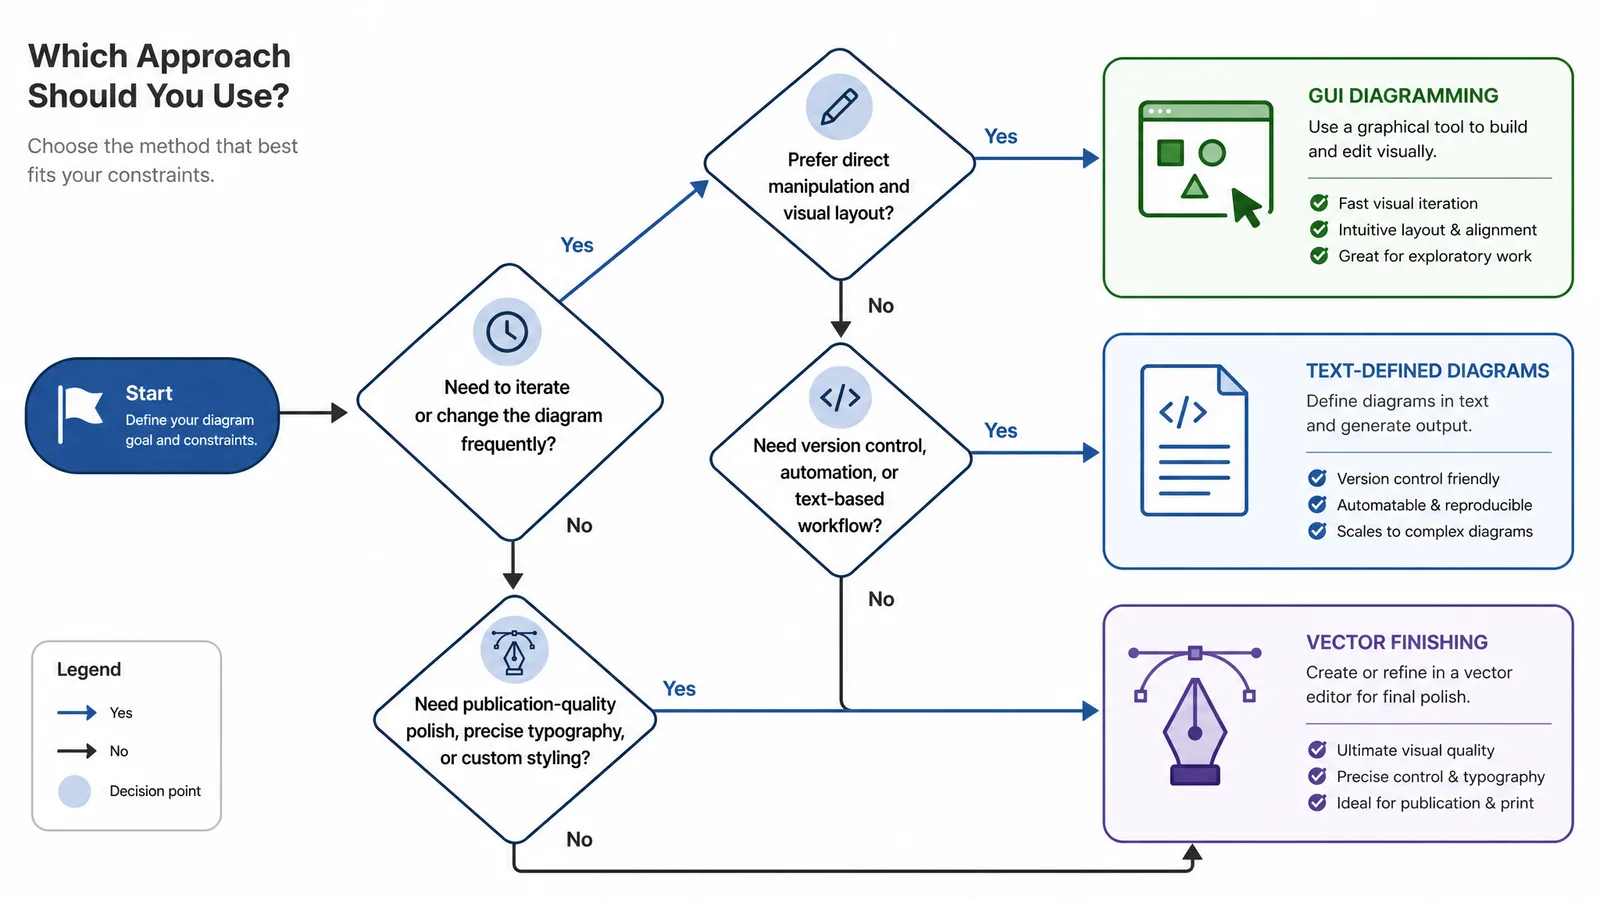
Pick by Constraint
| If your constraint is… | Choose | Why |
|---|---|---|
| Cost across many users | draw.io, Excalidraw | Free, no seat limits |
| Institutional data policy | draw.io desktop, self-hosted Excalidraw | Data never leaves your control |
| Offline fieldwork | draw.io desktop, yEd, Inkscape | Fully local applications |
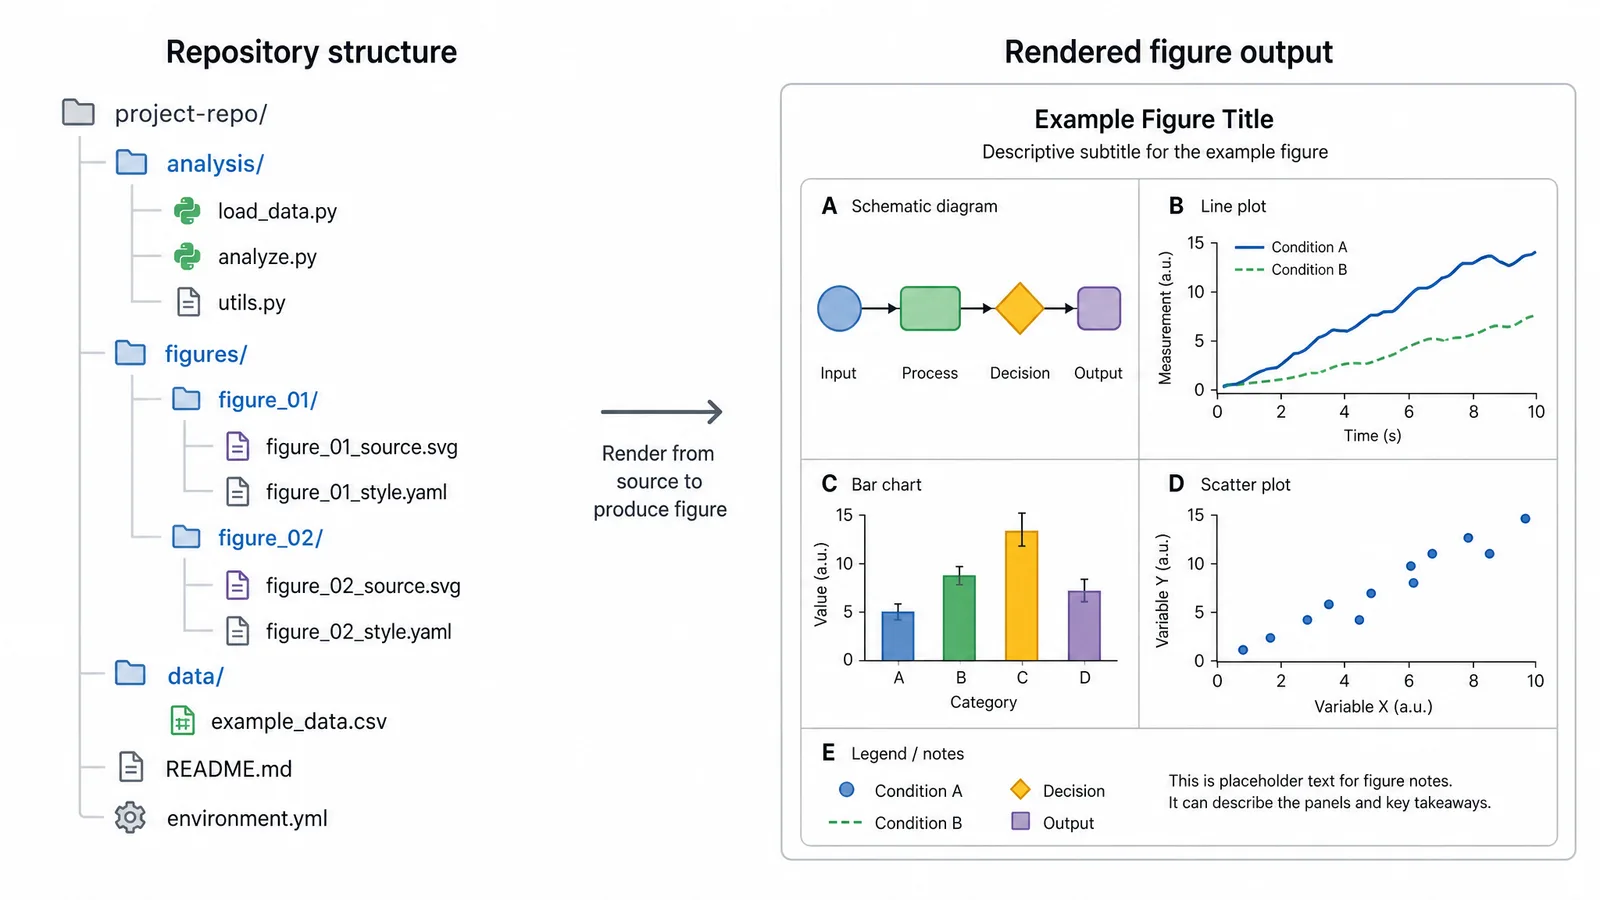
| Reproducibility | Mermaid, PlantUML, Graphviz | Diagrams live in version control |
| Publication-quality output | Inkscape, Affinity Designer | EPS, CMYK, full vector control |
| Large auto-laid-out graphs | yEd, Graphviz | Automatic layout at scale |
See AI Scientific Figure Generation in Action
Watch how researchers create publication-ready scientific figures from text descriptions.
Explore the Tooldraw.io / diagrams.net
The closest substitute and the default recommendation. Free with no seat limits, available as a desktop application for offline and restricted environments, exports SVG and PDF, and stores files as open XML. Shape libraries cover flowcharts, UML, network, and BPMN.
Excalidraw
Better than draw.io for early thinking and worse for formal notation. Self-hostable, which is the deciding factor for workshops involving unpublished data.
Mermaid and PlantUML
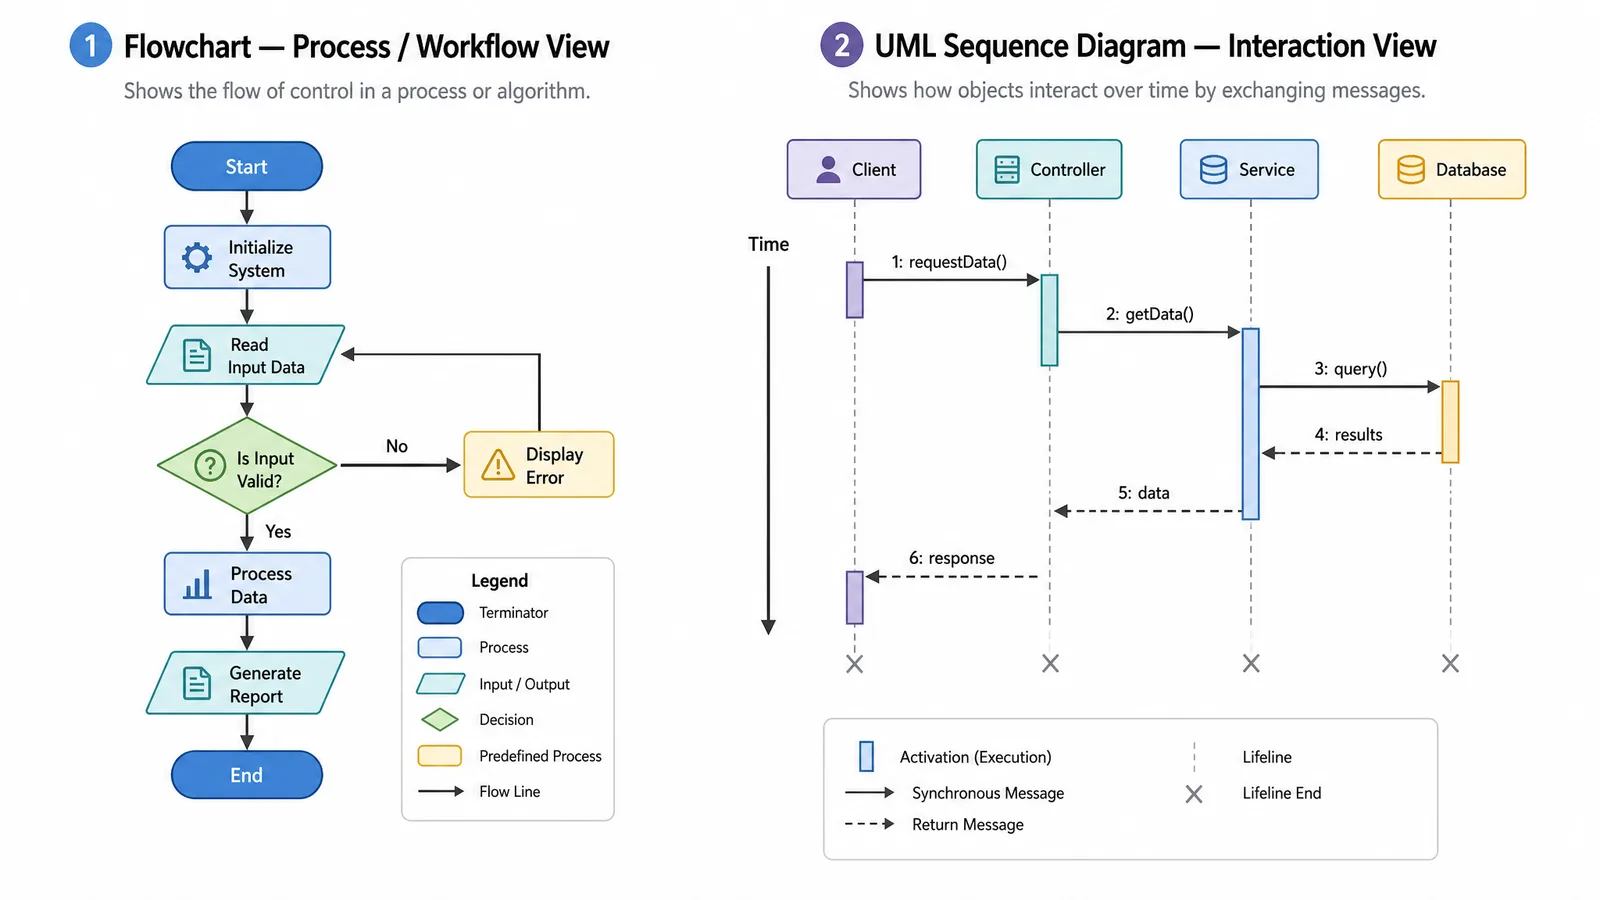
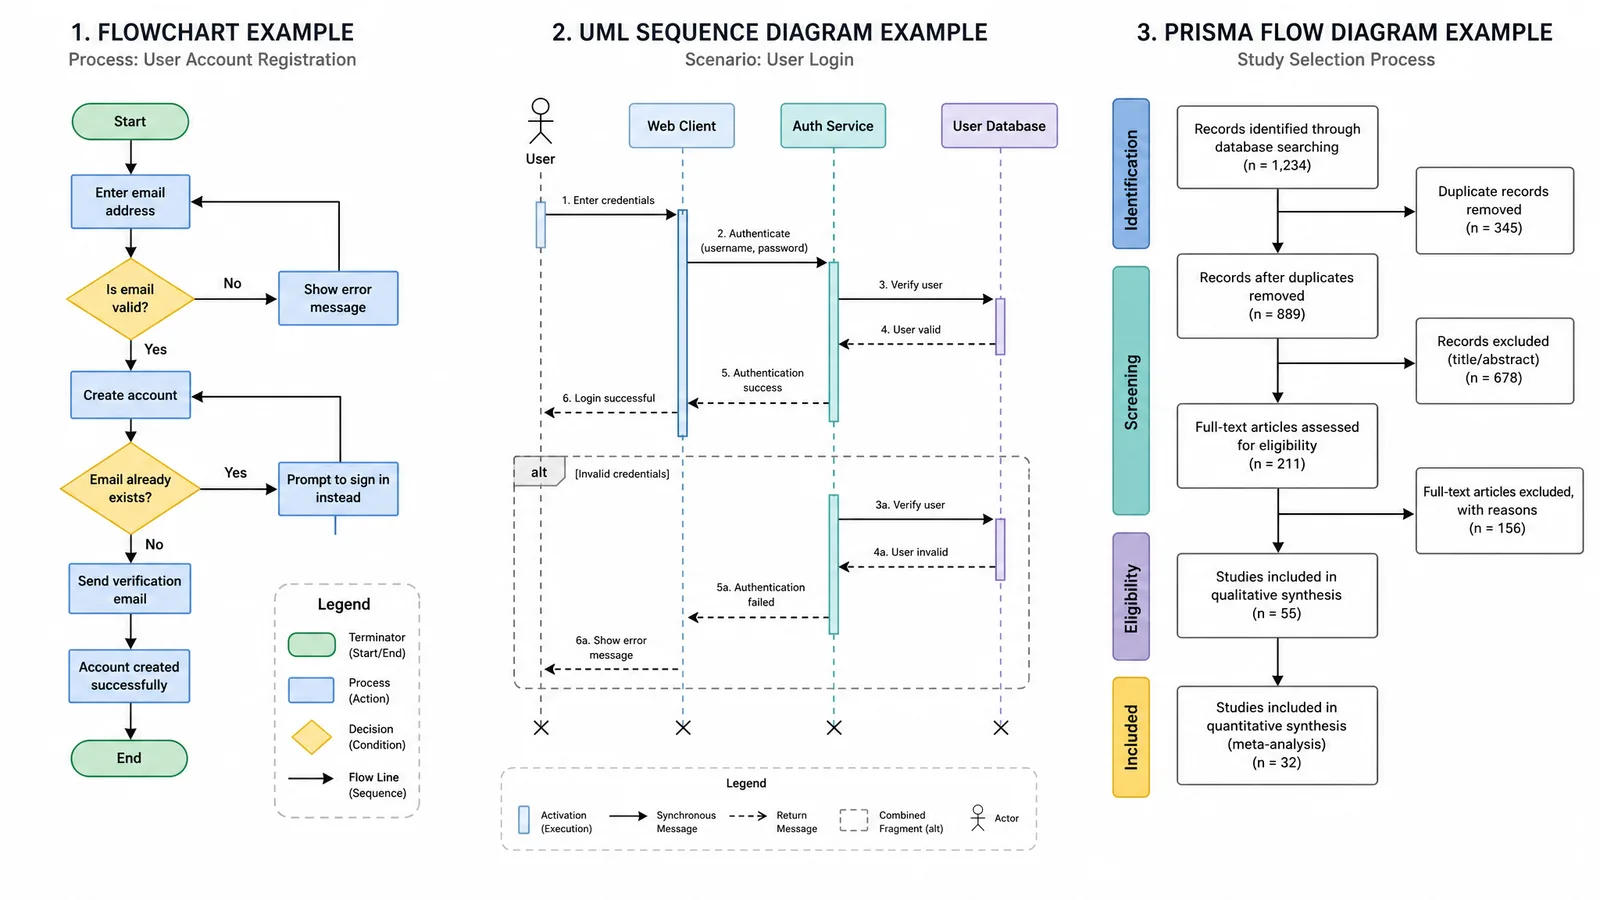
Text-defined diagrams that belong in a repository. PlantUML covers formal software notation — sequence, class, state — thoroughly. Mermaid is lighter and renders in many Markdown environments. Both diff meaningfully in version control, which no GUI tool does.
yEd
The right answer when a diagram has too many nodes to place by hand. Its automatic layouts handle large hierarchies and networks well, and it exports SVG and PDF.
The Data Residency Question
For clinical, patient-derived, or commercially sensitive work, where the diagram is stored matters as much as what it contains. A process diagram naming an unpublished assay, or a study flow revealing recruitment sites, can be sensitive even when it holds no participant data.
Three practical options: run a desktop application so nothing leaves the machine, self-host a browser tool on institutional infrastructure, or use a text format kept in your existing version control. All three keep the diagram inside whatever boundary your data policy already defines, which avoids needing a separate agreement for the diagramming vendor.
Tip
Before standardising a lab on any tool, export a representative diagram and reopen it somewhere else. Round-tripping through SVG reveals lock-in that feature lists do not, and it takes ten minutes.
Create Scientific Figures Now
Describe your scientific figure in natural language — get publication-ready illustrations in minutes.
Try Free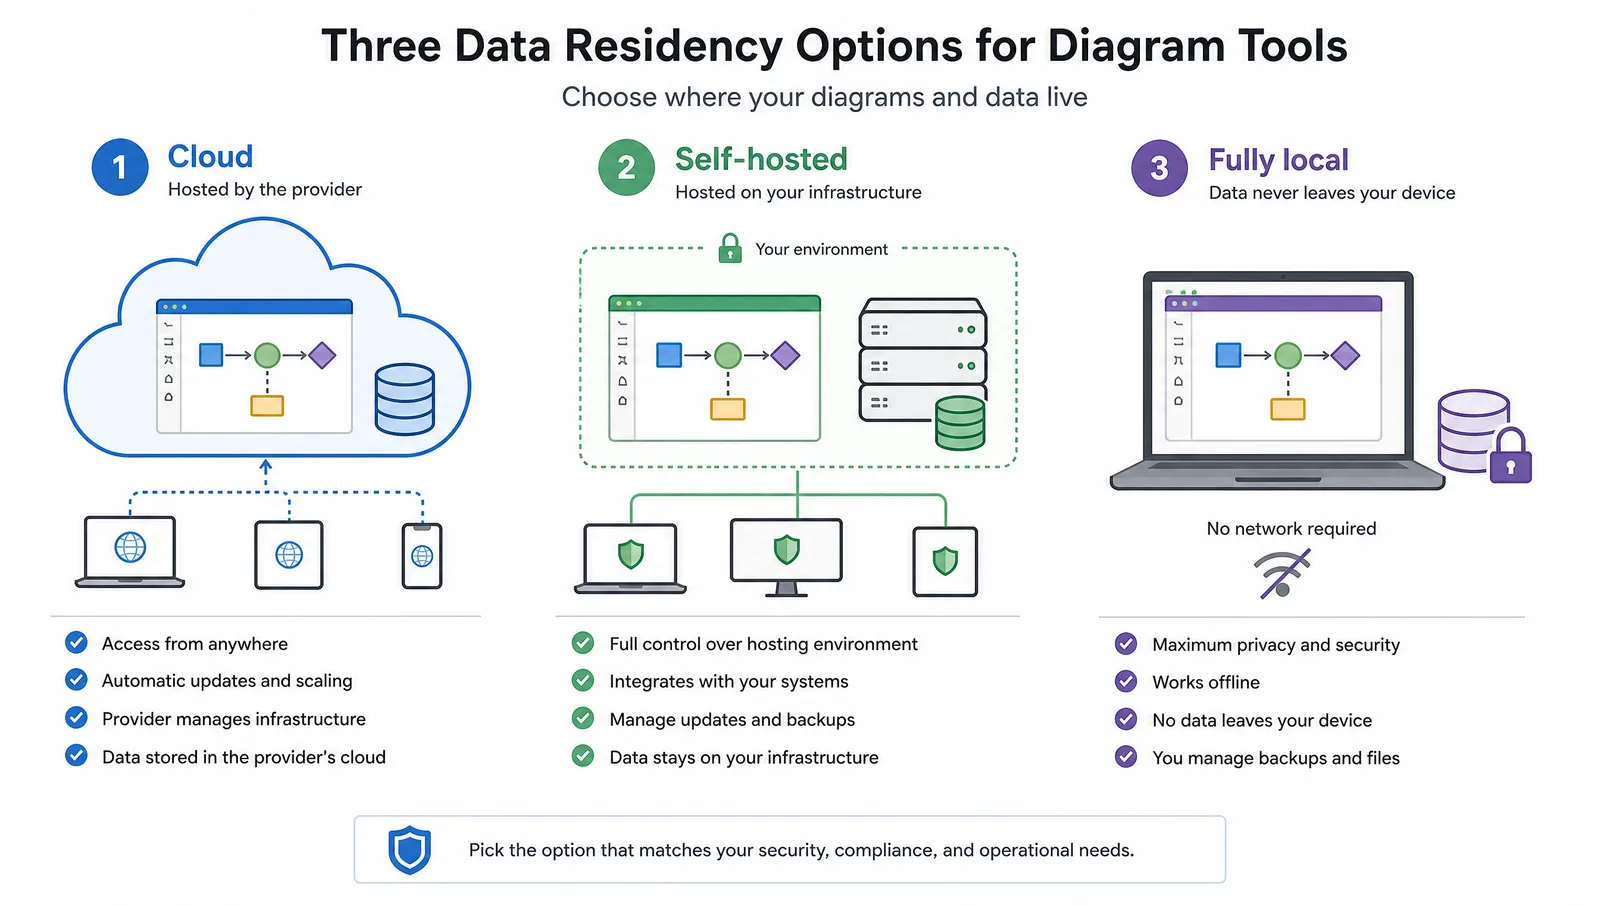
Related Reading
Related reading: 7 Best BioRender Alternatives in 2026 (Free & Paid), 10 Best Scientific Illustration Tools in 2026.