Try Flare for quick layouts; Sunburst corrected the target label in both outputs of our editing example.
GPT Image 2.5 Flare vs Sunburst: Which Should You Choose for Scientific Figures?
Choose Flare to explore a composition; try Sunburst first for an edit similar to our one-label correction.
| Scientific task | Starting choice | Observation in these outputs |
|---|---|---|
| Four-panel study workflow | Flare for quick layout exploration | Both preserve four panels, five labels and three connectors |
| Labeled cell illustration | Choose by the visual style | Both include eight labels; Flare uses flatter fills, Sunburst more shading |
| Scientific symbols | Either version with exact strings | Both retain all six strings in both runs |
| Simple mechanism | Either version with explicit arrows | Both show three nodes, two arrows and two relationship labels |
| Graphical abstract | Flare for framed stages; Sunburst for stages without frames | Both retain three stages and two connecting arrows |
| Targeted label correction | Sunburst for a similar edit | Both Sunburst outputs repair the wording; both Flare outputs retain a misspelling |
SciFig: Continue With the Same Research Content
| Your output | SciFig workflow | Next step |
|---|---|---|
| Conceptual scientific illustration | Illustration | Edit text or icons directly; vectorize to SVG if needed |
| Plot from measured values | DataChart | Use the source table and refine the chart |
| Editable process or structure | FlowChart | Adjust stages, connections and native SVG elements |
See What SciFig Can Do
Choose Illustration for mechanisms and concepts, DataChart for charts from table data, or FlowChart for editable process and structure diagrams.
Explore SciFigScientific Figure Layout: Framed or Open Stages?
The graphical abstracts preserve the same workflow but differ in how strongly they separate the three stages.
The prompt requests Synthesis → Characterization → Image analysis, with a beaker and particles, a microscope and an analysis image. In these outputs, Flare puts the stages inside frames; Sunburst uses a layout without frames. Both retain the three labels and two arrows.
Use framed stages when each operation needs a distinct panel. Use an open layout when the workflow should read as one continuous explanation. At your intended figure size, inspect the smallest objects and whether the arrows establish the sequence without competing with the artwork.
Scientific Figure Labels, Symbols and Mechanism Arrows
Both versions supplied the requested cell labels, notation strings and simple mechanism connections in both runs.
| Task | Exact requirement | What to check beyond presence |
|---|---|---|
| Animal cell | Eight named structures and labels | Each leader line ends on its intended structure |
| Scientific notation | α, β, ΔG, μm, CO₂, s⁻¹ | Greek glyphs, subscript and superscript at display size |
| RAF → MEK → ERK | Three boxes, two arrows, two Phosphorylation labels | Direction and meaning of each connection |
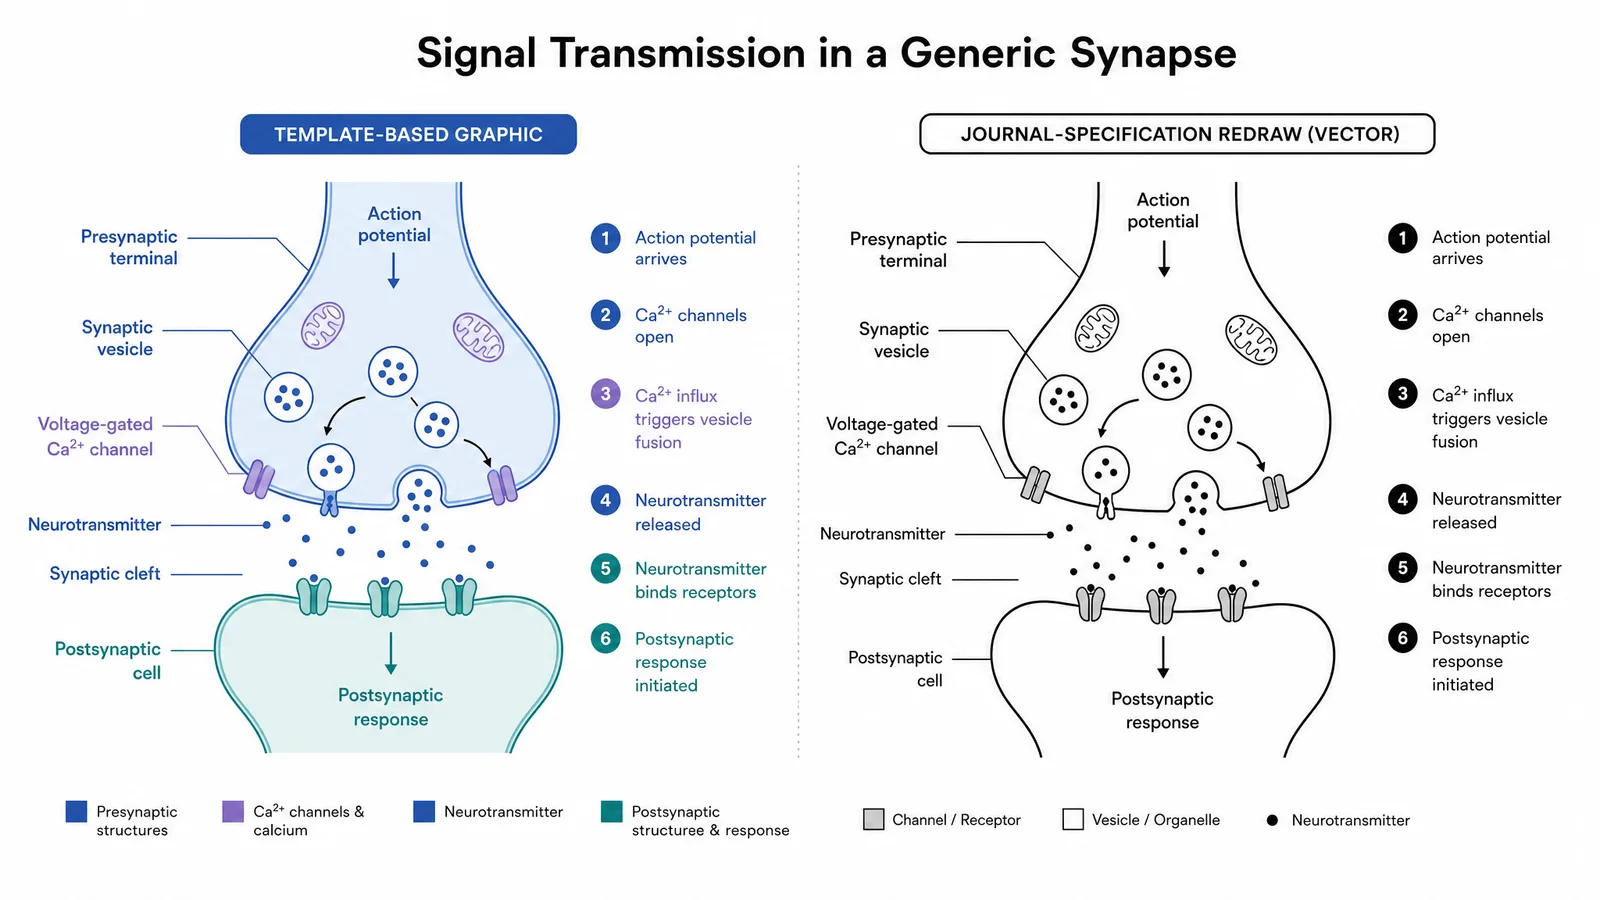
The cell outputs differ in appearance: Flare uses flatter fills, while Sunburst shows more shading and membrane detail. Choose the style that fits the surrounding scientific figure. For a scientific figure with many labels, allow space outside the objects and avoid crossing leader lines.
Scientific Image Editing: Correct One Label, Preserve the Layout
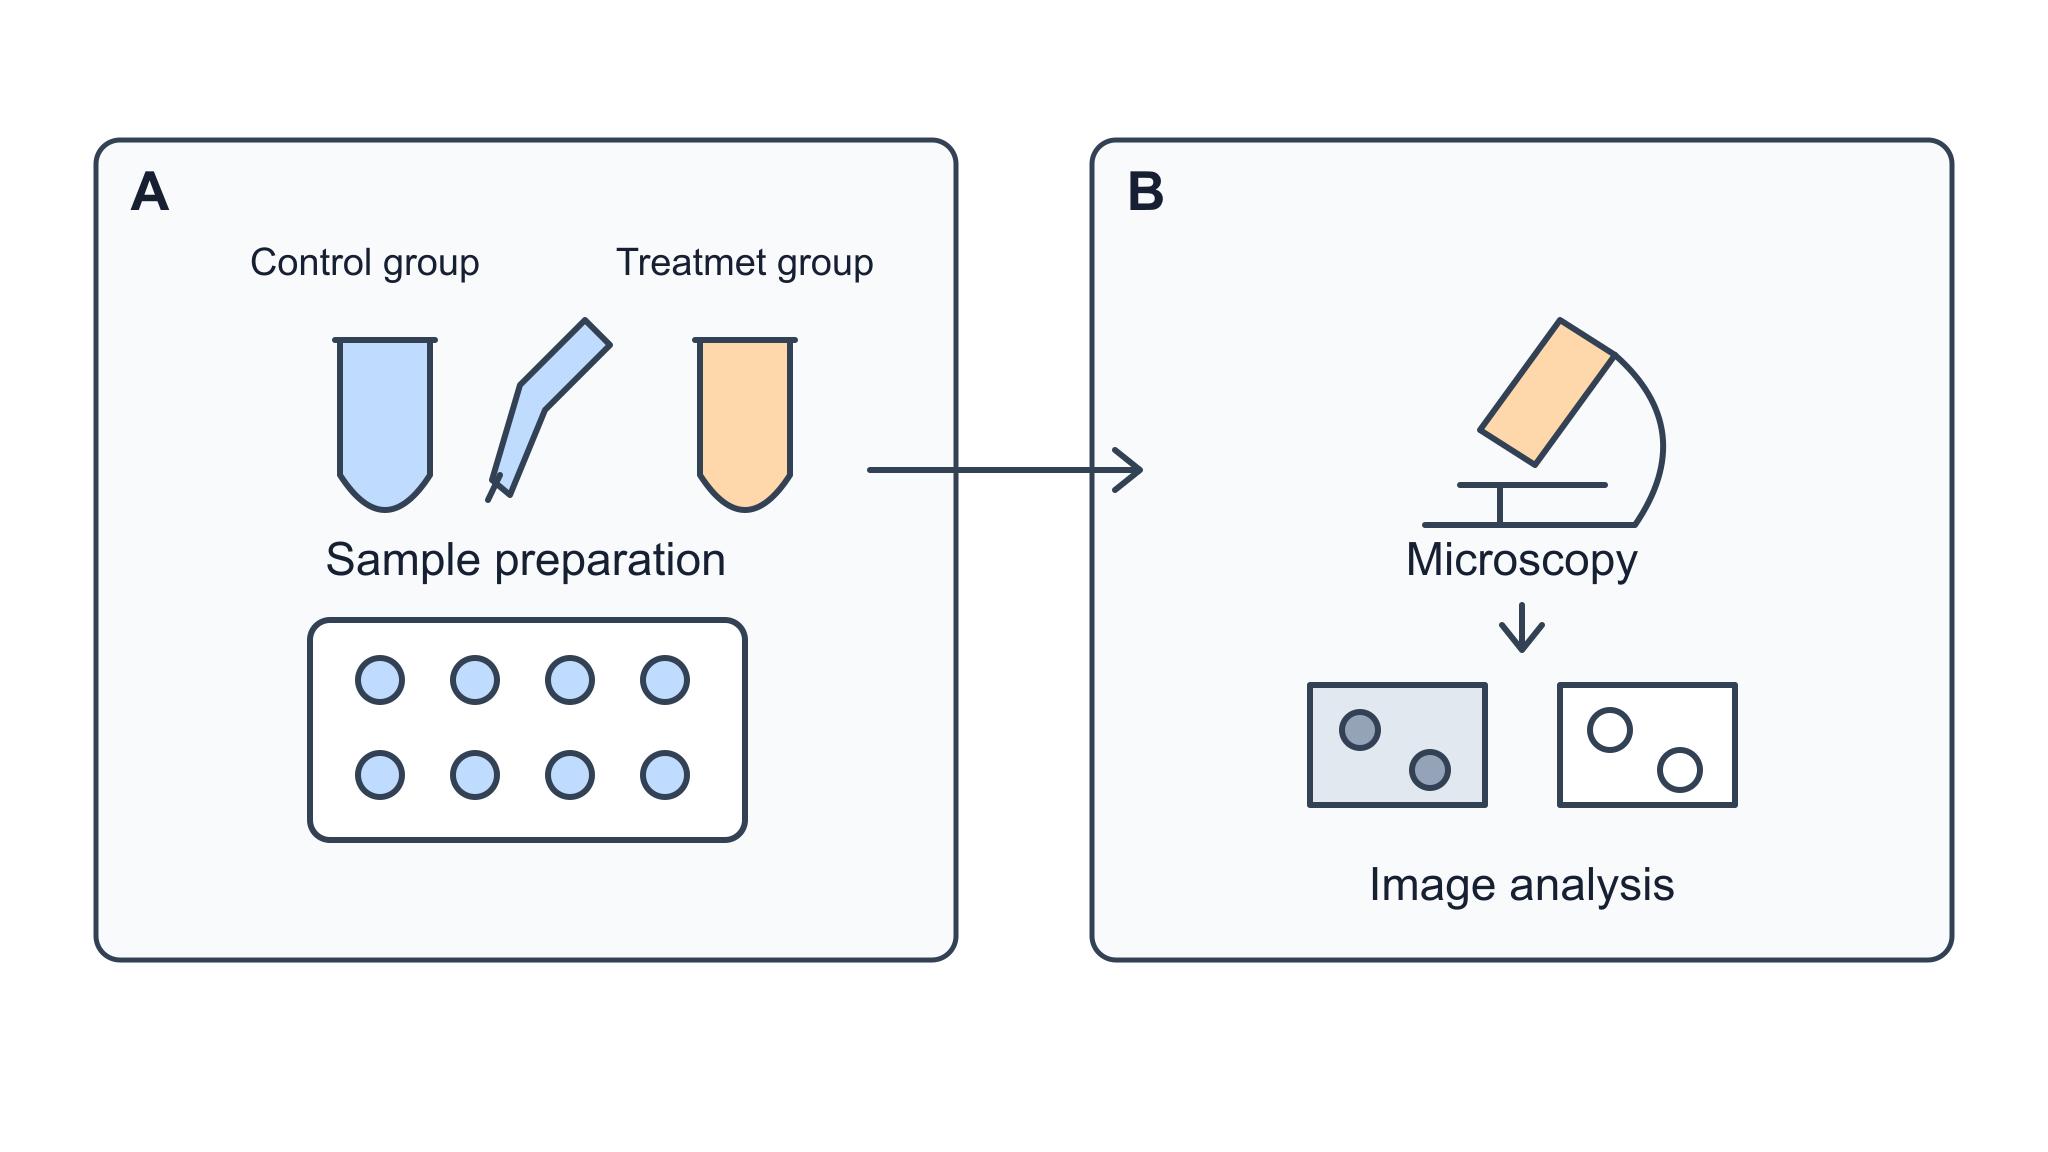
Both Sunburst outputs read Treatment group; both Flare outputs retain a misspelling in this correction task.
Treatmet group with Treatment group at the top right of panel A. The instruction also names the other labels, objects, arrows, panel positions and colors to preserve.Both attempts from each version are shown directly. Read the target wording first, then compare the tubes, arrows and panel boundaries with the input. Sunburst is the useful starting choice for an edit like this; that observation applies to this correction task.
For your own scientific image edit, state the old wording, exact replacement and location. Then describe what should remain. Select an output to open the full prompt, copy it or generate in SciFig; upload the supplied reference when trying the editing task.
Tip
Make one focused change per instruction. After correcting a label, review the result before changing the panel layout or palette.
Start Creating Scientific Figures
Choose Illustration for mechanisms and concepts, DataChart for charts from table data, or FlowChart for editable process and structure diagrams.
Start FreeScientific Figure Generation Time and the Next Editing Step
Flare's recorded median was 36 seconds and Sunburst's was 40 seconds; combine time with the revision needed.
| Recorded generation time | Flare: 12 outputs | Sunburst: 12 outputs |
|---|---|---|
| Median | 36 seconds | 40 seconds |
| Range | 15–53 seconds | 35–80 seconds |
| Shared settings | 2K request, landscape 16:9 | 2K request, landscape 16:9 |
The ranges overlap. A faster first output helps when exploring scientific figure layouts; a correct targeted edit can save an additional revision. Inspect required objects, labels and relationships, then choose the output that is easier to finish.