Nano Banana 2.1 and GPT Image 2.5 are both available in SciFig for scientific figure generation and editing.
Start with Nano Banana 2.1 for new labeled layouts; try GPT Image 2.5 Sunburst for focused edits.
Nano Banana 2.1 vs GPT Image 2.5: Scientific Figure Capabilities
Nano Banana 2.1 updates text and layout; GPT Image 2.5 offers a speed-oriented and a detail-oriented version.
Nano Banana 2.1: Labels and Multi-panel Scientific Images
Google documents improved text rendering, infographic layout and instruction following in Nano Banana 2.1, with 1K, 2K and 4K output. For research illustrations, these updates make it a useful starting choice for named structures, balanced panels and reference-based revisions. It updates Nano Banana 2; Nano Banana Pro remains a separate model in the family.
SciFig: From Research Materials to an Editable Figure
GPT Image 2.5: Flare or Sunburst
| Requirement | Nano Banana 2.1 | GPT Image 2.5 |
|---|---|---|
| Labeled scientific illustrations | Updated text rendering and layout | Exact-label instructions with Flare or Sunburst |
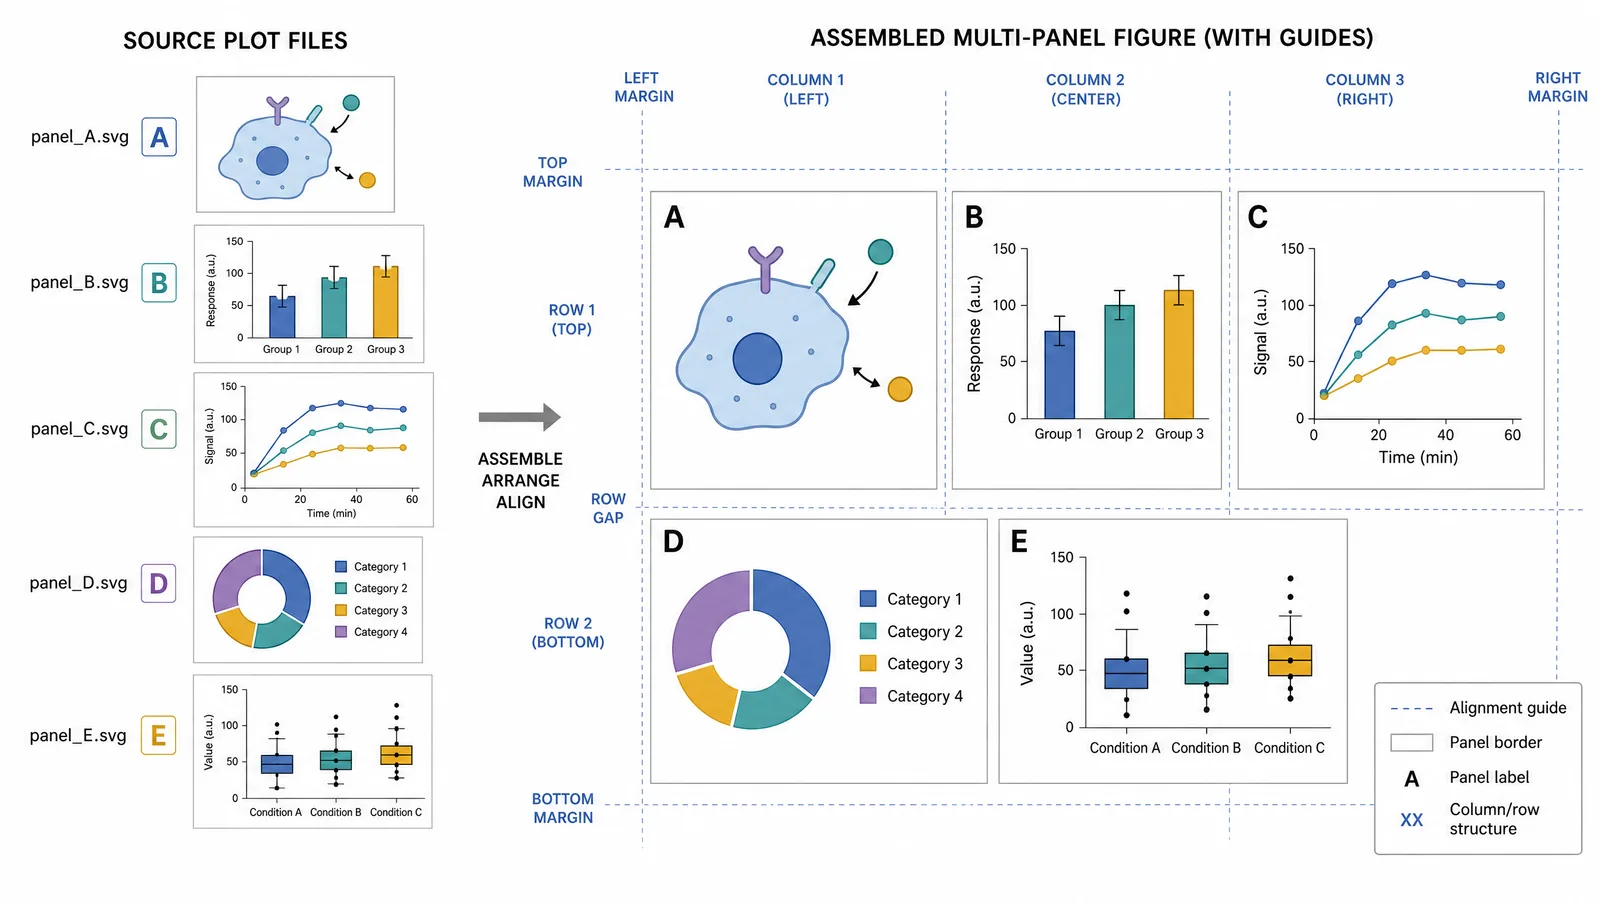
| Multi-panel scientific images | Improved instruction following and infographic layout | Explicit panel order, objects and spacing |
| Revisions from a reference | Conversational image editing | Focused editing with preservation instructions |
| Model choice | Updated Nano Banana 2 family model | Flare for quick exploration; Sunburst for demanding edits |
Which Model Should You Choose for Your Scientific Figure?
Choose by the figure you need to finish: a new composition, exact labels or a targeted correction.
| Your task | Useful starting choice | What decides the next step |
|---|---|---|
| New labeled concept or study overview | Nano Banana 2.1 | Panel arrangement and placement of exact terms |
| Explore several scientific image layouts | GPT Image 2.5 Flare | Reading order and how much revision each layout needs |
| Correct one label in an existing figure | GPT Image 2.5 Sunburst | Replacement spelling and preservation of nearby content |
| Graphical abstract or mechanism illustration | Either family, with explicit relationships | Arrow direction, object count and visual hierarchy |
For a figure dominated by numbers, start from the source table in DataChart. For a process whose boxes and connections need continuous editing, use FlowChart. The image model is most useful for the conceptual illustration within the figure.
See What SciFig Can Do
Choose Illustration for mechanisms and concepts, DataChart for charts from table data, or FlowChart for editable process and structure diagrams.
Explore SciFigHow Do You Write Labels and Symbols in Scientific Images?
Supply the exact terms and characters, then describe where each label and leader line should end.
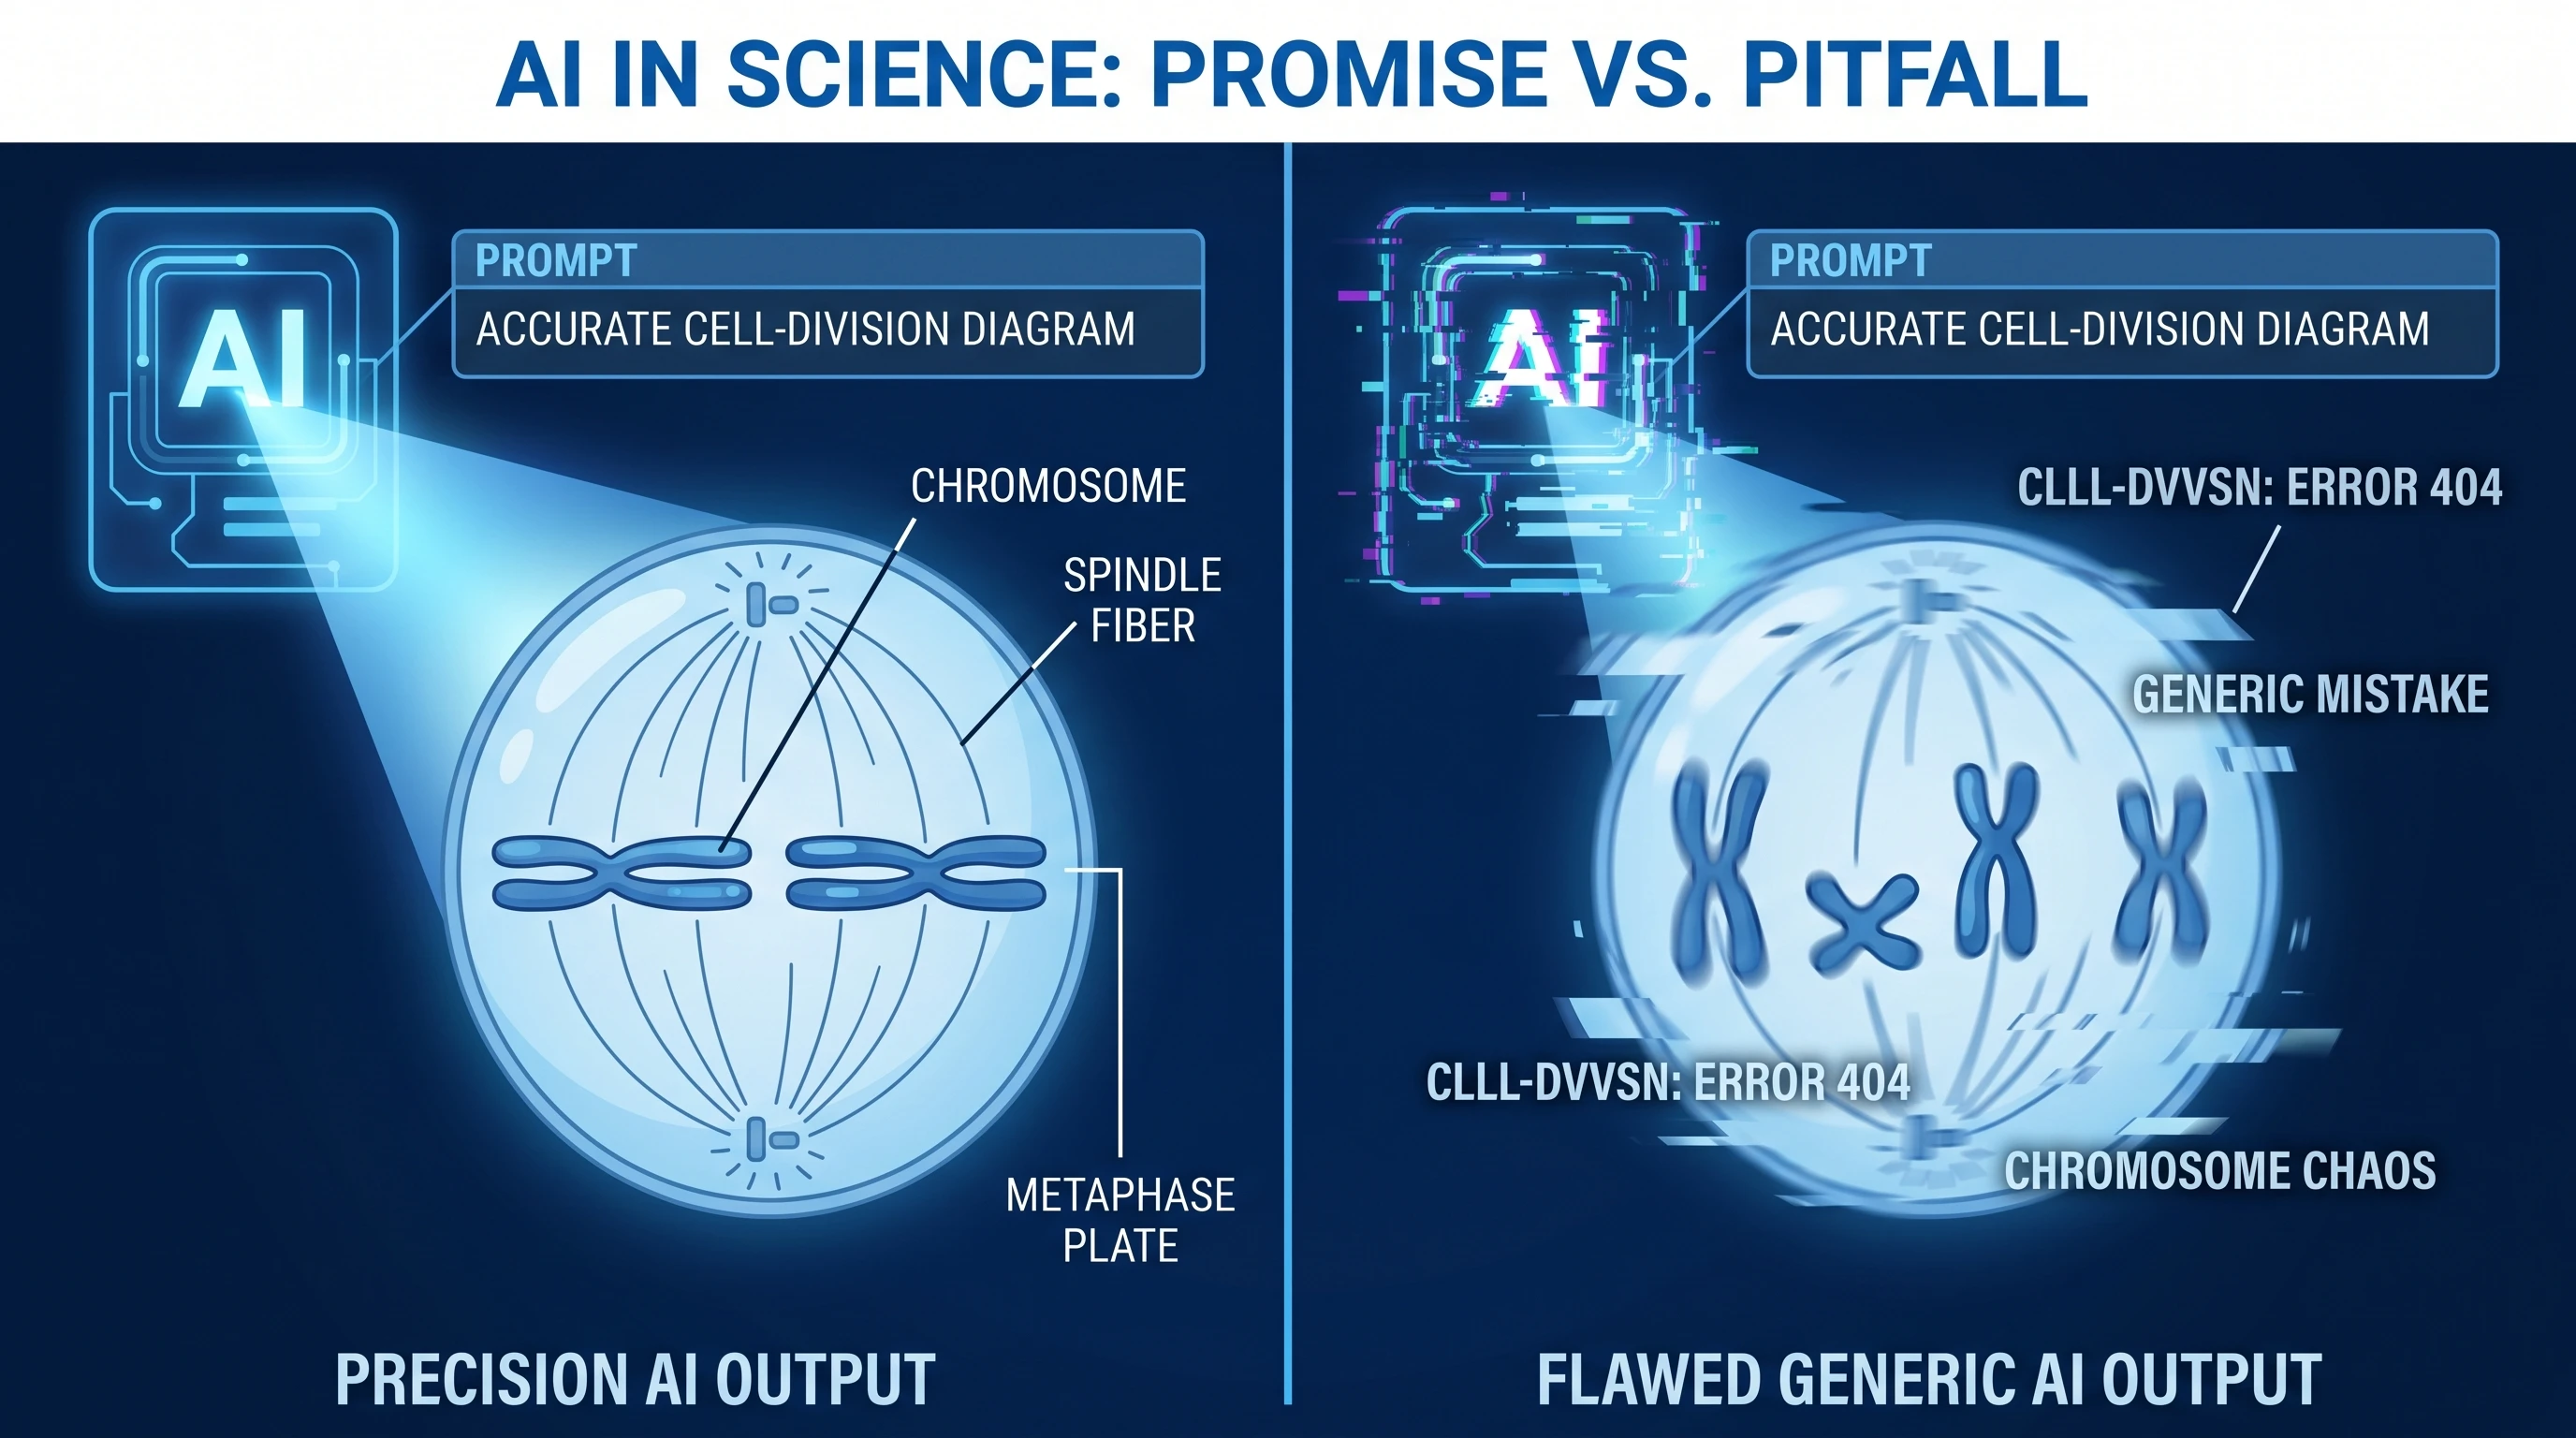
An eight-label cell illustration needs more than “draw a labeled cell.” List the structures, put the nucleolus inside the nucleus and require each leader line to end on its named structure. That turns a general request into a figure you can inspect term by term.
α, β, ΔG, μm, CO₂ and s⁻¹. Our GPT typography outputs retained all six strings in both versions and both runs. Check subscripts, superscripts and line endpoints at the size intended for your article or slide; word presence alone does not establish the biological relationship.How Do You Structure Mechanisms and Multi-panel Scientific Figures?
Define objects, connections and reading order before asking for color or decorative detail.
A RAF → MEK → ERK illustration can be specified as three boxes, two directed arrows and “Phosphorylation” above each arrow. For a more complex mechanism, write the actual activation and inhibition relationships separately. This makes missing or reversed connections easier to identify.
For a study workflow, assign a purpose to each panel: sample groups, preparation, microscopy and analysis. Our four-panel example uses A–D, five exact labels and three connecting arrows. For a graphical abstract, reduce that sequence to the stages needed to explain the central result, with enough space to distinguish them.
How Do You Edit a Scientific Image From a Reference?
Name one change and its location, then specify the labels, objects and layout that should remain.
For a label correction, write: “Replace ‘Treatmet group’ with ‘Treatment group’ at the top right of panel A; keep the same font, baseline and color.” Then name the other panels, labels and arrows to preserve. For a reference-based scientific figure, say whether the input supplies the composition, objects or visual style.
A Short Prompt Structure for Scientific Figures
A useful scientific figure prompt specifies content, layout, relationships, exact labels and visual style.
Use this structure with either model, replacing the bracketed fields with your research content:
Create a [figure type] showing [objects]. Arrange them in [layout]. Connect [source] to [target] with [relationship]. Use exactly these labels: [label list]. Keep [style and spacing].
Tip
Before generating, write a short checklist: required objects, label spelling, arrow directions and panel order. Use that checklist to decide what to revise.
Start Creating Scientific Figures
Choose Illustration for mechanisms and concepts, DataChart for charts from table data, or FlowChart for editable process and structure diagrams.
Start FreeCreate, Edit and Export Scientific Figures in SciFig
Choose the workspace by the output: conceptual image, data plot or editable process diagram.
| Task | SciFig workflow | Editable output |
|---|---|---|
| Concept or mechanism illustration | Illustration from text or reference materials | Edit text and icons directly; optional SVG vectorization for element editing |
| Chart from numerical results | DataChart from your source table | Refine the chart and convert it to SVG |
| Process or structure diagram | FlowChart from stages and relationships | Native SVG |