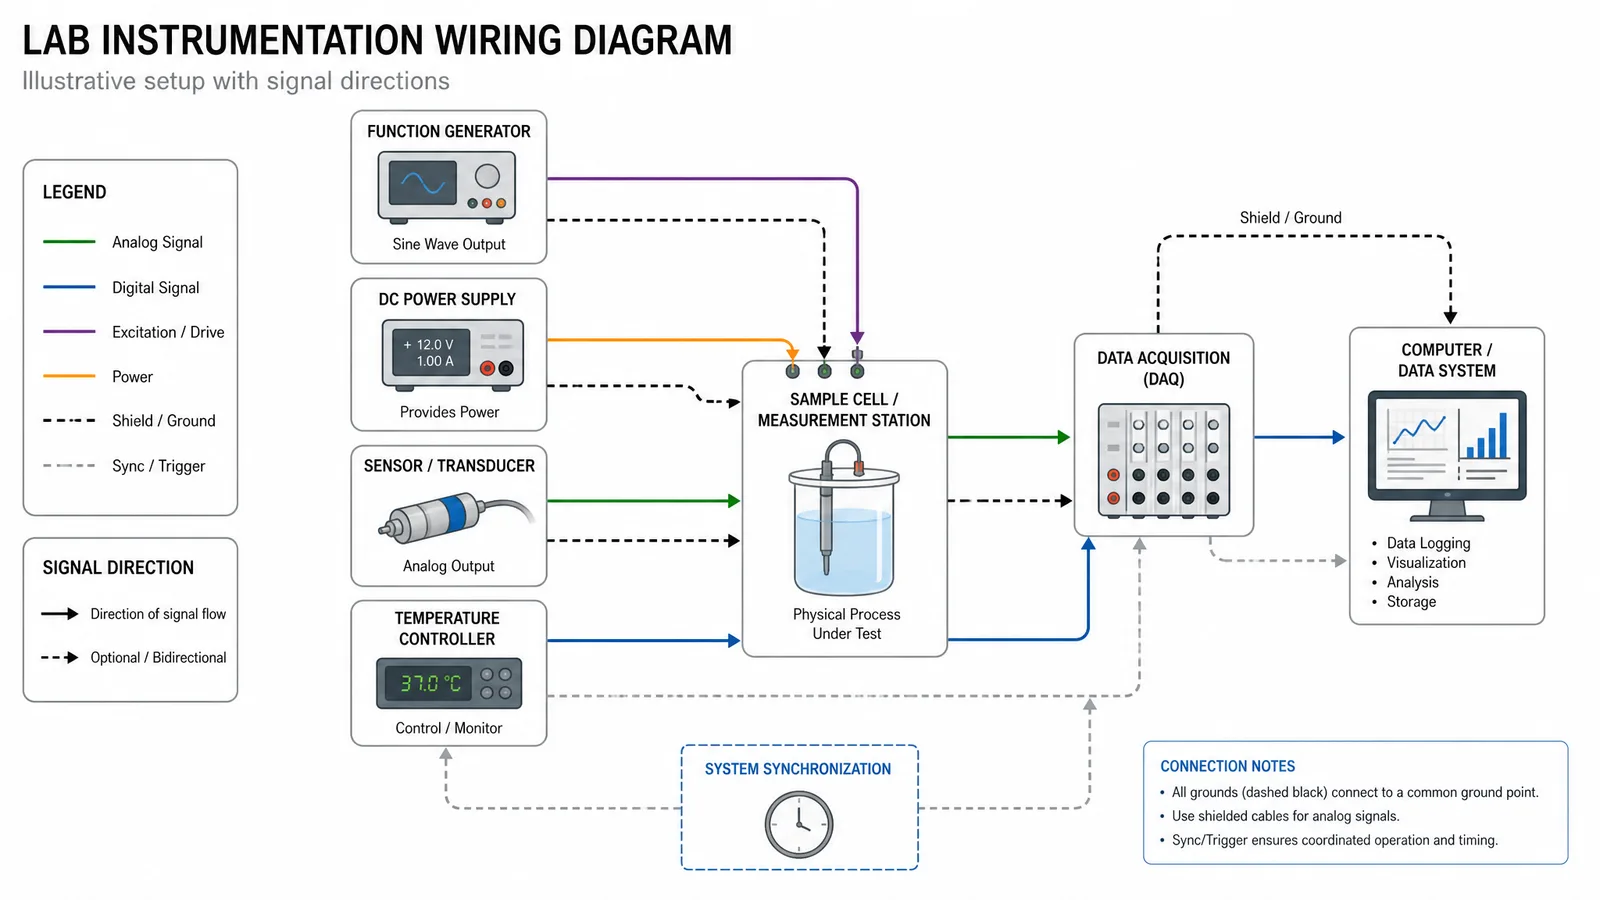
Wiring diagram software splits into schematic capture and general drawing.
The distinction decides which tool you need. Schematic capture understands components, nets, and electrical rules; general drawing tools place symbols and lines that merely look like a circuit. For a research paper documenting a custom rig, that difference determines whether the scientific figure can be verified.
Two Categories
| Schematic capture | General drawing | |
|---|---|---|
| Examples | KiCad, EasyEDA, Fritzing | draw.io, Inkscape, Visio |
| Understands nets | Yes | No |
| Electrical rule checking | Yes | No |
| Generates netlist / PCB | Yes | No |
| Best for | Circuits you will build | Explaining a setup |
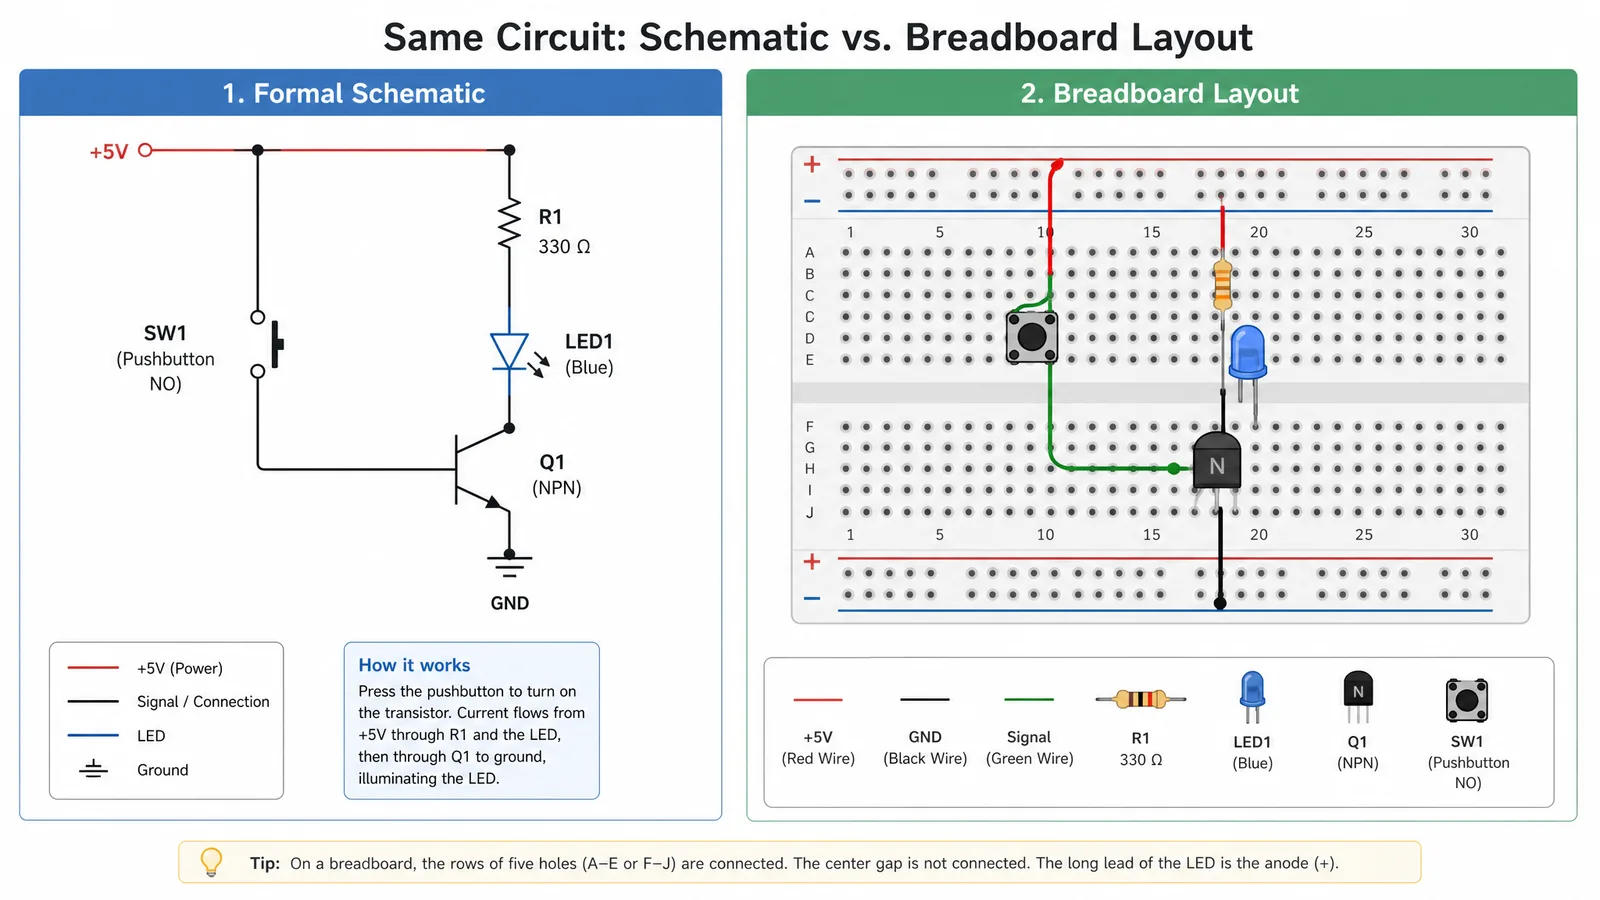
If you are documenting a rig that already exists and want readers to understand the signal path, a general drawing tool is often the faster and clearer choice. If you are designing something that will be fabricated, use schematic capture.
See AI Scientific Figure Generation in Action
Watch how researchers create publication-ready scientific figures from text descriptions.
Explore the ToolKiCad
Free, open source, and the standard for serious open hardware. Full schematic capture with electrical rule checking, and exports SVG and PDF suitable for publication. The learning curve is real, and it is more than most people need for a figure explaining an apparatus.
EasyEDA
Browser-based schematic capture with a large component library. Faster to start than KiCad. Cloud-first, which is worth checking against institutional data policy for unpublished hardware designs.
Fritzing
Produces breadboard-style diagrams that are unusually good at communicating physical layout to non-specialists. Ideal for methods sections aimed at readers who will replicate a setup, and for teaching material.
draw.io and Inkscape
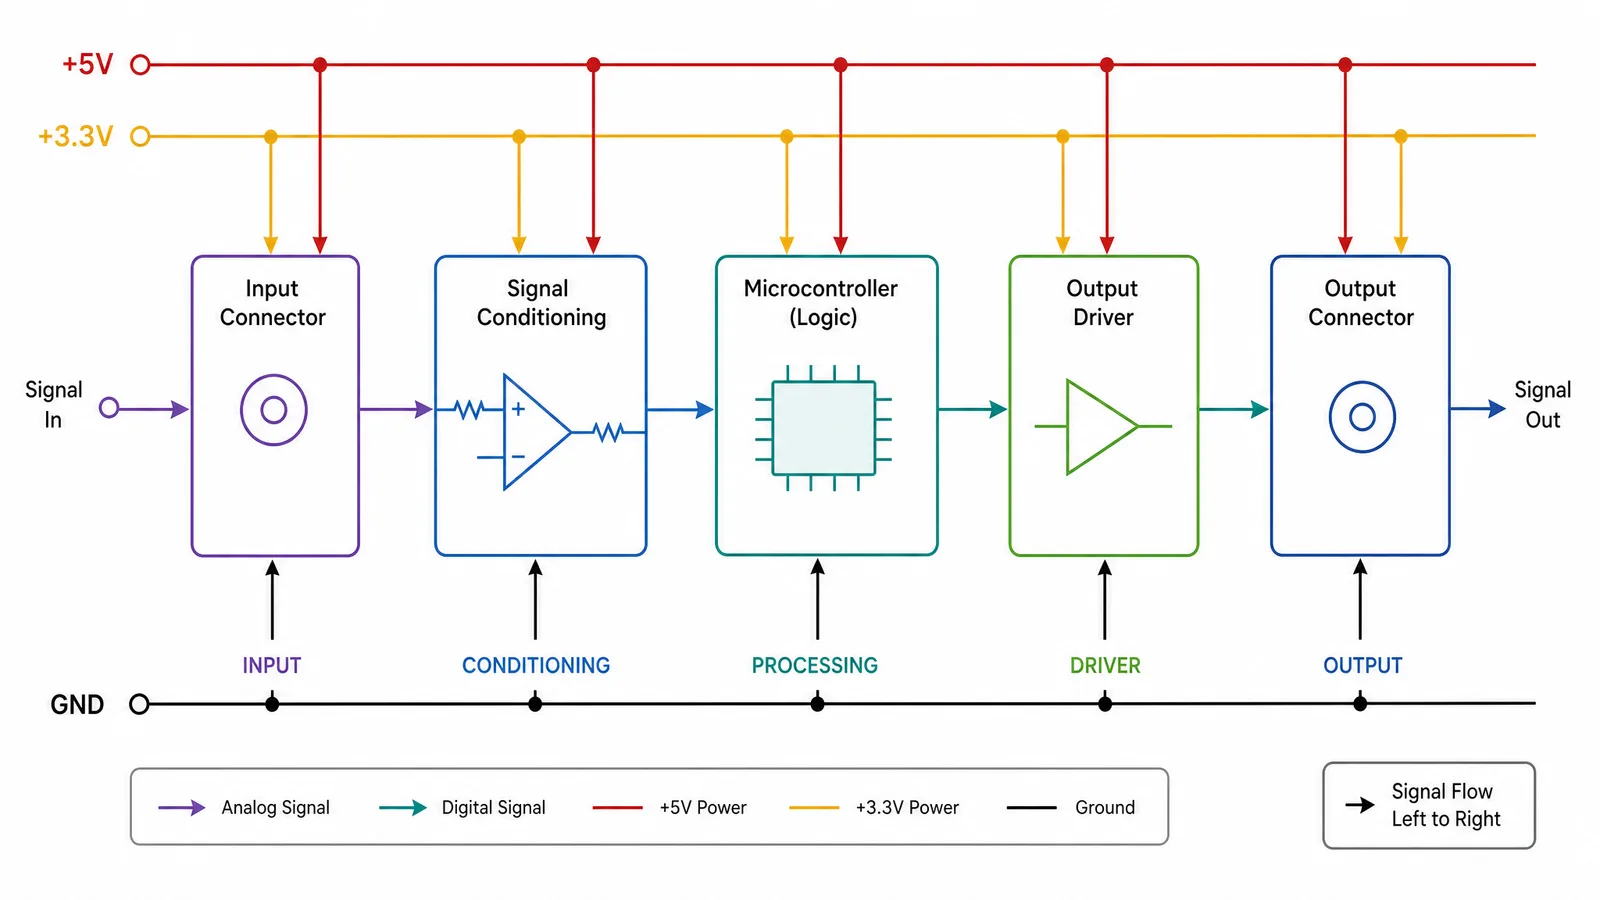
For explanatory figures, these are frequently the right answer. You are drawing a diagram of a system, not designing a circuit, and both export clean vector at journal specification.
Conventions That Make Diagrams Readable
- Signal flows left to right, power rails at top and ground at bottom. Readers scan for this.
- Label every connection that matters, with signal name and voltage where relevant.
- Use standard symbols. Improvised symbols force the reader to decode a legend instead of reading the circuit.
- Show only what is relevant. A figure explaining a measurement path does not need every decoupling capacitor.
- Give part numbers for anything a replicator must match, in the caption or a table.
Documenting a Rig for a Methods Section
A wiring figure in a paper serves reproduction, so it needs slightly different content from a design schematic:
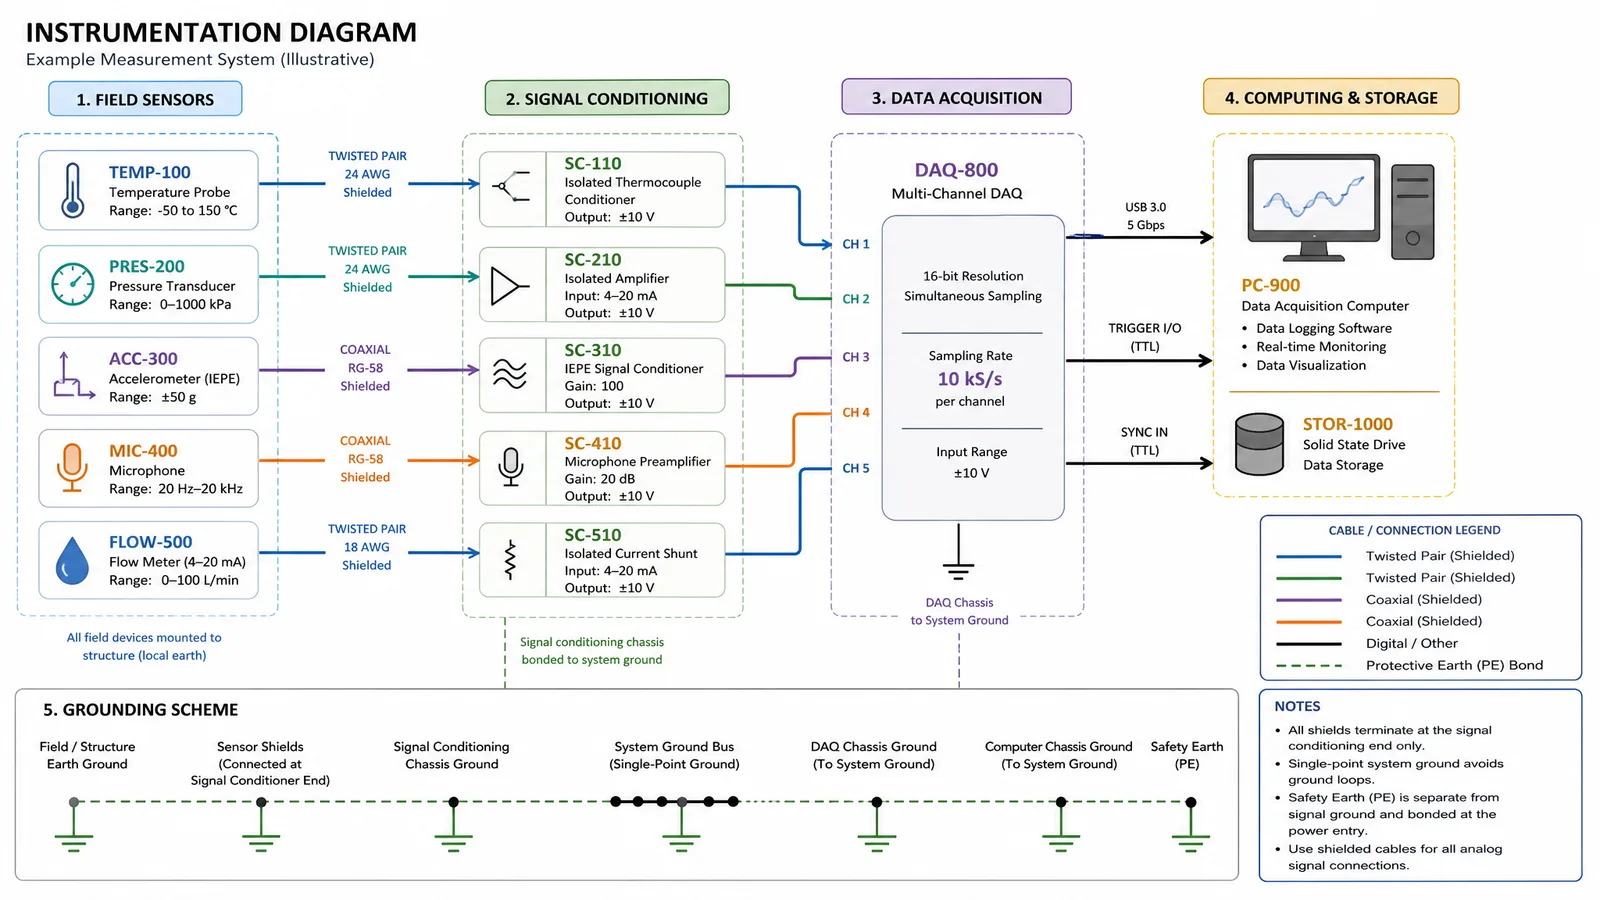
- Model numbers for instruments, not just generic blocks
- Cable and connector types where they affect signal integrity
- Sampling rates and signal levels annotated on the relevant paths
- Grounding scheme, which is frequently the difference between a rig that works and one that does not
Tip
Photograph the actual rig and keep the photo alongside the diagram. The diagram explains the logic, the photo settles arguments about what was physically connected, and together they answer nearly every reproduction question you will receive.
Create Scientific Figures Now
Describe your scientific figure in natural language — get publication-ready illustrations in minutes.
Try FreeRelated Reading
Related reading: Visualize Research with AI Text-to-Figure, How to Add Figures to a Research Paper.