Export Mermaid diagrams to SVG or PDF with the mermaid-cli tool.
Mermaid renders diagrams from text, which makes it excellent for documentation that lives in version control. Getting a file out of it — one you can drop into a manuscript, a slide, or a poster — is a separate step that trips people up, mostly because the default export is a PNG at screen resolution.
The Command Line Route
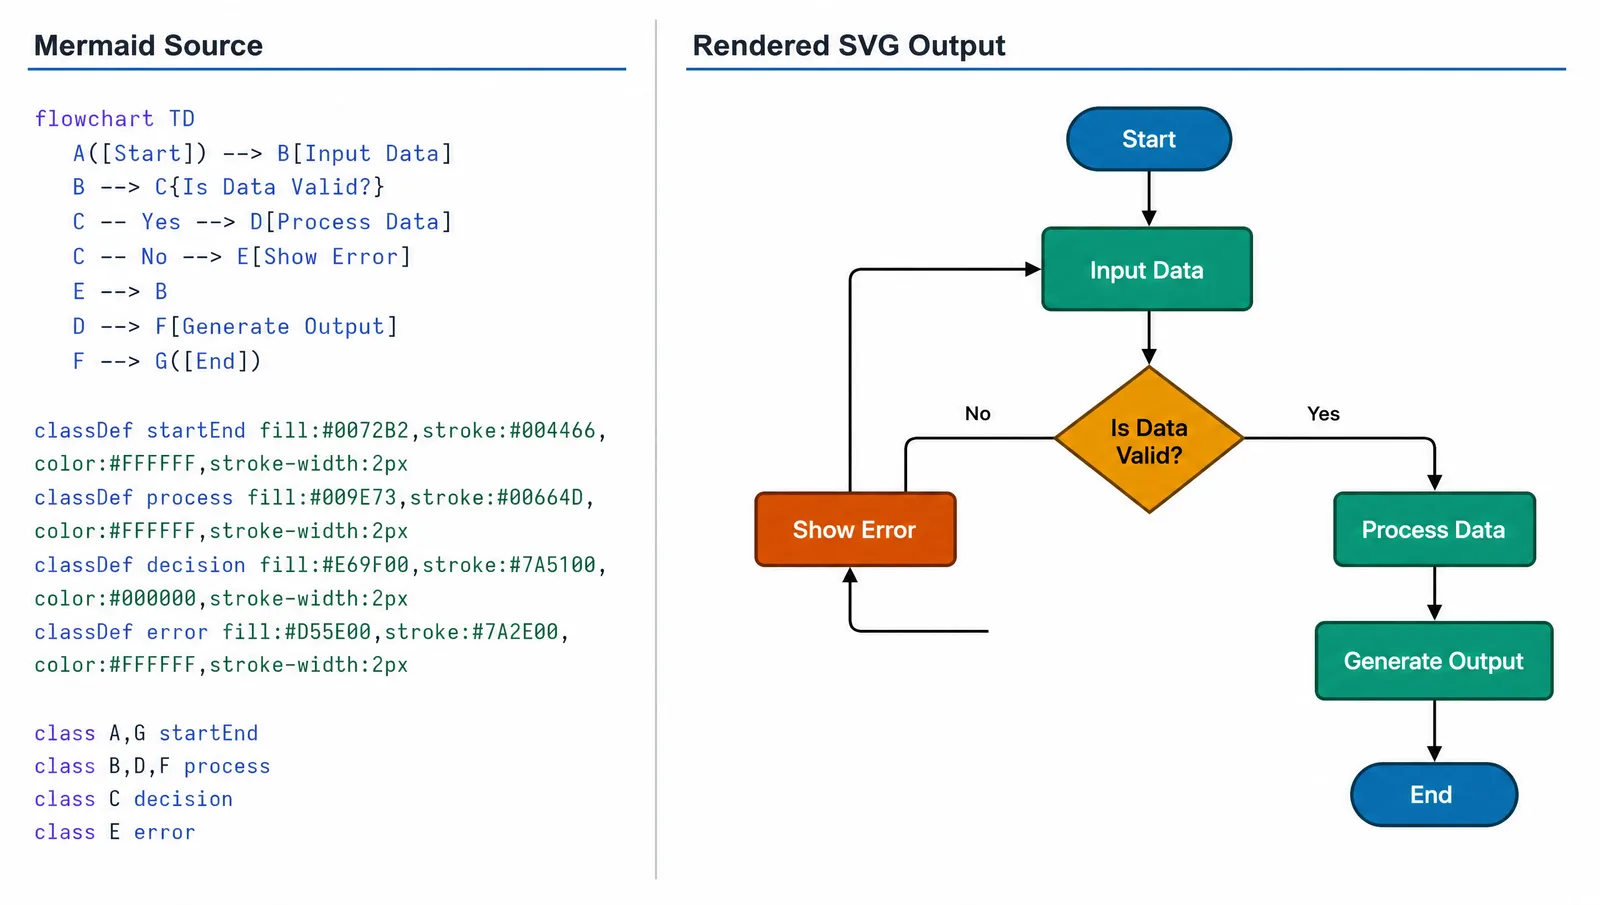
@mermaid-js/mermaid-cli, which exposes an mmdc command:npm install -g @mermaid-js/mermaid-cli
mmdc -i diagram.mmd -o diagram.svg # vector, preferred
mmdc -i diagram.mmd -o diagram.pdf # vector PDF
mmdc -i diagram.mmd -o diagram.png -s 3 # raster at 3x scale| Format | Vector | Good for | Avoid when |
|---|---|---|---|
| SVG | Yes | Web, further editing, most journals | Target requires EPS |
| Yes | Manuscripts, print, slides | You need to edit in a browser tool | |
| PNG | No | Chat, wikis, quick previews | Print or any scaling |
See AI Scientific Figure Generation in Action
Watch how researchers create publication-ready scientific figures from text descriptions.
Explore the ToolOther Export Routes
mmdc is a CLI, diagram rendering can be a build step. A common pattern is committing .mmd sources and generating images during documentation builds, so the rendered output never goes stale relative to the source.- run: npm install -g @mermaid-js/mermaid-cli
- run: mmdc -i docs/architecture.mmd -o docs/architecture.svg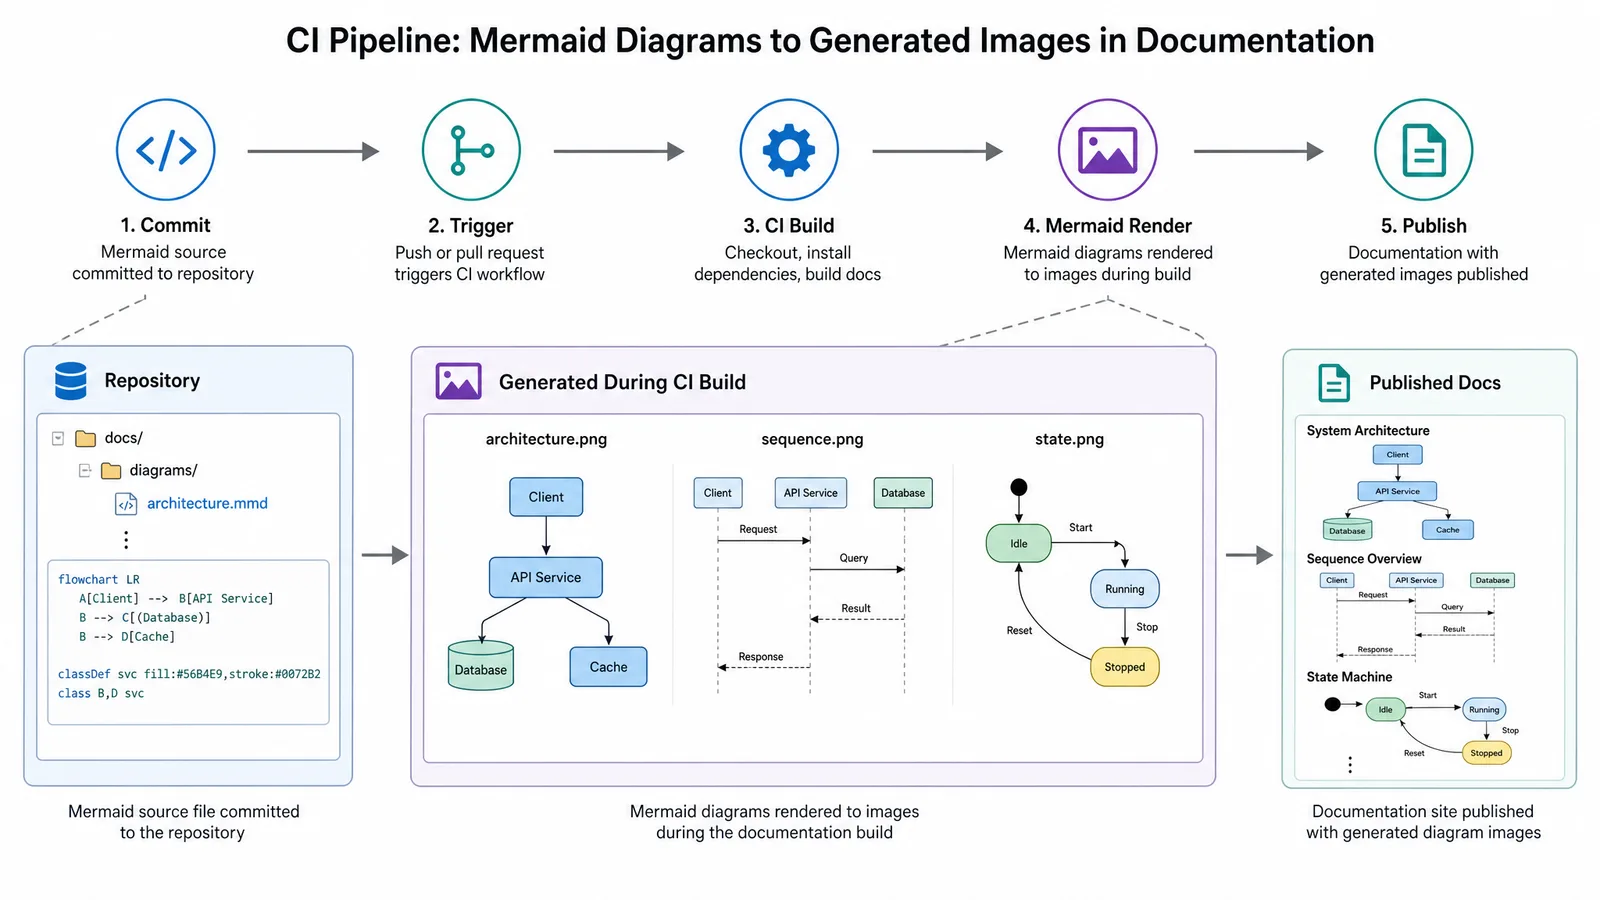
Controlling Appearance
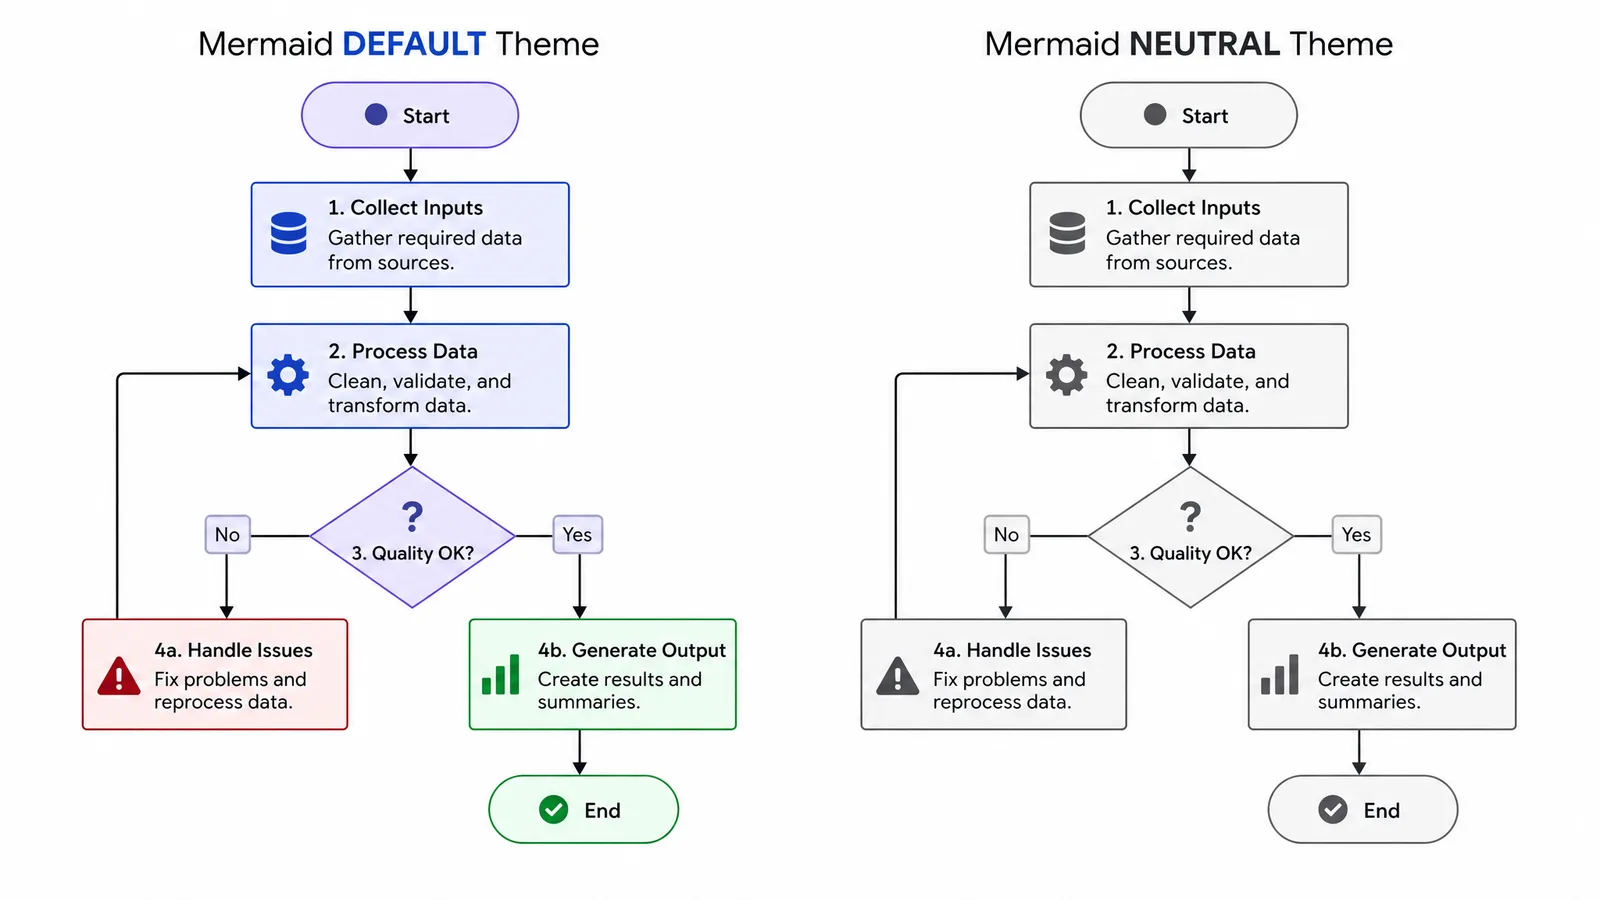
Mermaid's defaults are built for documentation, not for publication. Three levers matter:
- Themes.
%%{init: {'theme':'neutral'}}%%at the top of the file.neutralandbaseprint better than the default. - Fonts. Set
fontFamilyin the init block so the diagram matches the surrounding document. - Direction.
graph LRversusgraph TDchanges the aspect ratio, which matters more than it sounds when fitting a diagram into a column.
%%{init: {'theme':'neutral', 'themeVariables': {'fontFamily':'Helvetica'}}}%%
graph LR
  A[Sample collection] --> B[Extraction]
  B --> C[Sequencing]
  C --> D[Analysis]
When Mermaid Is the Wrong Tool
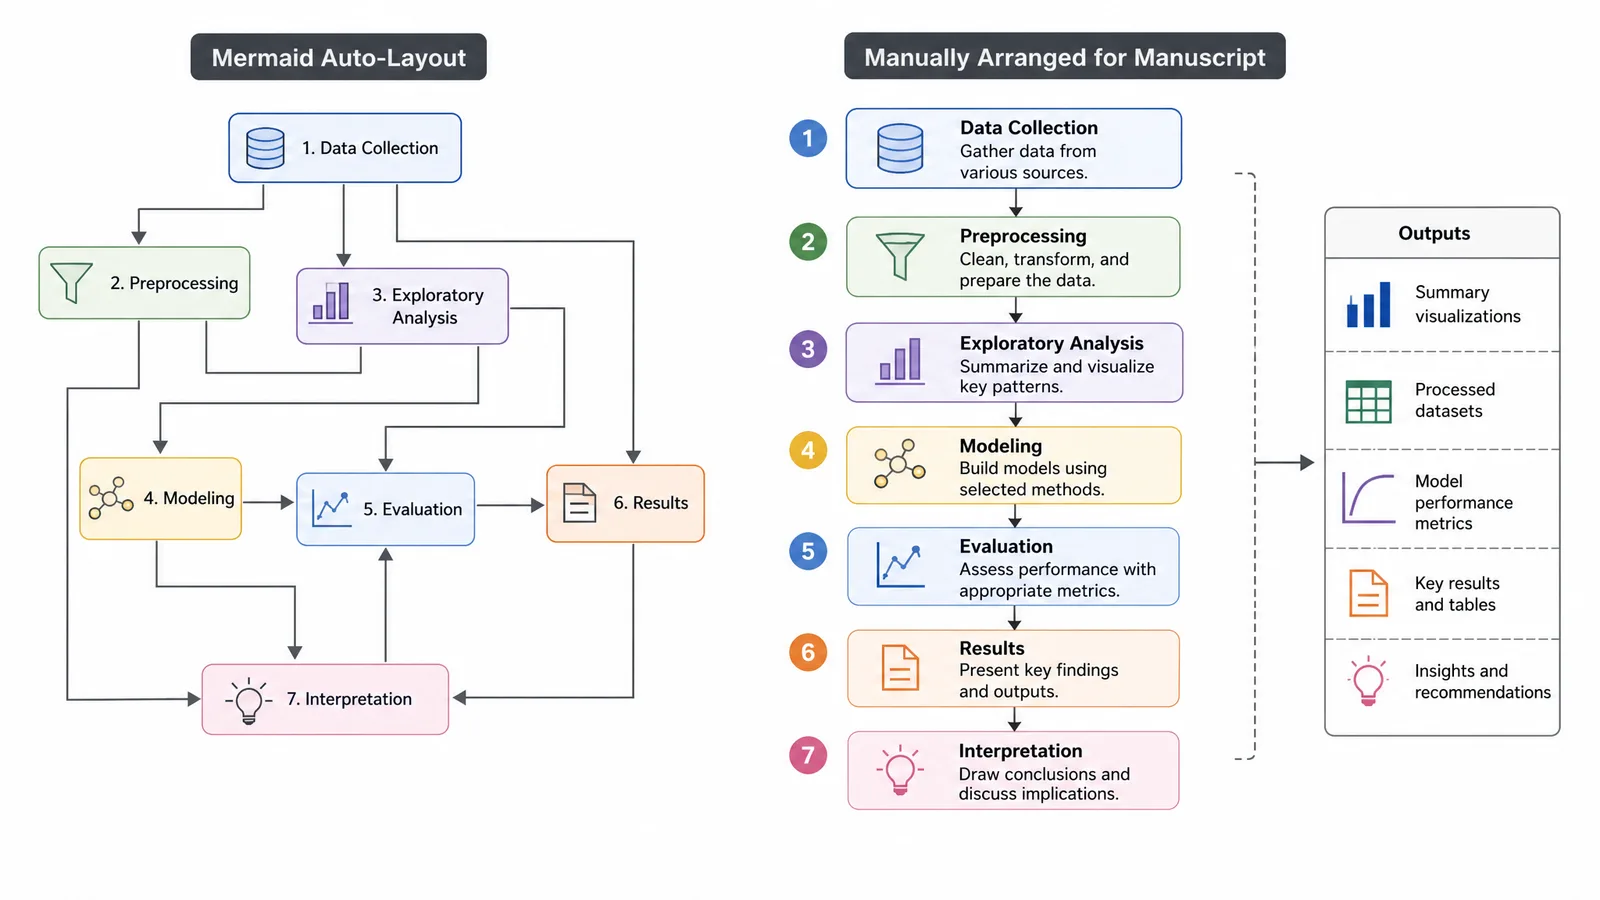
Mermaid computes layout automatically, and you get limited control over it. That is a feature for documentation and a limitation for scientific figures where composition carries meaning.
Reach for something else when you need precise spatial arrangement, when the diagram must match a journal's visual conventions, or when elements need to be positioned to reflect real relationships such as anatomical position or temporal sequence. A workable compromise: generate the structure in Mermaid, export SVG, then finish in a vector editor — accepting that the finishing step breaks regeneration.
Tip
.mmd source alongside the exported image. The source diffs meaningfully in review and regenerates when things change; the image is what people actually look at. Keeping only one of the two costs you either reviewability or convenience.Create Scientific Figures Now
Describe your scientific figure in natural language — get publication-ready illustrations in minutes.
Try FreeRelated Reading
Related reading: Visualize Research with AI Text-to-Figure, 10 Best Scientific Illustration Tools in 2026.