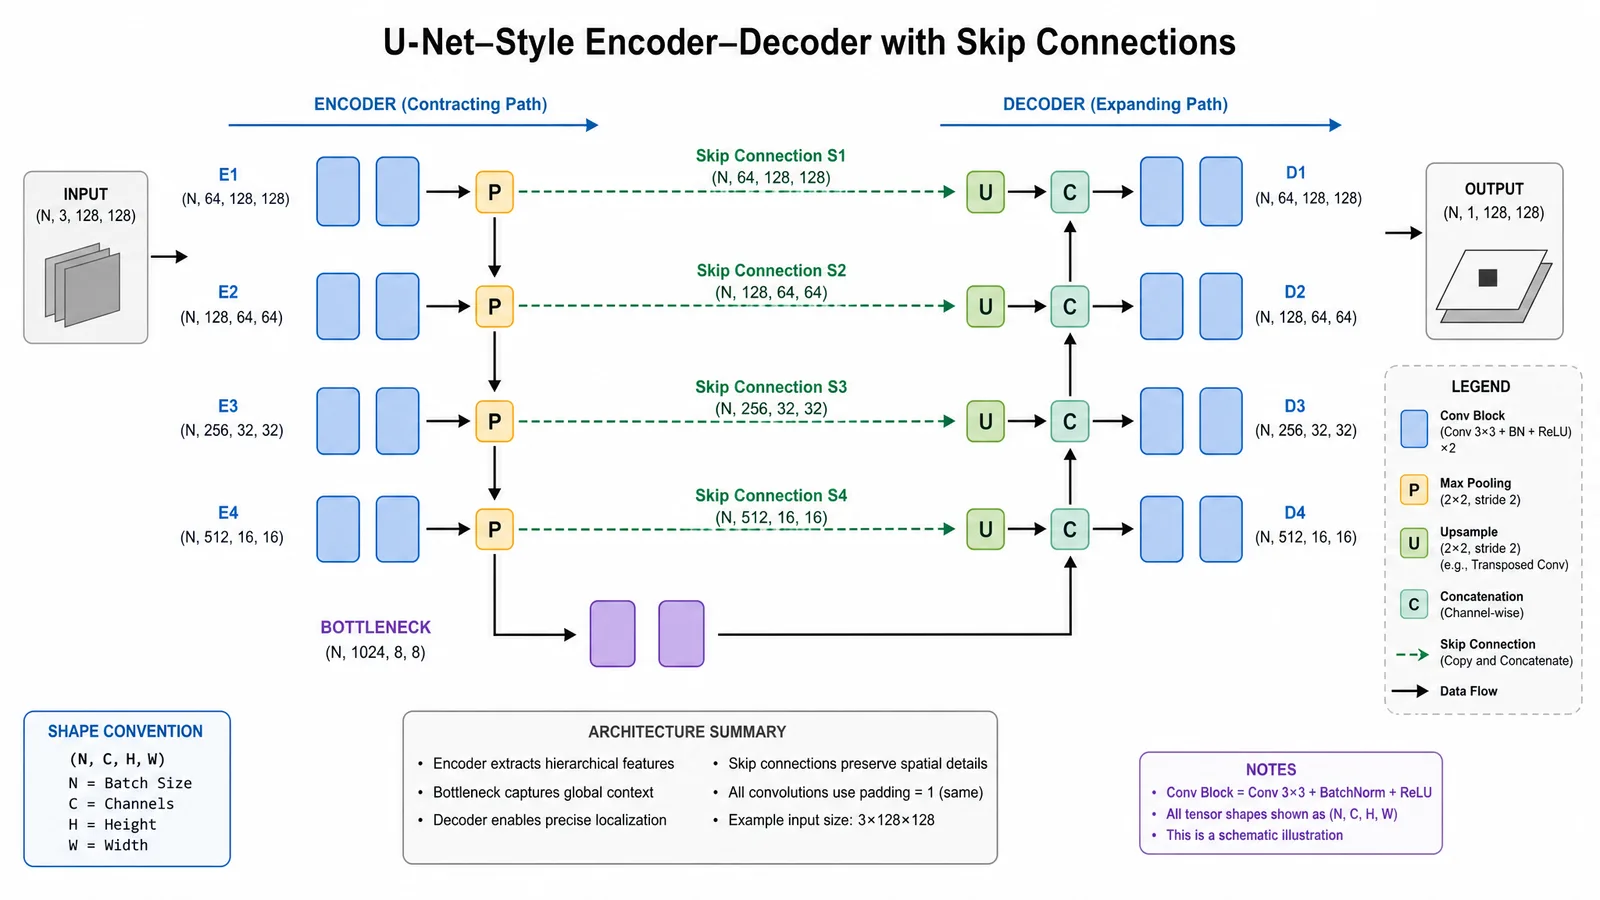
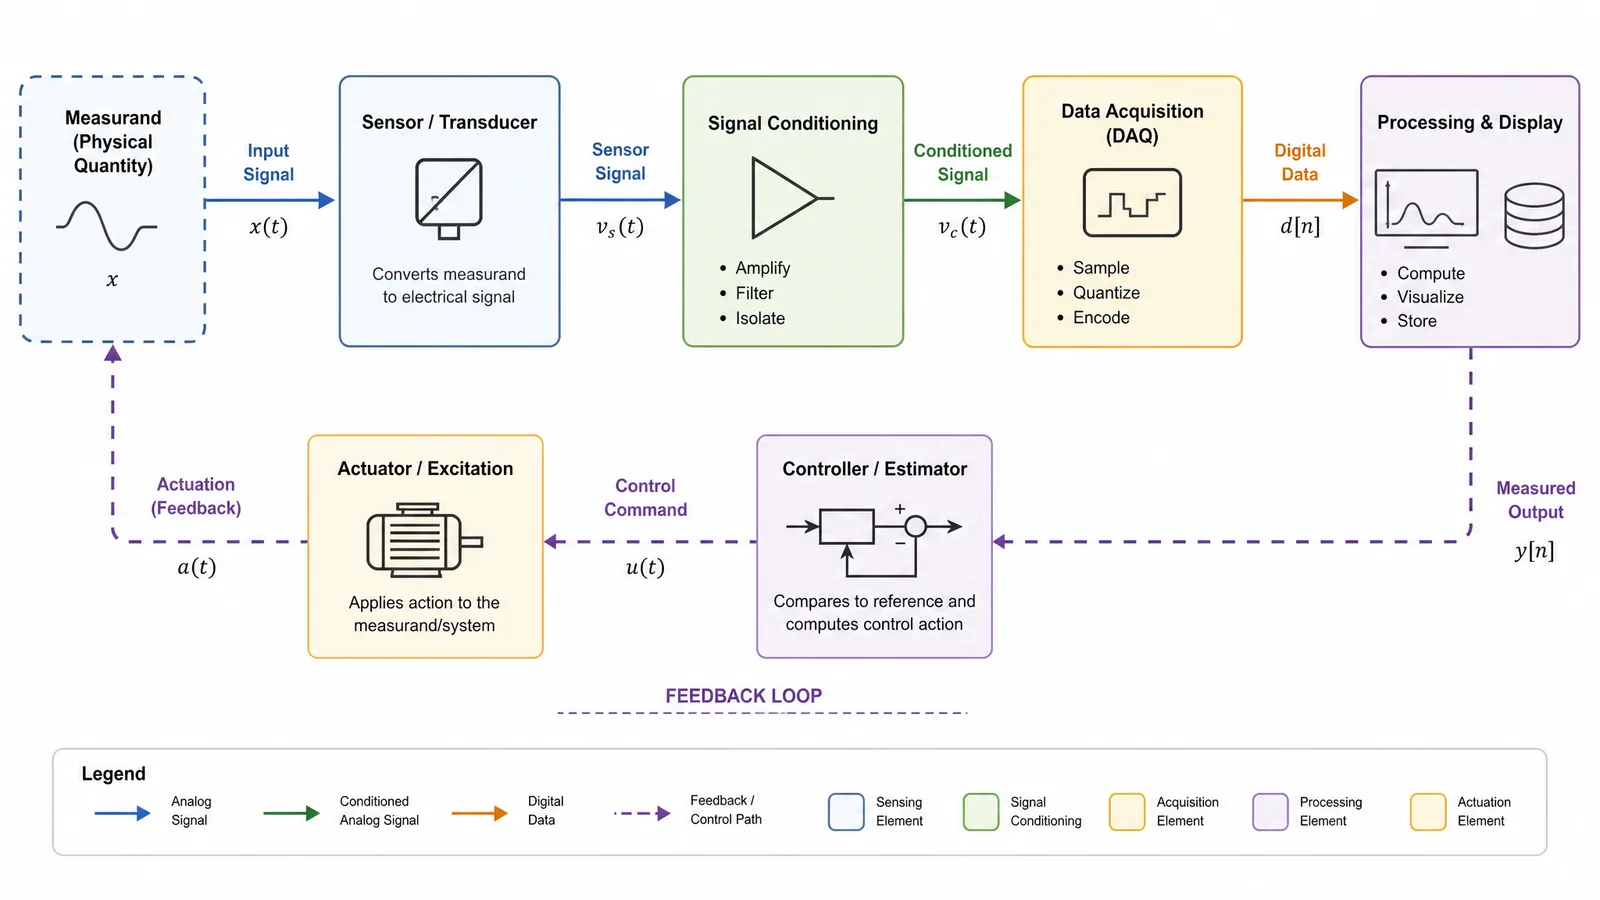
A block diagram shows system components as boxes and their signals as arrows.
It deliberately hides internal detail so the reader can follow how information or material moves through a system. That abstraction is the point: a block diagram that shows implementation detail has stopped being a block diagram and become a schematic.
Pick the Right Granularity
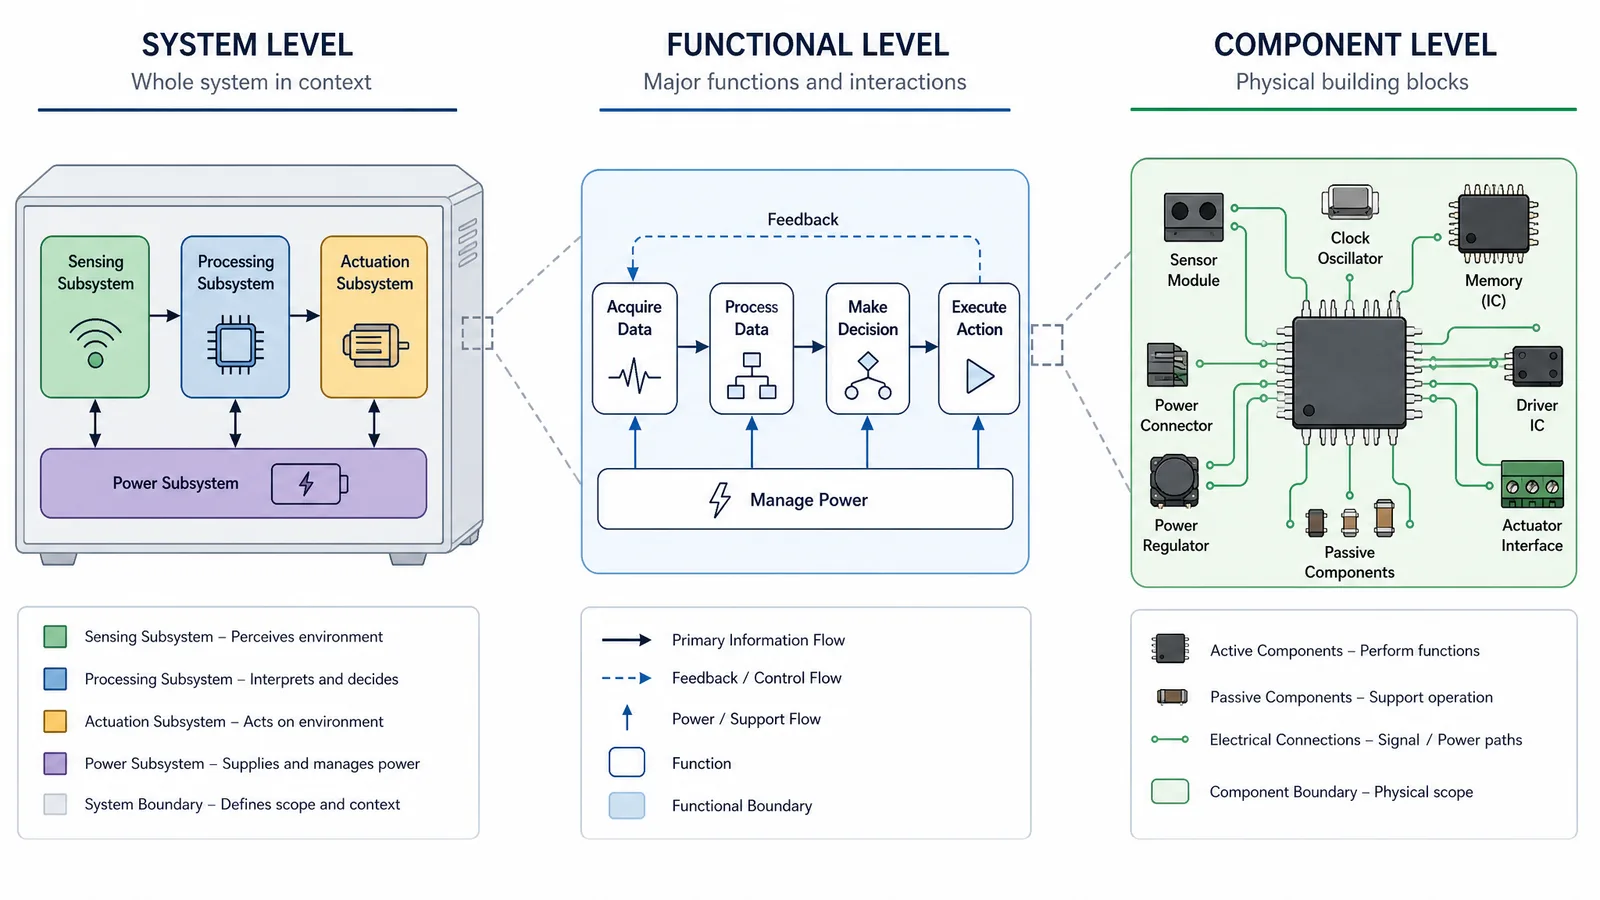
The most consequential decision, and the one most often made by accident. Every block should sit at the same level of abstraction.
| Level | Blocks are | Suits |
|---|---|---|
| System | Whole subsystems | Overview figures, grant proposals |
| Functional | Discrete functions | Methods sections, most papers |
| Component | Individual devices | Build documentation, replication |
A diagram containing "Data acquisition subsystem" beside "10 kΩ resistor" is mixing levels, and readers cannot tell which blocks matter.
See AI Scientific Figure Generation in Action
Watch how researchers create publication-ready scientific figures from text descriptions.
Explore the ToolLabelling Rules
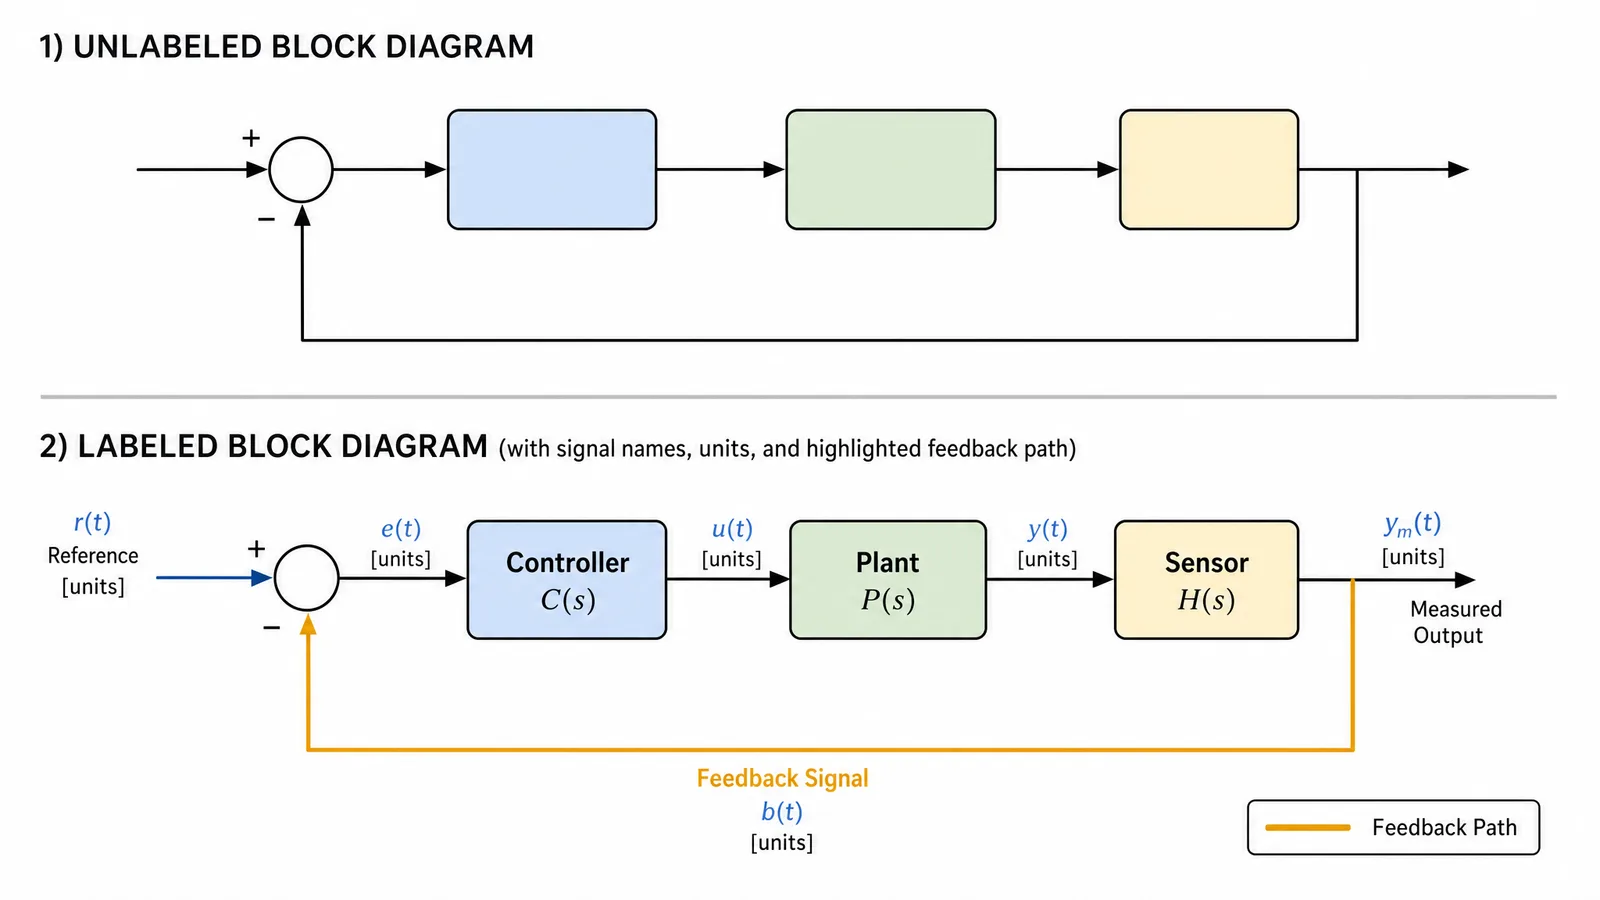
- Blocks get noun phrases describing what they are or do: "Bandpass filter", "Sample chamber".
- Arrows get the signal name, plus units where relevant: "Voltage (mV)", "Filtered signal, 0.1-100 Hz".
- Direction is meaning. An arrow asserts flow. Bidirectional exchange gets two arrows or an explicit double head.
- Feedback loops route backwards and should be visually distinct, since they are the part readers most often miss.
Unlabelled arrows are the most common defect. A box-and-arrow diagram with no signal names tells the reader that things connect but not what passes between them, which is usually the interesting part.
Layout Conventions
- Input on the left, output on the right. Or top to bottom. Never mixed within one scientific figure.
- Feedback returns below the forward path.
- Align blocks on a grid. Misalignment reads as significance that is not there.
- Keep block sizes similar unless size encodes something, in which case say so.
- Minimise crossings. Where a crossing is unavoidable, use a hop or a break so it is clearly not a junction.
Tools
| Tool | Strength | Export |
|---|---|---|
| draw.io | Fast, free, offline | SVG, PDF |
| Inkscape | Full control, finishing | SVG, PDF, EPS |
| Graphviz / D2 | Auto-layout, regeneratable | SVG, PDF |
| Simulink / LabVIEW | Executable models | Screenshot, limited vector |
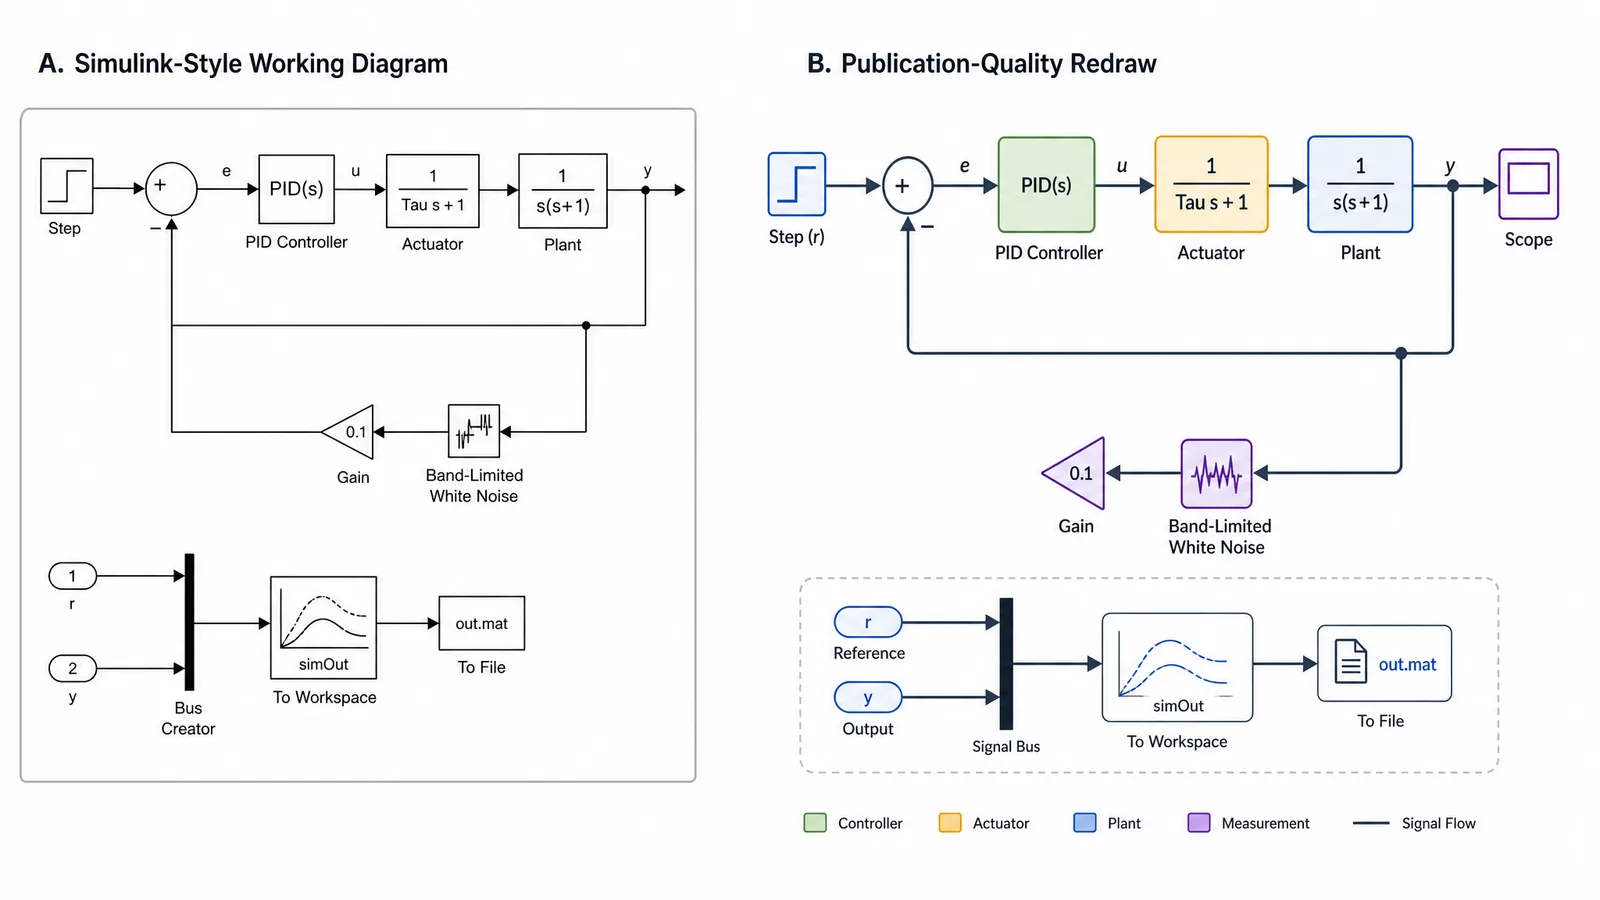
A caution on the last row: diagrams from simulation environments are working documents. Their default styling — small type, dense annotation, tool chrome — rarely meets publication standards, so rebuild them cleanly rather than screenshotting.
Tip
Test the diagram by tracing one signal from input to output aloud. If you have to backtrack, hesitate, or explain something not on the page, the diagram is incomplete — and a reader without your knowledge will get lost at exactly that point.
Create Scientific Figures Now
Describe your scientific figure in natural language — get publication-ready illustrations in minutes.
Try FreeRelated Reading
Related reading: Visualize Research with AI Text-to-Figure, How to Add Figures to a Research Paper.