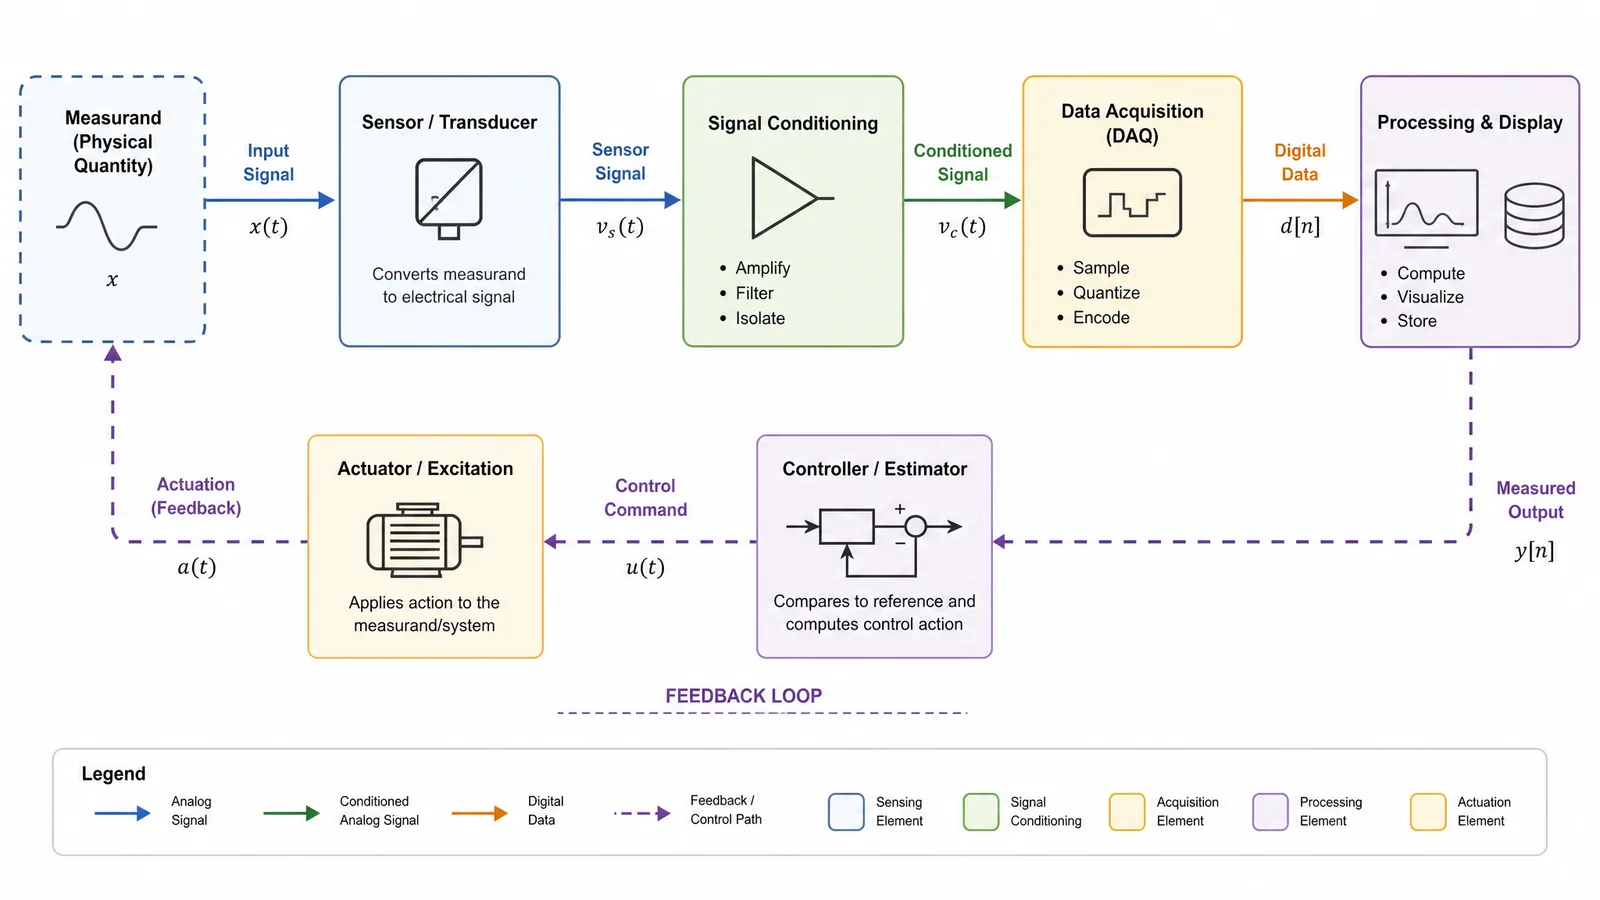
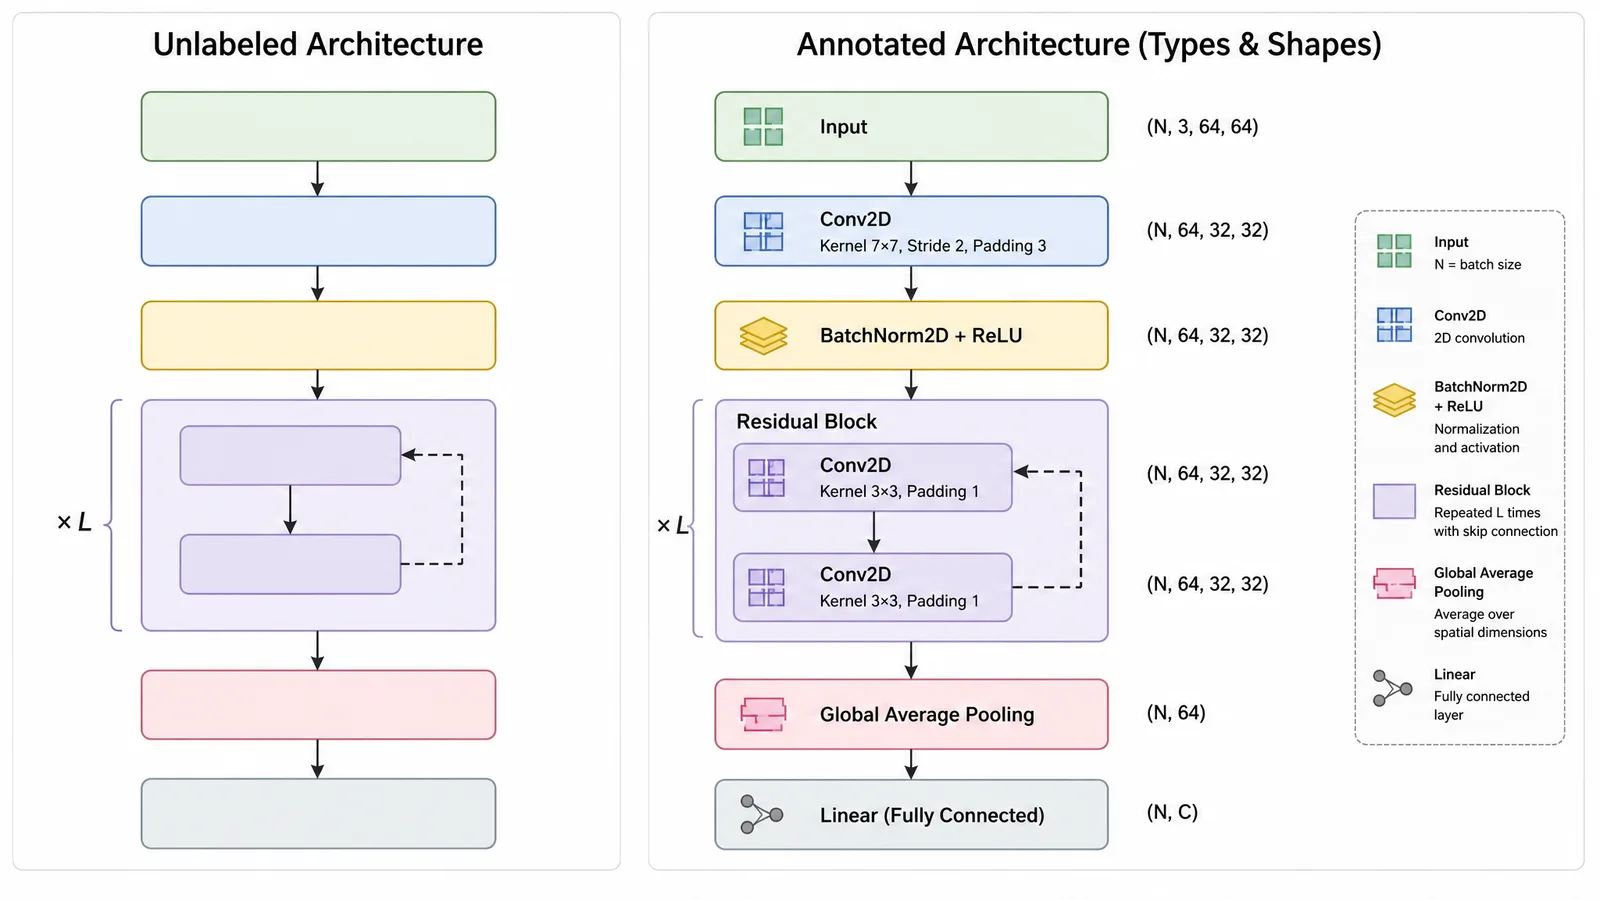
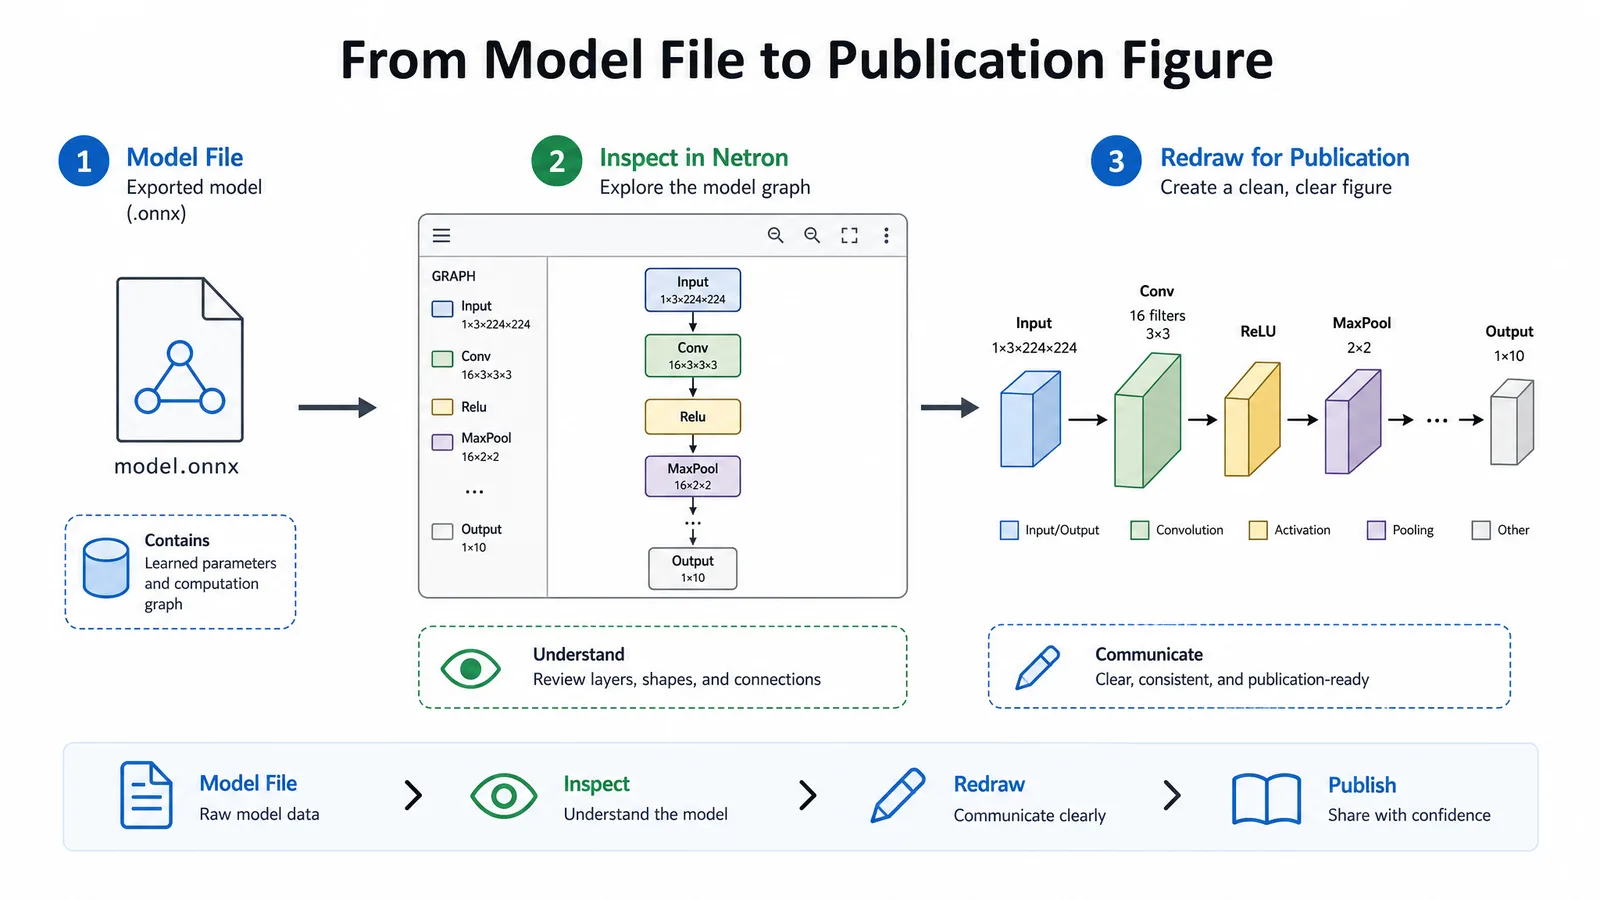
A good architecture diagram shows data flow, layer types, and tensor shapes.
Those three things are what a reader needs to reimplement your model, and they are exactly what most architecture scientific figures omit. A diagram of undifferentiated boxes joined by arrows looks like a neural network without communicating one.
Decide the Level of Abstraction First
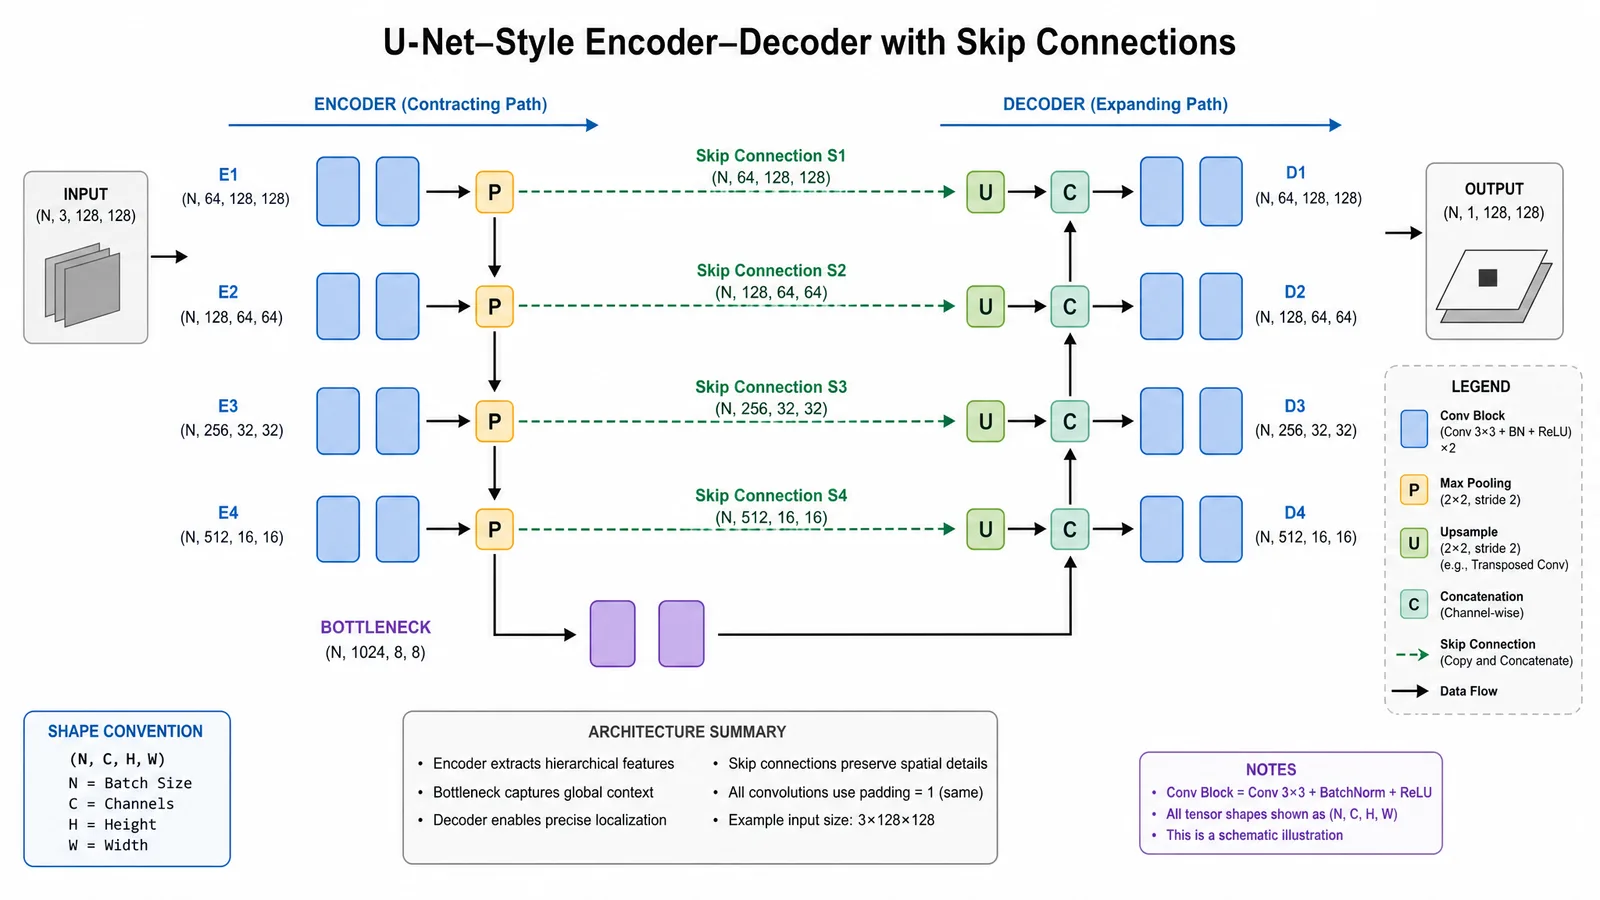
Three levels are common, and mixing them in one figure is the most frequent mistake.
| Level | Shows | Use when |
|---|---|---|
| Neuron level | Individual units and weights | Teaching how a small network works |
| Layer level | Layers as blocks with shapes | Nearly all research papers |
| Block level | Repeated modules as single units | Deep architectures with repetition |
See AI Scientific Figure Generation in Action
Watch how researchers create publication-ready scientific figures from text descriptions.
Explore the ToolWhat to Label
- Layer type. Conv, pooling, normalisation, attention, fully connected. Distinguish by shape or colour, and be consistent.
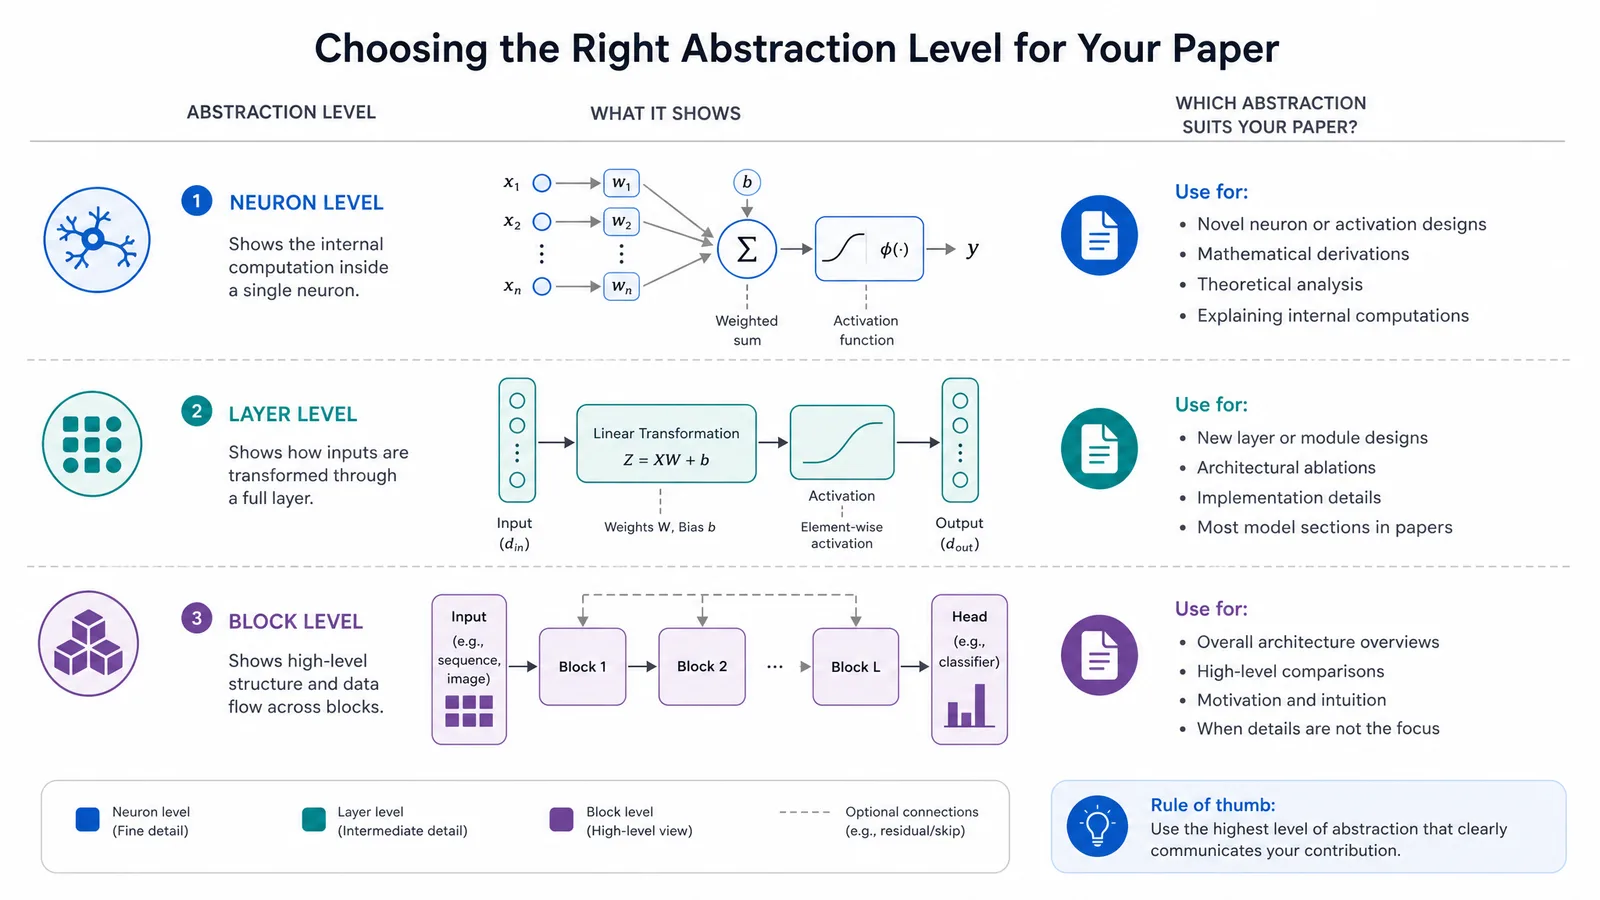
- Tensor shape. Annotate the output shape of each stage. This is the single most useful addition, and it lets a reader verify dimensions without reading your code.
- Key hyperparameters. Kernel size, stride, number of heads. Only where they are not obvious.
- Skip and residual connections. Draw them explicitly. They are structural, not decorative.
- Loss and supervision points. Where gradients enter, especially with auxiliary losses.
Leave out learning rate, optimizer, and batch size — those are training details and belong in the text or a table.
Conventions Readers Expect
- Flow left to right, or top to bottom. Pick one and hold it across every figure in the paper.
- Encode by both shape and colour. Colour alone fails for colourblind readers and in grayscale print.
- Keep repeated blocks visually identical. If two blocks look different, readers assume they are different.
- Show the input and output explicitly, with shapes. Many diagrams start at the first conv layer and leave the reader guessing what goes in.
Tools
| Tool | Approach | Best for |
|---|---|---|
| draw.io / Inkscape | Manual | Full control, publication finishing |
| Graphviz / D2 | Text-defined | Regeneratable, version-controlled |
| PlotNeuralNet | LaTeX | Polished 3D-style CNN figures |
| Netron | Automatic from model file | Verifying actual architecture |
Tip
Draw the diagram from your model definition, not from memory or from an earlier draft of the paper. Architecture figures that disagree with the released code are a common and avoidable source of reproducibility complaints.
Create Scientific Figures Now
Describe your scientific figure in natural language — get publication-ready illustrations in minutes.
Try FreeRelated Reading
Related reading: Visualize Research with AI Text-to-Figure, Scientific AI Prompts: S.S.V.D. Framework.