Step-by-step tutorial to generate publication-ready animal cell diagrams with labeled organelles using AI. From plasma membrane to mitochondria in 10 minutes.
SciFig Team
Scientific Illustration Experts
Your developmental biology paper needs a labeled animal cell diagram by Thursday. The standard options are uninspiring: hunting through a stock image library where every eukaryotic cell looks like it was drawn in 2008, paying $50 for a single image with restrictive commercial terms, or spending three hours in Adobe Illustrator drawing eleven organelles from scratch. None of these are good uses of a Tuesday afternoon.
This tutorial walks through a faster path: generate a publication-ready animal cell diagram with AI in roughly ten minutes, label every organelle correctly, and export a vector version that survives journal print standards. We cover what to prompt for, how to iterate when the first output is wrong, and how to polish the labels so reviewers don't flag your figure for ambiguity. By the end, you'll have a complete cell illustration ready to drop into your manuscript.
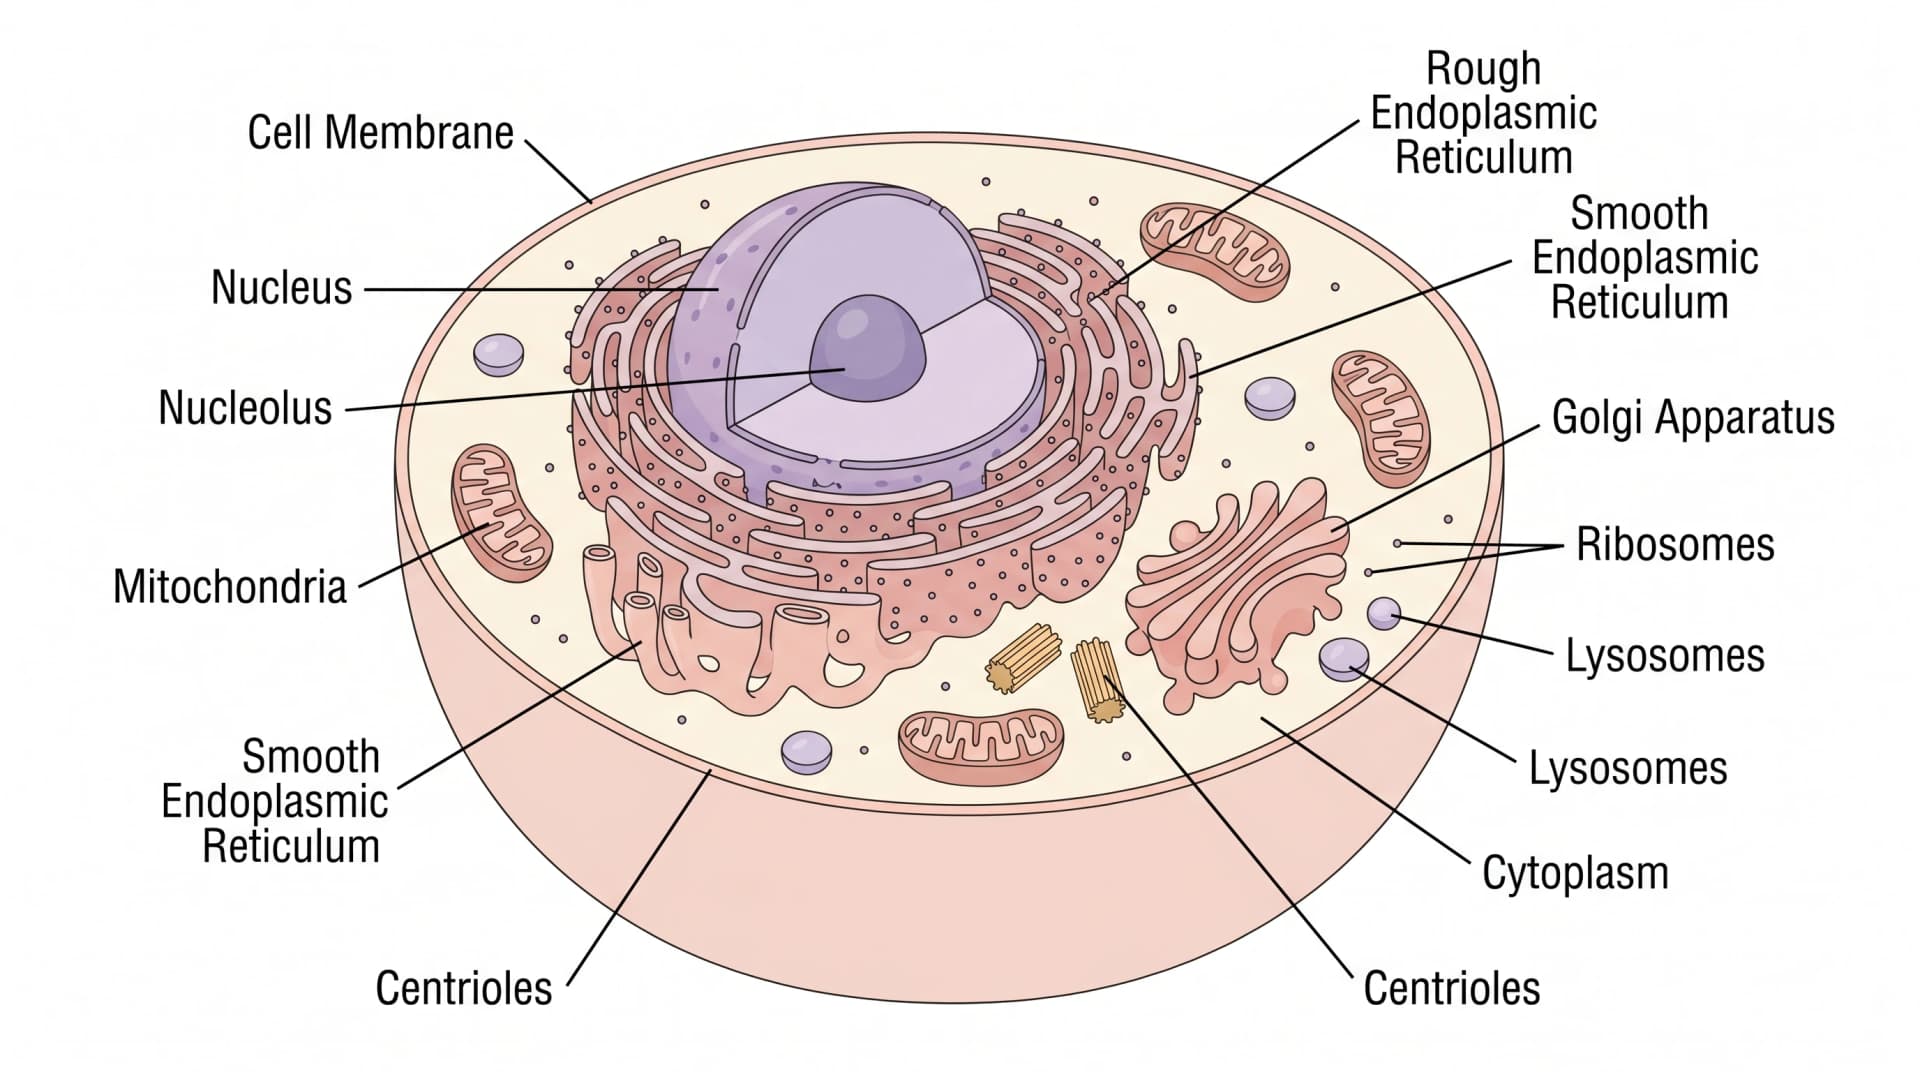
Animal cell diagram with 11 labeled organelles generated with AI (Figure generated with SciFig)
What Is an Animal Cell Diagram and Why Is It Hard to Make?
An animal cell diagram is a labeled cross-section illustration showing the major organelles of a eukaryotic cell — typically the nucleus, mitochondria, endoplasmic reticulum, Golgi apparatus, ribosomes, lysosomes, and cytoplasm, plus the cell membrane and cytoskeletal elements. In research papers, these diagrams establish baseline context for cell biology, developmental biology, pharmacology, and pathology arguments. In textbooks and educational materials, they're the visual anchor for entire chapters.
The difficulty is twofold. First, accuracy matters: organelle shapes, relative sizes, and spatial relationships are subject to peer review by readers who teach undergraduate cell biology. A mitochondrion drawn without cristae, or an ER drawn detached from the nuclear envelope, gets flagged. Second, label placement is constrained: eleven organelles in one frame leaves limited space for non-overlapping leader lines, and journals require labels readable at 50% scale. The combination of accuracy and label discipline is why most researchers default to existing diagrams rather than drawing their own.
AI generation collapses both constraints. A modern domain-tuned model produces anatomically accurate animal cells with all major organelles present in the correct relative positions, and the vector canvas refinement step lets you reposition labels without redrawing the cell. The output that took four hours in Illustrator becomes ten minutes of focused work.
Animal Cell Anatomy: The 11 Organelles You Need to Label
Most journal-quality animal cell diagrams include eleven labeled components. The table below is the canonical set — if your figure omits one, expect a reviewer note.
#
Organelle
Function (one-line)
Visual representation
1
Cell membrane (plasma membrane)
Selective barrier separating cytoplasm from extracellular space
Phospholipid bilayer with embedded proteins
2
Nucleus
DNA storage and gene transcription
Largest organelle, oval, with nuclear envelope and pores
3
Nucleolus
Ribosome subunit assembly
Dense substructure inside the nucleus
4
Mitochondria
ATP production via oxidative phosphorylation
Bean-shaped with visible cristae
5
Rough endoplasmic reticulum
Protein synthesis (ribosome-studded)
Continuous with nuclear envelope, dotted surface
6
Smooth endoplasmic reticulum
Lipid synthesis, detoxification
Tubular, no ribosomes
7
Golgi apparatus
Protein modification and packaging
Stacked flat cisternae
8
Ribosomes
Protein synthesis
Small dark dots on rough ER or free
9
Lysosomes
Cellular waste digestion
Small spherical bodies with enzymes
10
Cytoplasm
Aqueous medium containing all organelles
Light-colored background between structures
11
Centrioles
Mitotic spindle organization
Paired barrel-shaped structures near the nucleus
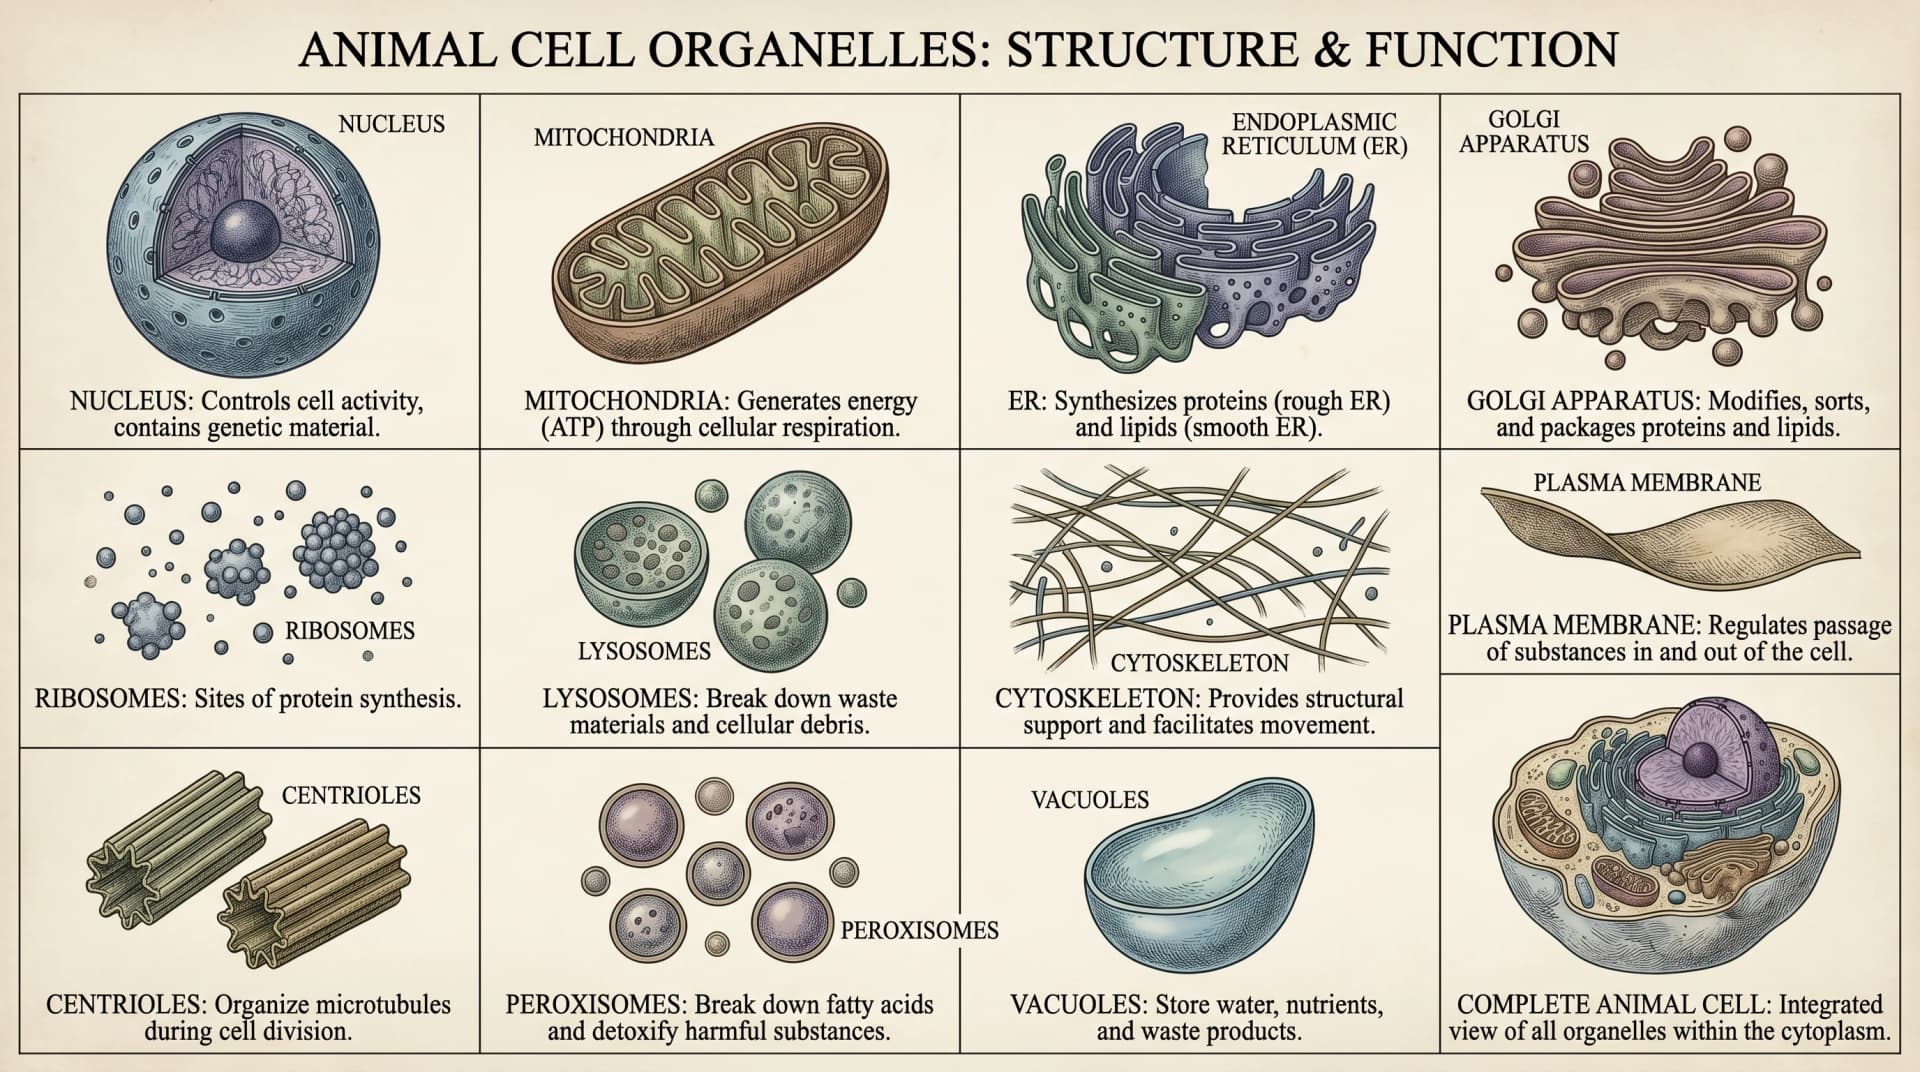
For specialized cell types (neurons, hepatocytes, muscle fibers), this list expands to include cell-specific organelles — but every animal cell diagram, regardless of tissue, includes these eleven as the foundation.
All 11 animal cell organelles separated and labeled with functions (Figure generated with SciFig)
See AI Scientific Figure Generation in Action
Watch how researchers create publication-ready scientific figures from text descriptions.
Before opening any tool, decide two parameters: which animal cell type and how much detail. The choices shape the prompt you'll write.
For a generic eukaryotic cell — the default for most textbook contexts and introductory papers — choose a generic round cell with all eleven organelles visible. This is what undergraduate cell biology figures look like, and it's appropriate for any paper where the cell biology is background rather than the central argument.
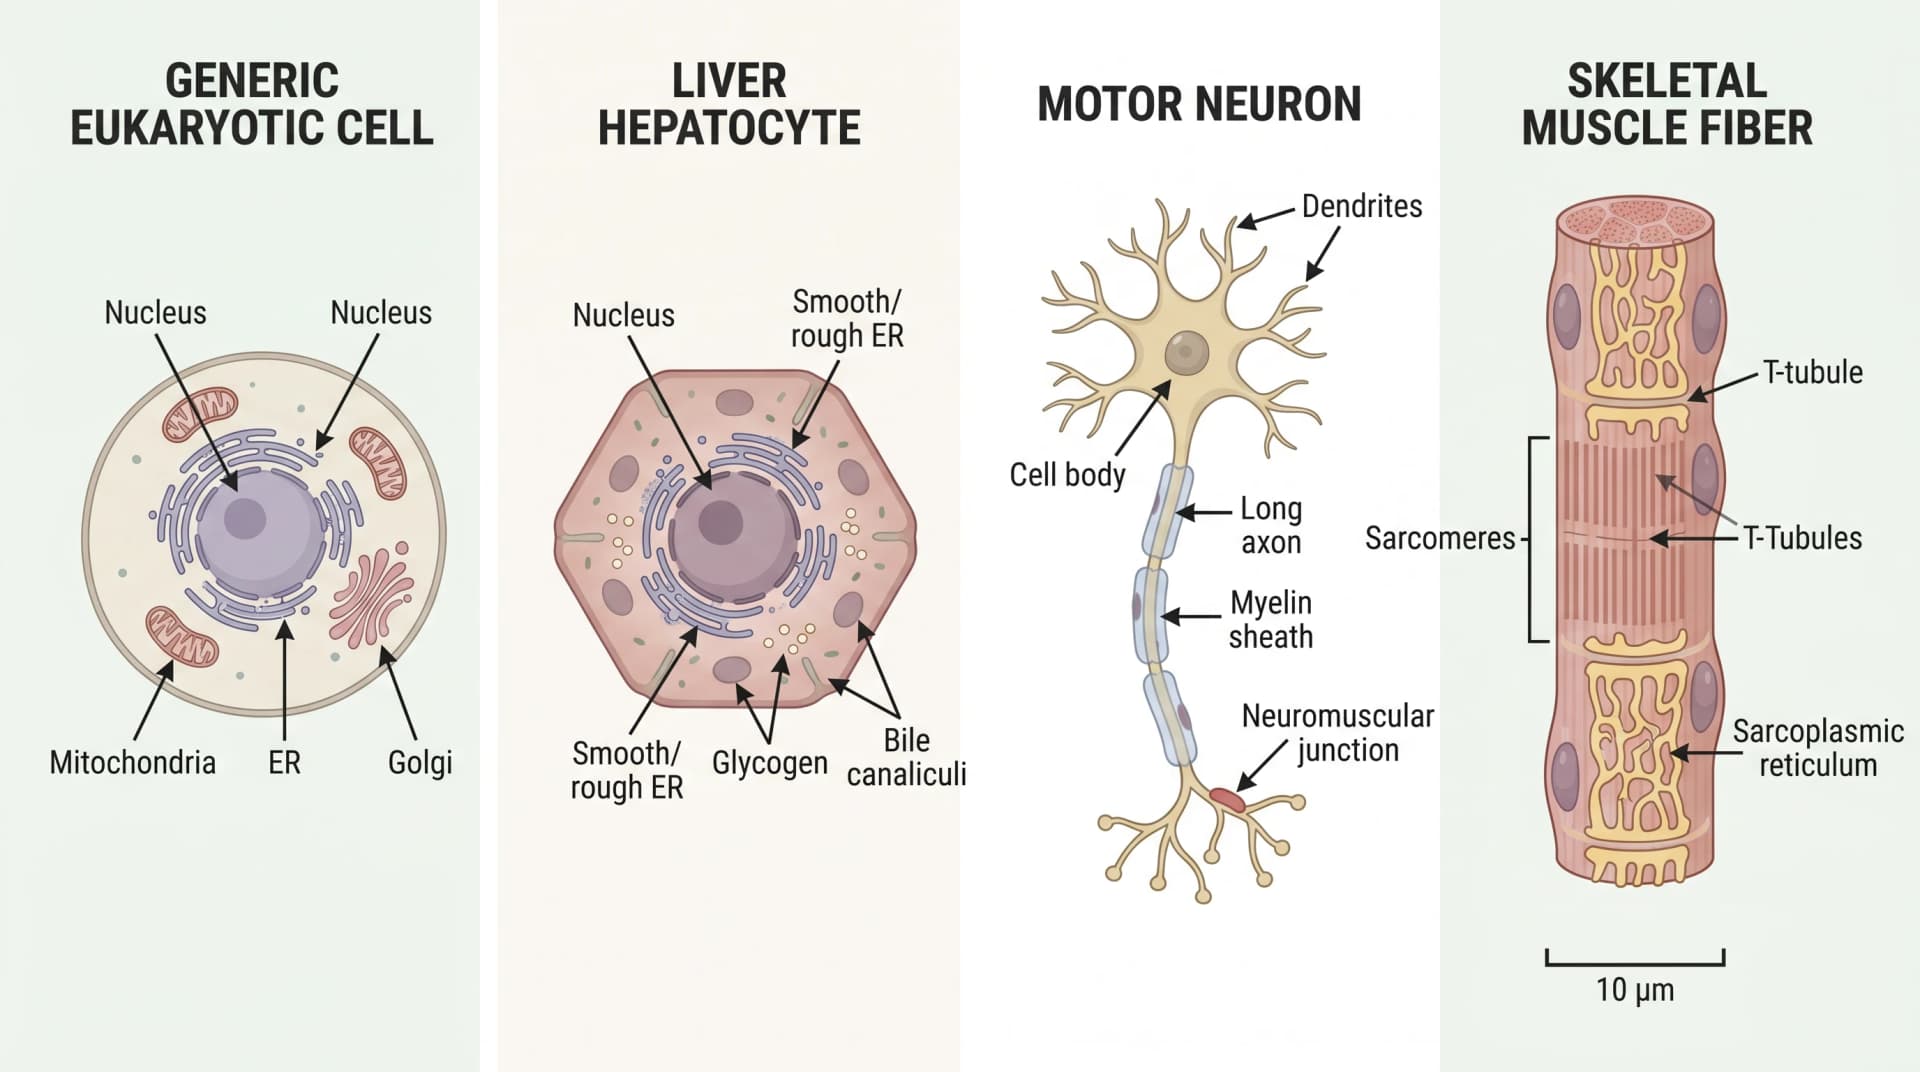
For a specialized cell type, choose the morphology that matches your paper's biology. A liver hepatocyte has dense smooth ER for detoxification and prominent mitochondria — emphasize these in the prompt. A motor neuron has a long axon and characteristic Nissl bodies — request the cell shape explicitly. A skeletal muscle fiber shows aligned sarcomeres and is multi-nucleated — both features must be in the prompt or the output reverts to generic.
For detail level, simple labeled diagram suffices for textbook-style context figures (the eleven organelles, no cytoskeletal subdetail). Detailed cross-section is appropriate when cell biology is the paper's central topic — include cytoskeletal elements (microtubules, microfilaments), nuclear pore complexes, and membrane protein details.
Four animal cell types compared: generic, hepatocyte, neuron, muscle (Figure generated with SciFig)
Step 2: Write Your Text-to-Figure Prompt
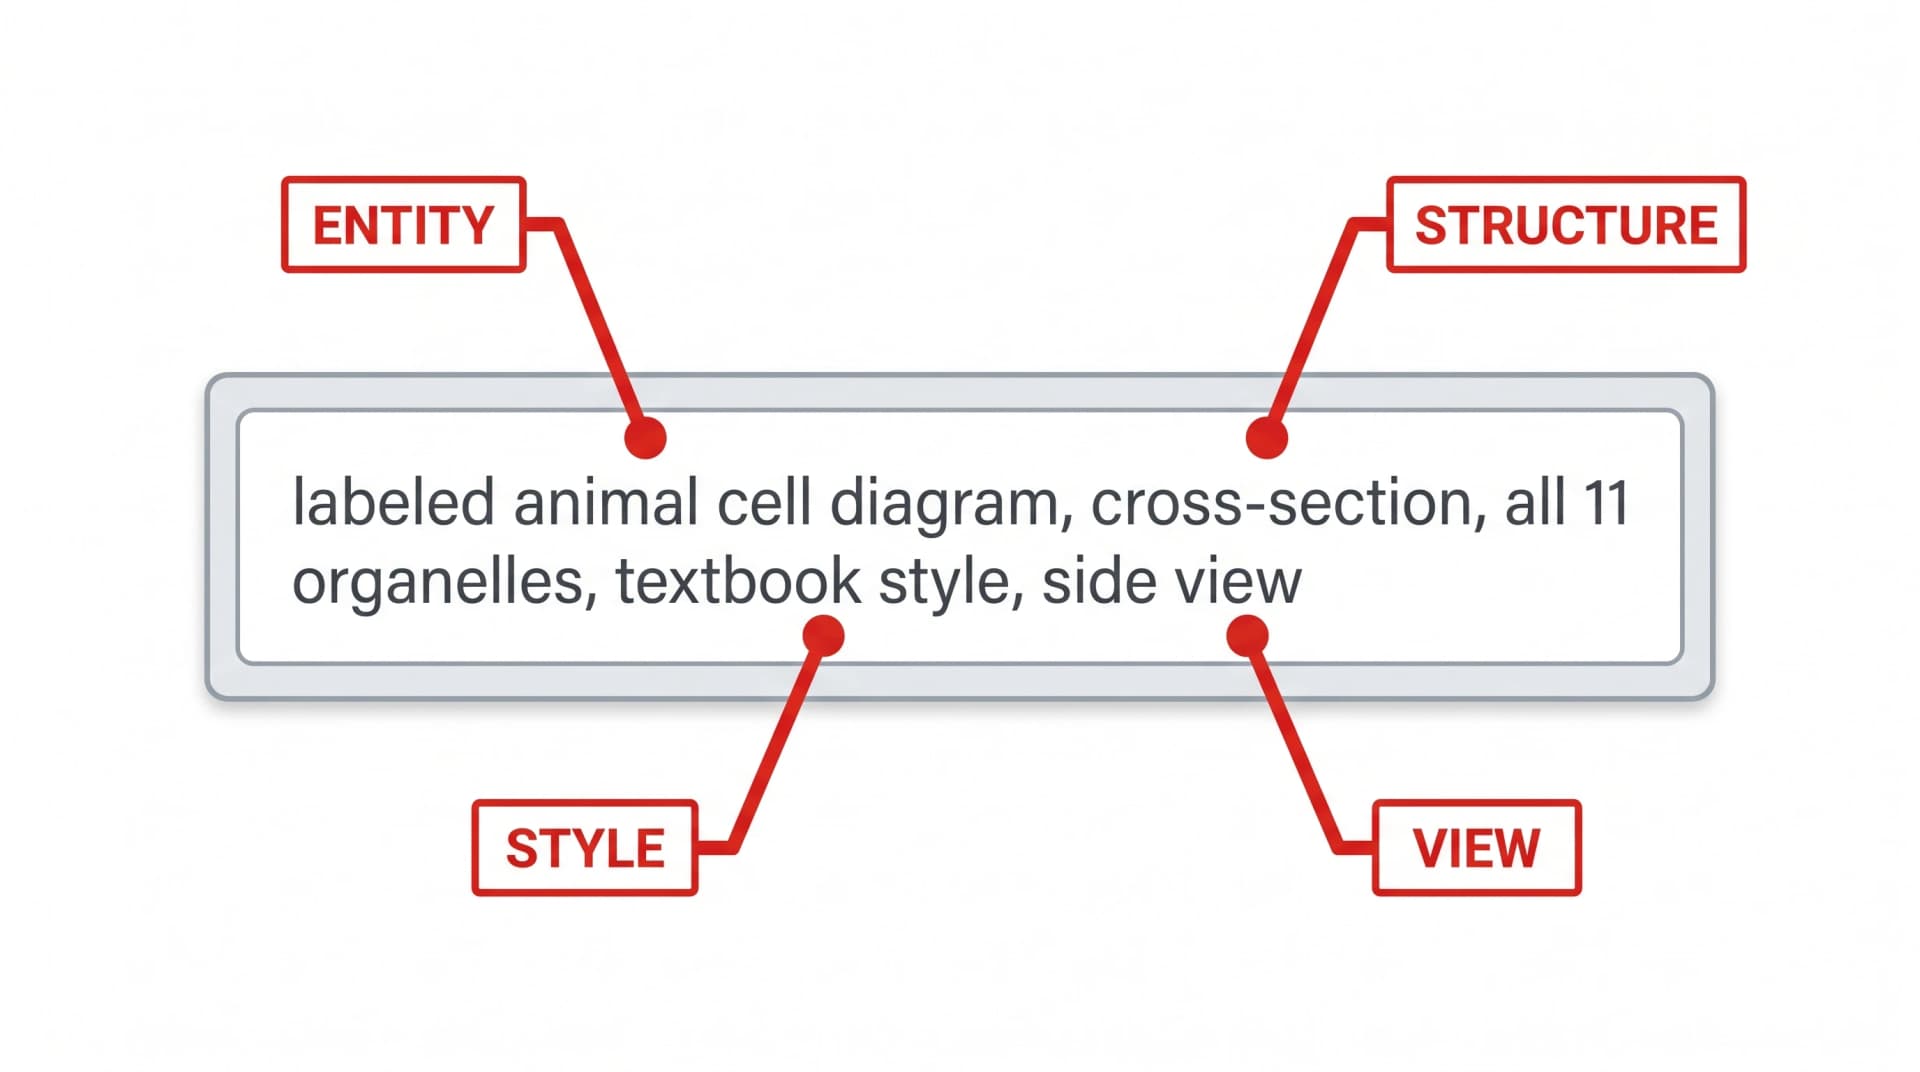
A well-formed prompt for an animal cell diagram has four components — entity, structure, style, and view. We call this the E-S-S-V framework, and it's a subset of the more general S.S.V.D. prompt framework documented in Mastering Scientific AI Prompts.
A working prompt for the generic eukaryotic cell looks like this:
"Labeled animal cell diagram, cross-section view, all 11 major organelles visible (cell membrane, nucleus, nucleolus, mitochondria, rough ER, smooth ER, Golgi apparatus, ribosomes, lysosomes, centrioles, cytoplasm), textbook illustration style, soft pastel colors, clean labels with leader lines, white background."
Each clause does specific work. "Labeled animal cell diagram" sets the entity. "Cross-section view" defines structure (versus side view or 3D rendering). "All 11 major organelles visible (...)" enumerates required components — without this, the model omits two or three. "Textbook illustration style, soft pastel colors" anchors the visual style — without it, the output may default to overly stylized or photographic rendering. "Clean labels with leader lines, white background" dictates label placement and ensures the figure is usable as a paper figure rather than a decorative illustration.
Prompt anatomy: entity, structure, style, view callouts on example prompt (Figure generated with SciFig)
Step 3: Generate and Iterate
The first output is rarely the final figure. Plan to iterate two or three times.
Open SciFig's text-to-figure tool, paste the prompt above, and generate. The first pass typically returns a good cell shape with most organelles present, but with one or two label issues — a missing organelle, an overlapping label, or an unclear leader line. Read the output against the eleven-organelle table from §2 and identify what's missing.
Common iteration patterns:
"Output is missing organelle X" → add explicit emphasis: "...with cell membrane prominently labeled at the perimeter..."
"Labels overlap or are unreadable" → request larger label spacing: "...labels positioned at corners with leader lines, minimum 1cm spacing..."
"Output looks too cartoonish" → reinforce style anchor: "...scientific textbook illustration style, similar to Molecular Biology of the Cell figures..."
"Output looks too detailed for a context figure" → simplify: "...simple labeled diagram, no subcellular detail, organelles shown as outlines only..."
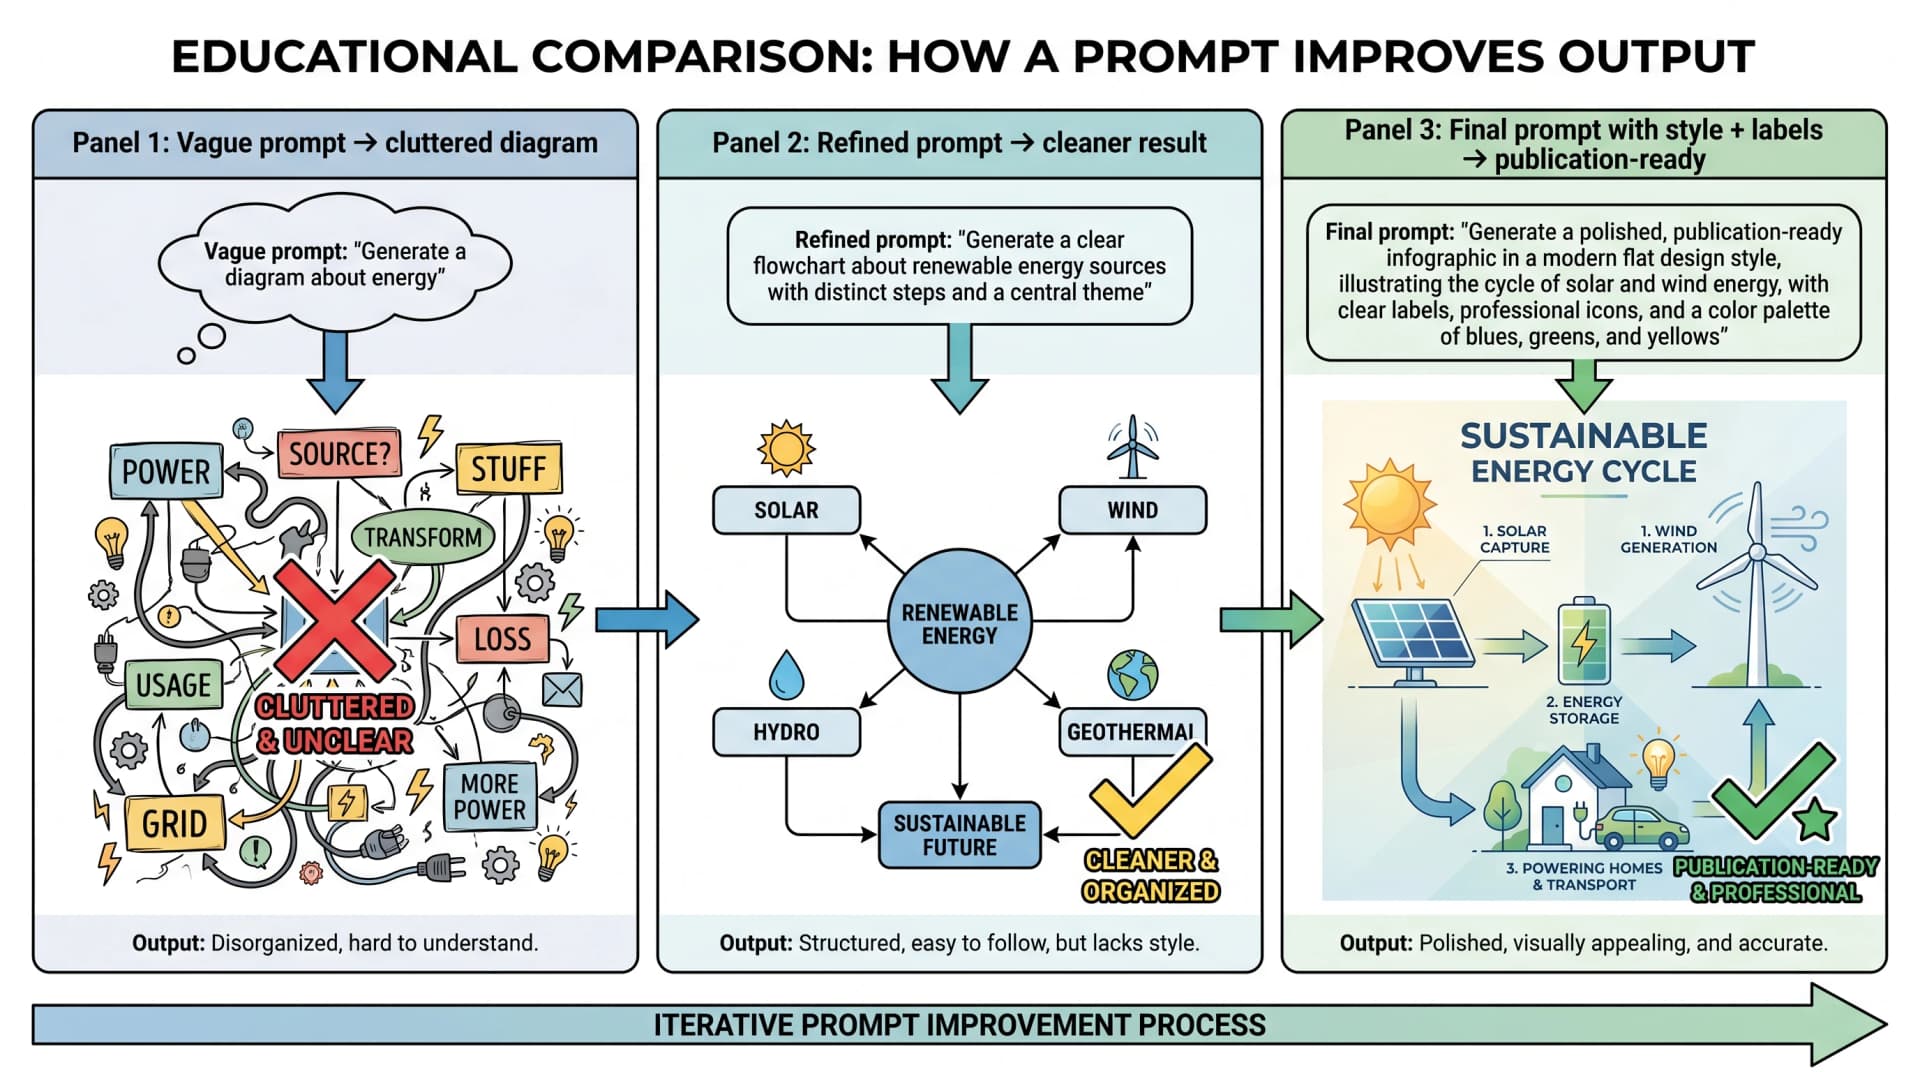
A typical sequence is three generations: first draft → label refinement → final polish. Each generation takes 2–4 minutes, so the entire cycle finishes in 10–15 minutes.
Three-stage iteration: vague prompt to publication-ready (Figure generated with SciFig)
Create Scientific Figures Now
Describe your scientific figure in natural language — get publication-ready illustrations in minutes.
Step 4: Add Custom Labels and Refine in Vector Canvas
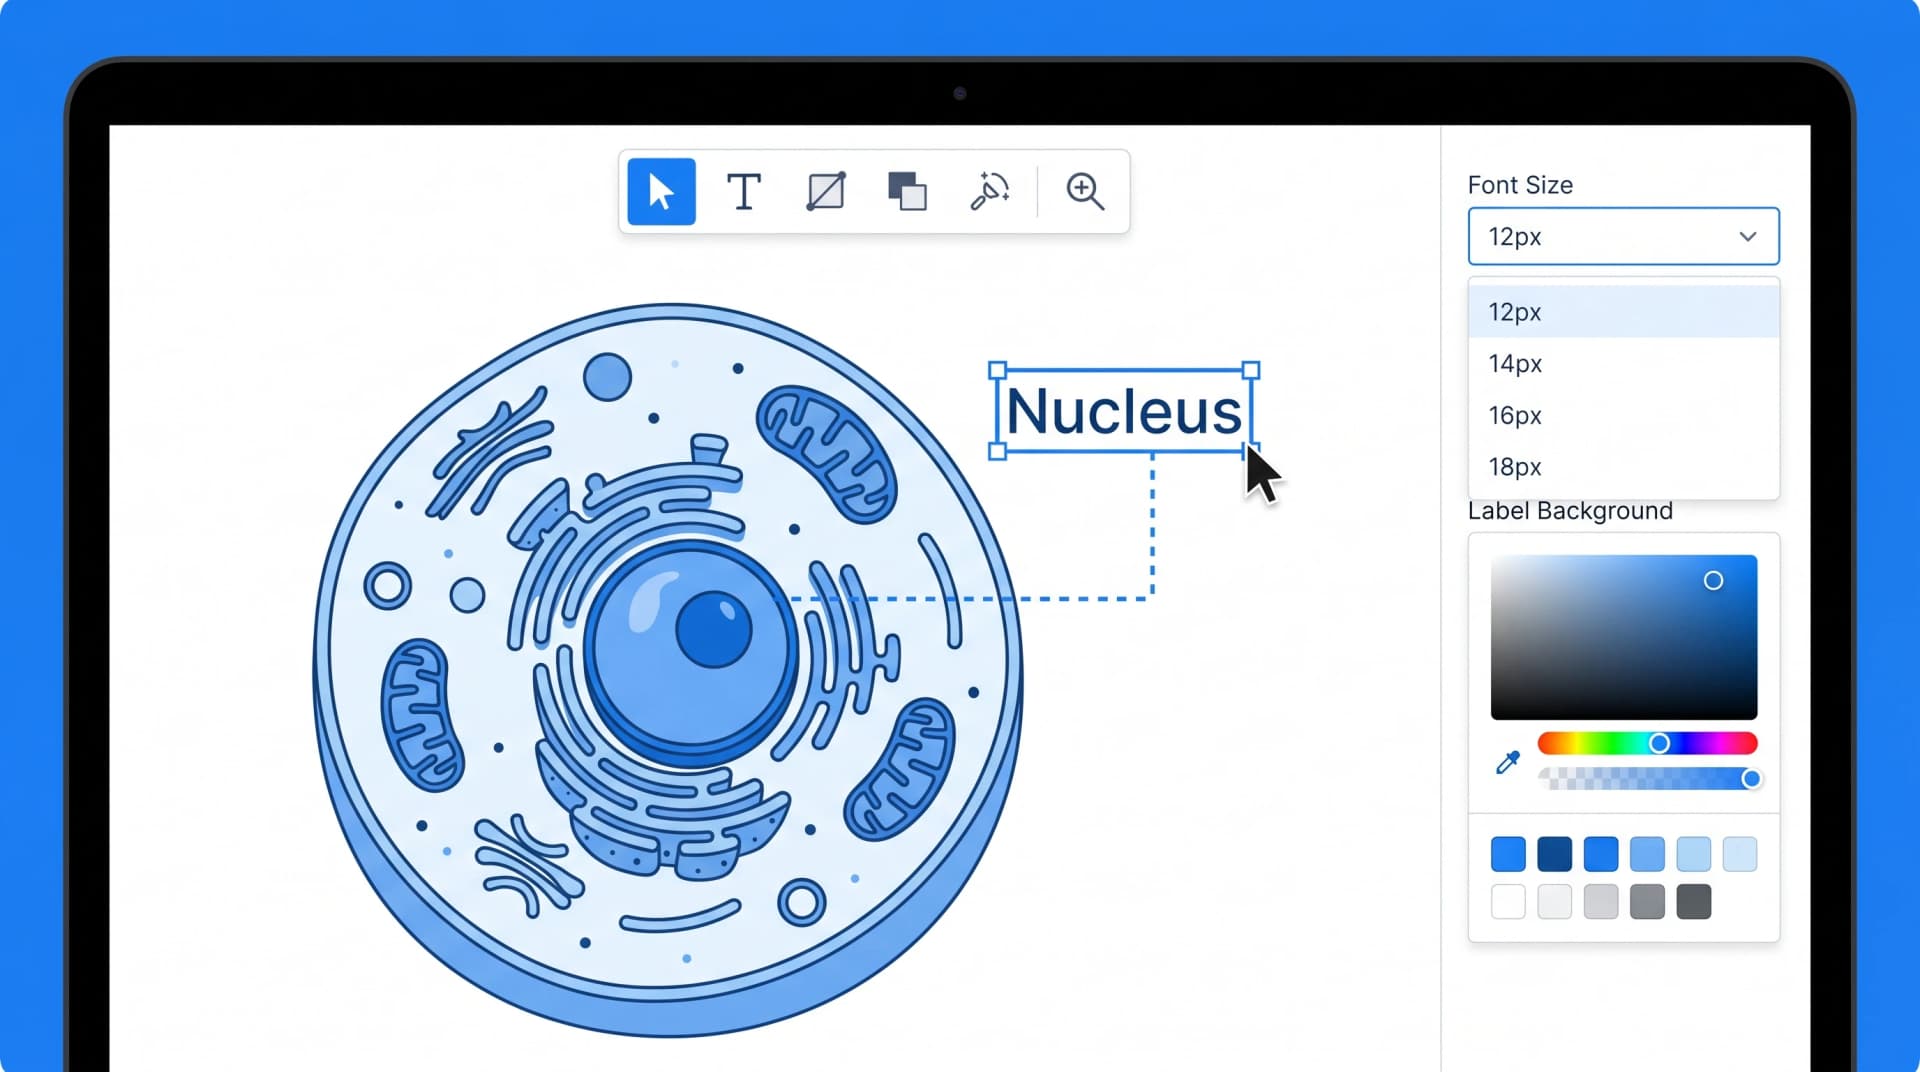
Even with a good final generation, you'll often need to reposition labels for your specific layout — particularly if the figure is going into a multi-panel composition where space is constrained. The vector canvas tool opens the generated figure as a layered SVG, so you can drag labels independently of the cell illustration, change font sizes for journal compliance (most journals require 7–8 pt minimum), and adjust label background colors so they remain readable on top of the cell illustration.
Beyond labels, vector canvas lets you make small content edits — adding an arrow to highlight a specific organelle, color-coding two organelle types for a comparison figure, or removing a label that conflicts with another panel's content. These are 30-second adjustments that would require regenerating in a non-layered workflow.
Animal Cell vs Plant Cell vs Bacteria: Common Questions
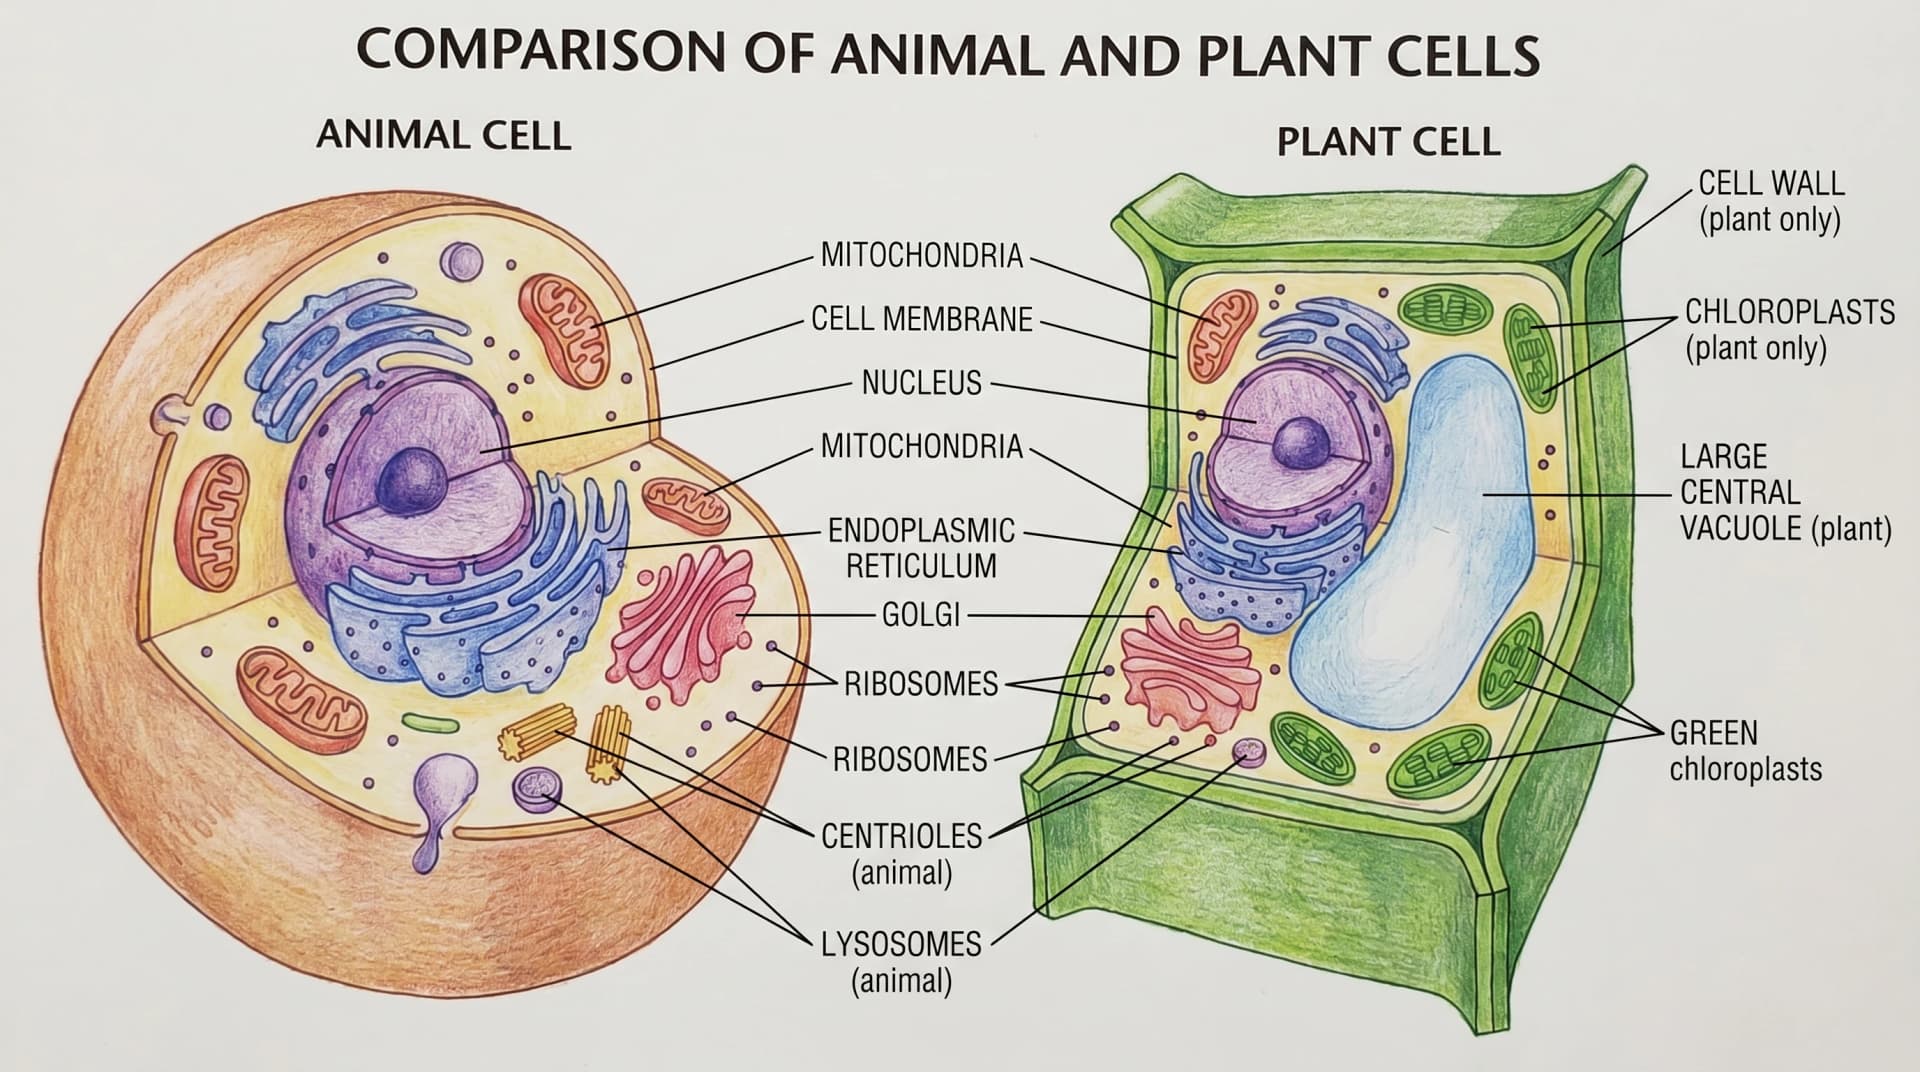
Researchers writing comparative figures often need plant cells or bacterial cells alongside the animal cell. The same prompt structure works, with adjusted organelle lists. Plant cells add cell wall, chloroplasts, and a large central vacuole; remove centrioles and most lysosomes. Bacterial cells are prokaryotic and structurally simpler — no nucleus, no membrane-bound organelles, but a circular DNA loop and ribosomes scattered throughout the cytoplasm.
For a paper that needs all three side-by-side (animal, plant, bacteria), generate each separately with consistent prompts (same style, same view, same background), then compose them in vector canvas or your preferred layout tool. The matched visual style is what makes the comparison readable. For the broader question of how to lay out figures across a manuscript, see How to Include Figures in a Research Paper.
Animal cell vs plant cell anatomical side-by-side comparison with labeled organelles, cell wall, chloroplasts (Figure generated with SciFig)
Animal cell diagrams establish baseline visual context for cell biology, developmental biology, pharmacology, and pathology arguments. They appear as introductory figures in graduate-level papers and as primary figures in textbooks. Modern AI generation reduces the production time from 3–4 hours of manual illustration to roughly 10 minutes of prompting and refinement.
The canonical eleven are: cell membrane, nucleus, nucleolus, mitochondria, rough endoplasmic reticulum, smooth endoplasmic reticulum, Golgi apparatus, ribosomes, lysosomes, cytoplasm, and centrioles. Every journal-quality animal cell diagram includes these eleven; reviewers commonly flag figures that omit any of them.
A typical generation cycle runs 2–4 minutes per pass, with most figures finalizing after 2–3 iterations. Total time from first prompt to publication-ready figure is 10–15 minutes, compared to 3–4 hours for manual illustration in Adobe Illustrator.
Yes, with explicit prompting. Plant cells require adding cell wall, chloroplasts, and large central vacuole; bacterial cells require removing the nucleus and membrane-bound organelles. Generate each cell type separately with matched style anchors and compose them in vector canvas for a clean comparison figure.
Most journals require vector format (SVG, EPS, or PDF with embedded vectors) for figures containing labels and sharp lines. SciFig generates raster output (PNG/WebP), which converts to journal-ready SVG through the vector-canvas tool in 1–2 minutes. Specific journal requirements are documented in How to Include Figures in a Research Paper.
Yes, with AI use disclosure in the Methods section. Most major journals (Nature, Cell, Science, eLife) accept AI-generated figures provided the use is disclosed and the author has reviewed for accuracy. The full policy landscape across 12+ journals is in Are AI-Generated Figures Allowed in Journals?.
Open the generated figure in vector canvas to access labels as a separate layer. You can reposition each label independently, change font size and color, add arrows or highlights, and remove labels that conflict with surrounding figure panels — all without regenerating the underlying cell illustration.
Recommended next
Related SciFig resources
Go deeper with the most relevant SciFig pages for this article.