
Scientific Figures for PowerPoint
A template for making scientific figures for PowerPoint — design publication-quality diagrams and export clean, high-resolution visuals ready to drop into your slides.
Updated

Start with up to 150 free credits|No credit card required
Get up to 350 free credits on day one when you join through an invite.
What is Scientific Figures for PowerPoint?
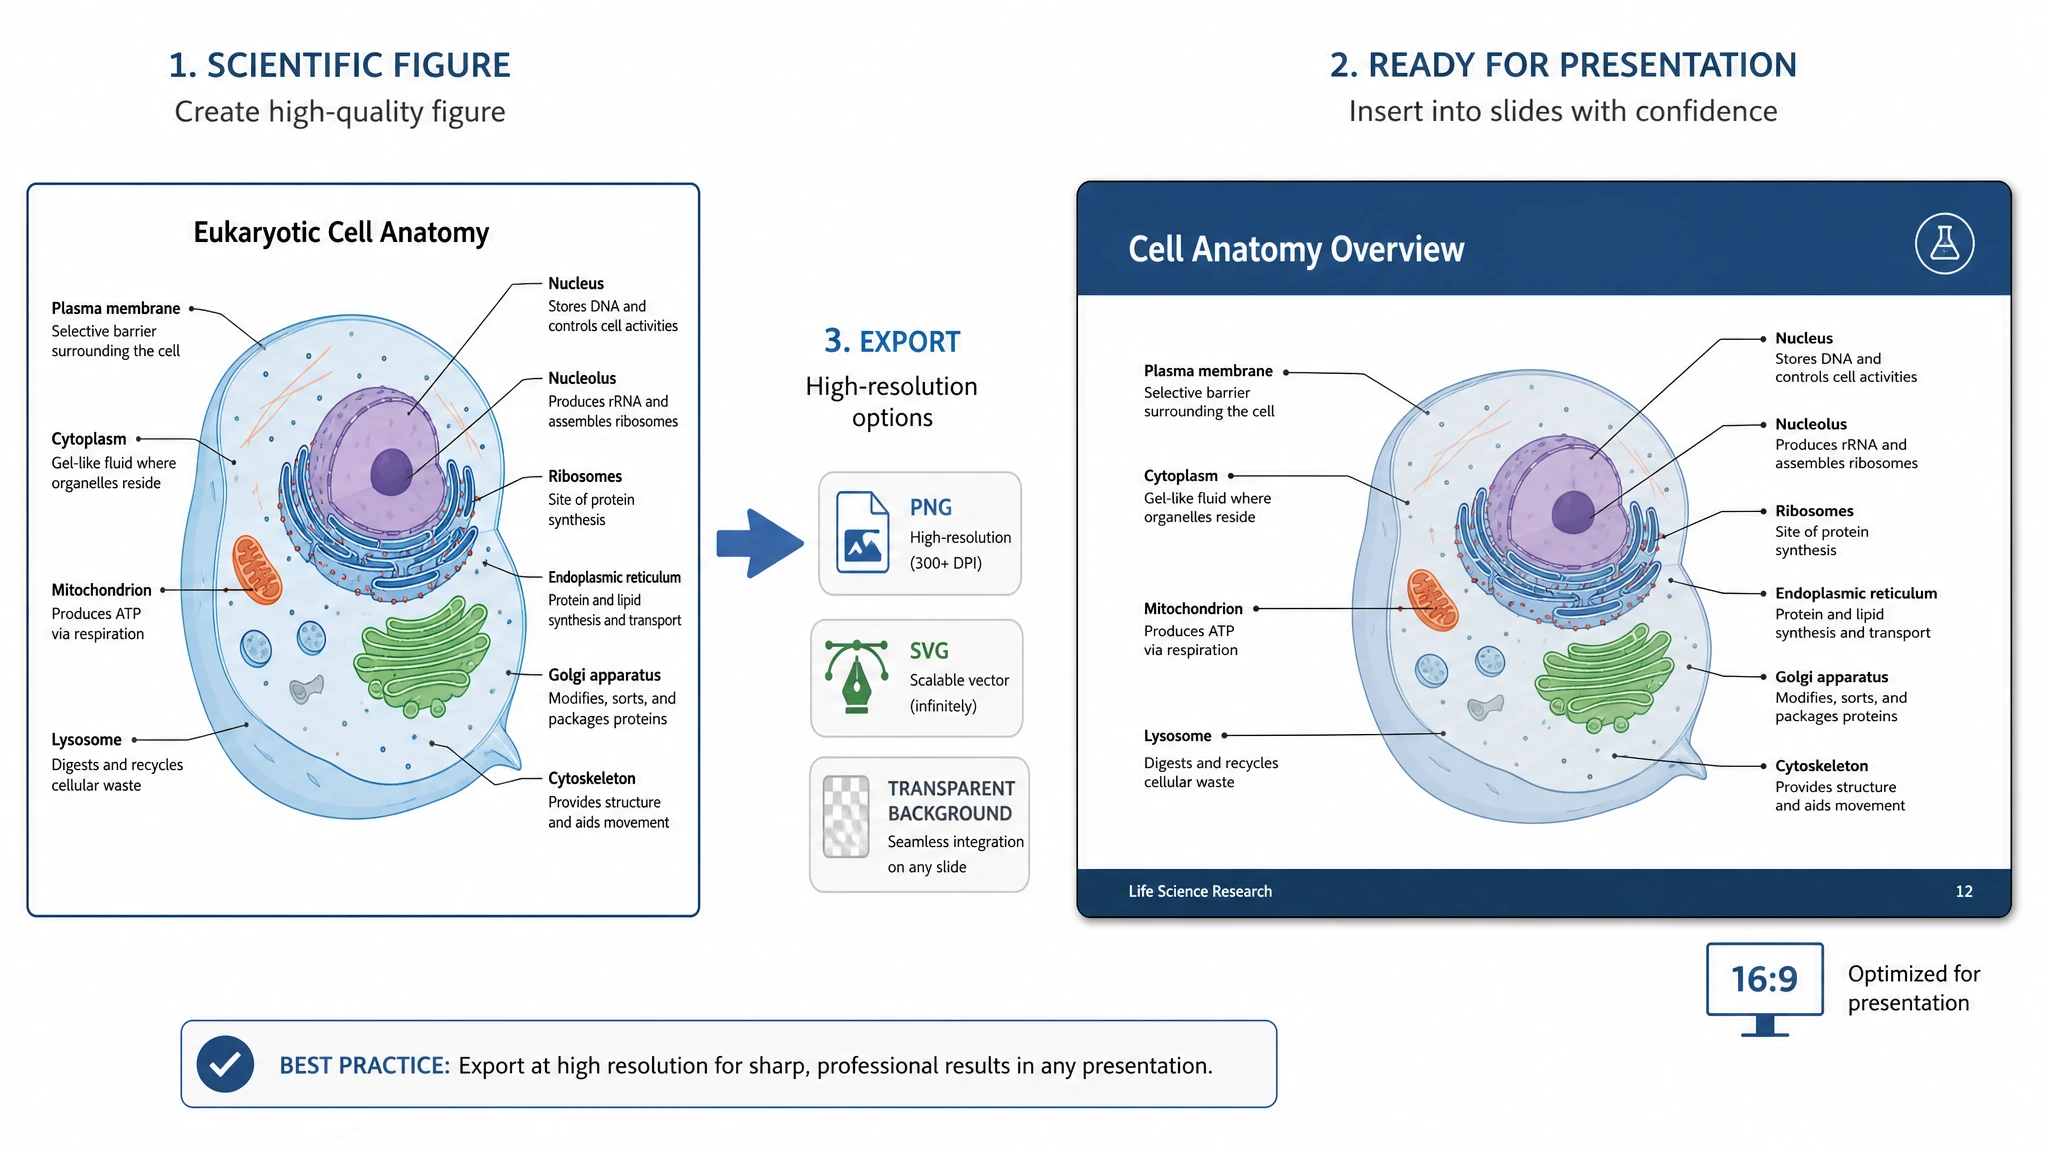
Scientific figures for PowerPoint are publication-quality diagrams designed to be exported and placed into PPTX slides for talks, lectures, and presentations. A good slide figure uses clean labels, high contrast, and a high-resolution export (PNG or SVG) so it stays sharp when projected on a transparent or white background that suits any slide. With SciFig you describe the figure you need, generate an editable diagram, and export a high-resolution image ready to drop straight into PowerPoint.
Why Slide Figures Need Their Own Treatment
- A journal figure is read at arm's length on paper; a slide is read at ten meters, under bad light, for maybe twenty seconds — the same artwork rarely serves both.
- The 16:9 canvas is wide and short, so a tall multi-panel journal figure has to be re-laid-out, not merely shrunk.
- Screenshotting a paper figure into a deck is the default habit, and it is exactly what produces the blurry, unreadable panels everyone has sat through.
- Text baked into a bitmap cannot be fixed during the last-minute rehearsal when a collaborator spots a wrong unit.
- Projector gamut and contrast differ substantially from a calibrated monitor, so palettes that pass on screen can collapse in the room.
- Talks get reused: the same panel is expected to survive being moved into a lecture, a lab meeting, and a grant presentation.
What a Slide-Ready Figure Needs
- Vector rather than raster geometry — resolution-independent shapes that stay sharp when the projector rescales the slide.
- An editable text layer — labels as text runs, not pixels, so typos, units, and translations can be fixed inside the deck.
- A type-size floor — nothing below 8 pt at final rendered size; body labels around 16–18 pt on a standard slide.
- Line weights above roughly 0.75 pt, since hairlines vanish under projection and video compression.
- A color-blind-safe palette (Okabe–Ito, viridis) with redundant encoding by shape, pattern, or direct labeling.
- A 16:9 layout with generous margins, sized for the slide it will live on rather than cropped from a portrait journal panel.
- Export as an editable PPTX — shapes and text land as native objects, not a pasted screenshot; keep a 300 dpi PNG only as a fallback.
Where These Figures Are Used
- Conference talks and short-form oral presentations, where a panel has to land in seconds.
- Lab meetings and journal clubs, where figures are annotated live and often edited mid-discussion.
- Undergraduate and graduate lectures, where the same diagram is reused across years and must remain editable.
- Thesis and qualifying-exam defenses, where slide figures are expected to match the manuscript versions.
- Grant and progress-review presentations to non-specialist panels who read the figure, not the caption.
- Departmental seminars and public-outreach decks projected in rooms with poor lighting and uncertain contrast.
What Makes a Figure Slide-Ready
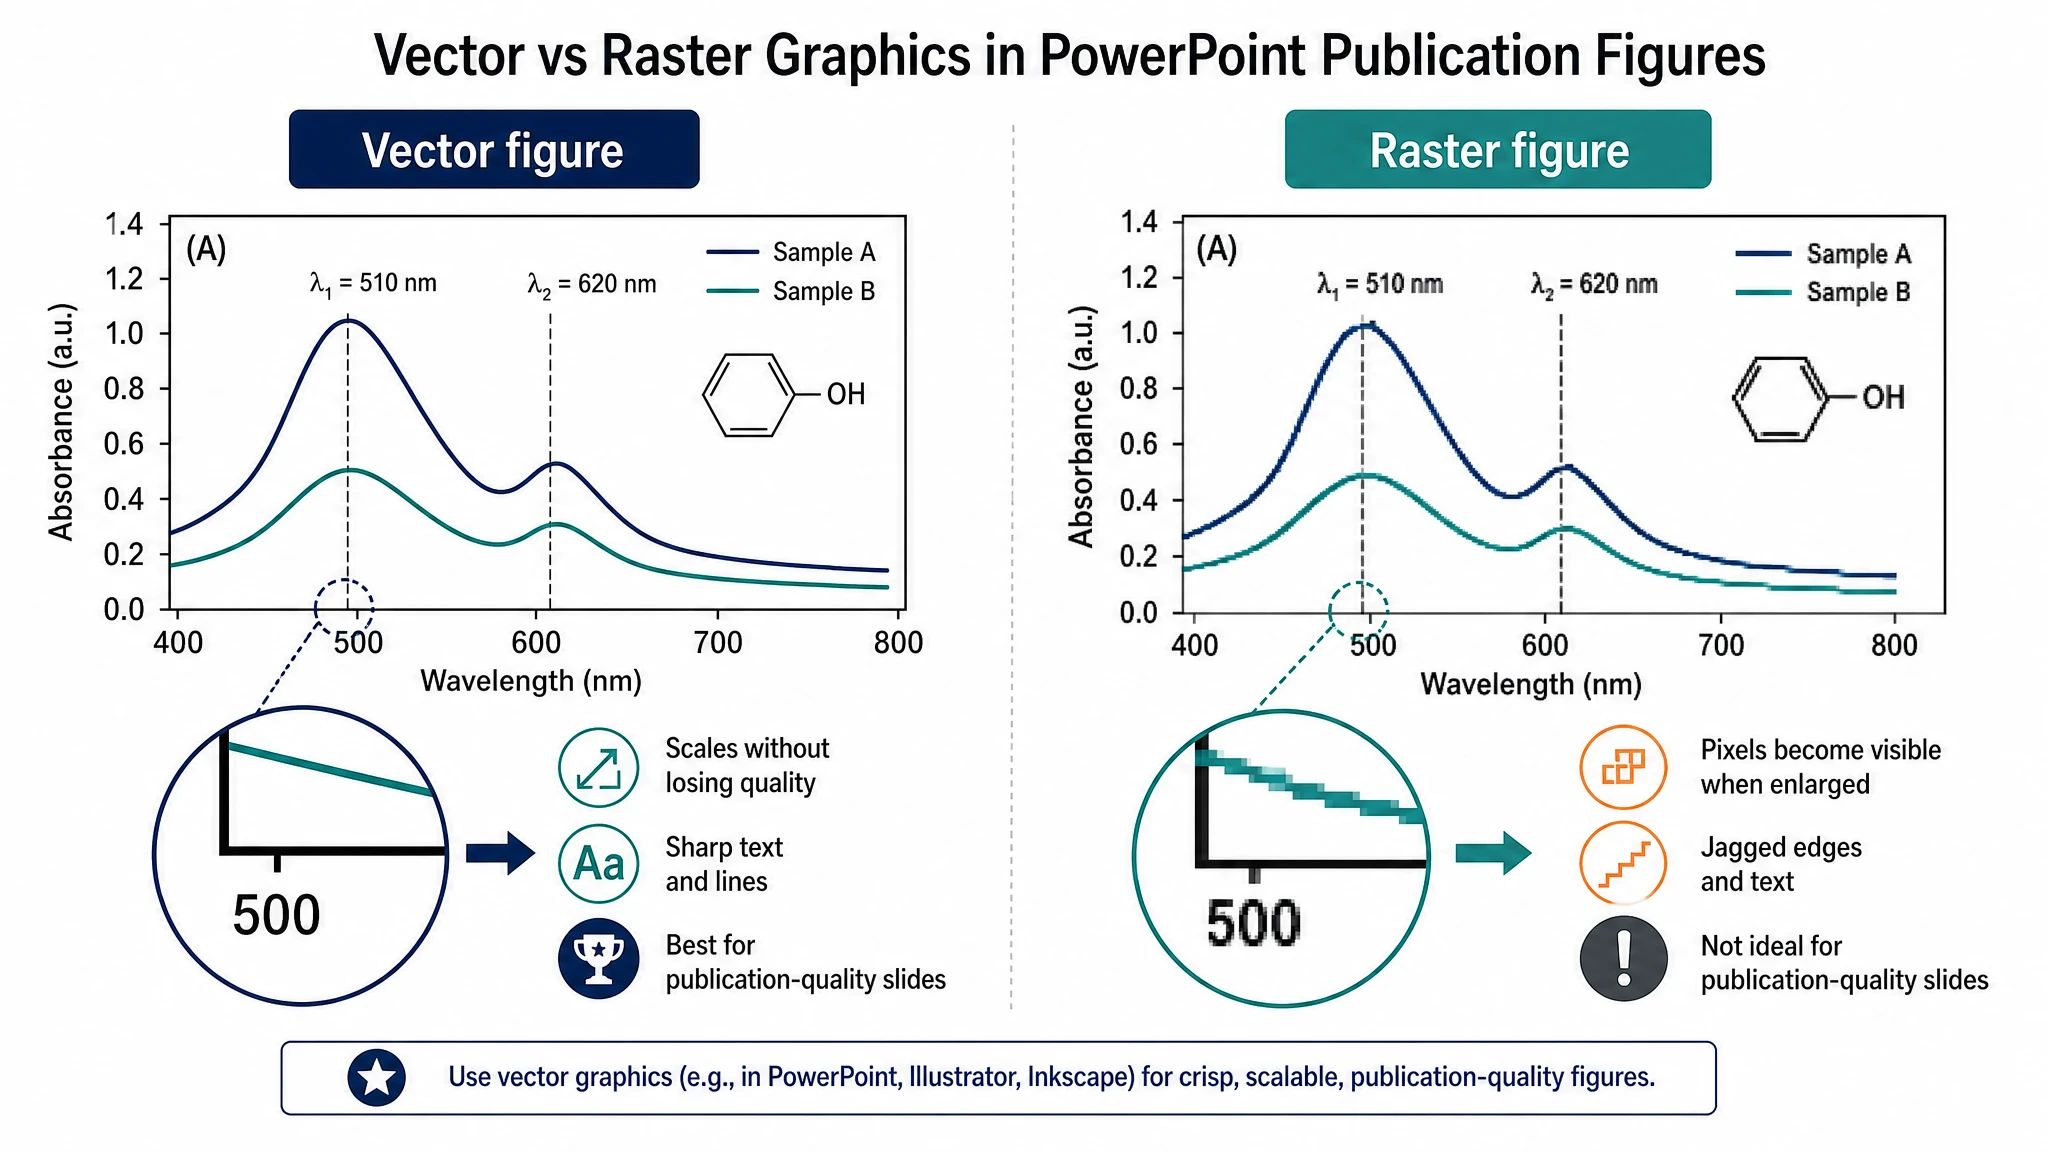
Vector Geometry Survives Projection; Bitmaps Do Not
A slide is 1920 × 1080 px at best, and a projector may resample it. A raster image placed at half the slide width needs roughly 960 px of real detail merely to hit 1:1 — enlarge it beyond that and edges soften. Vector geometry (SVG, EMF, or native shapes) re-renders at any zoom and stays crisp. If raster is unavoidable, export at 300 dpi or more for the final placed size.
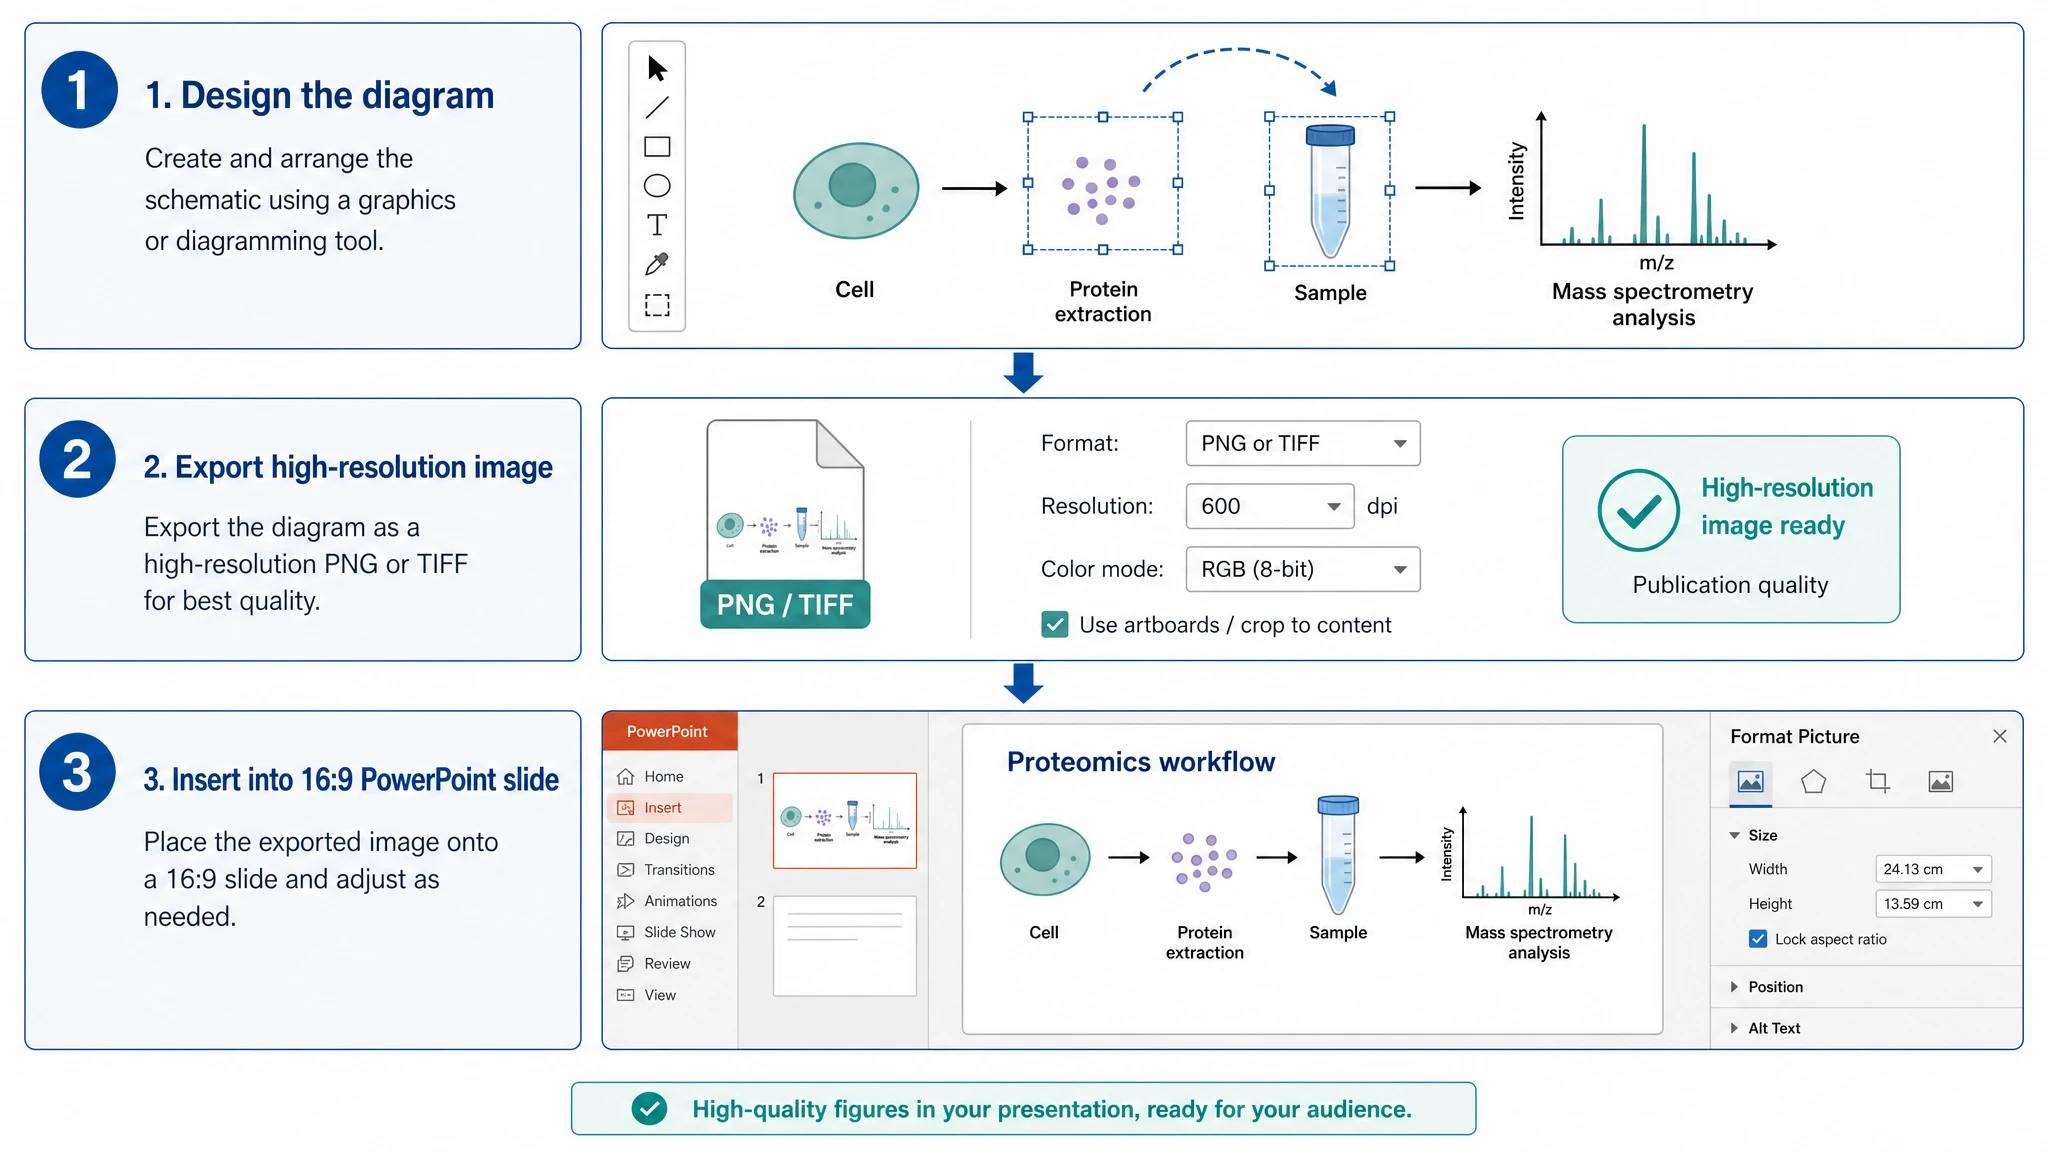
Keep Labels as Text, Not Baked Into Pixels
Export to an editable PPTX rather than pasting a flattened picture. Labels that arrive as real text runs can be corrected, translated, restyled into the deck's theme font, and read by accessibility tools. With a pasted bitmap, a single typo means going back to the source tool and re-exporting the whole figure — the reason most talks ship with a mislabelled axis nobody wanted to fix at midnight.

Type Size Floor and Line Weight for the Back Row
Treat 8 pt as the hard floor at final rendered size — below that, projection and video compression destroy legibility. In practice, keep body labels near 16–18 pt on a 13.3 × 7.5 in slide and axis ticks no smaller than 12–14 pt. Strokes below about 0.75 pt disappear on a projector; anti-aliasing eats hairlines entirely. Enlarge type after import rather than scaling the whole figure down.
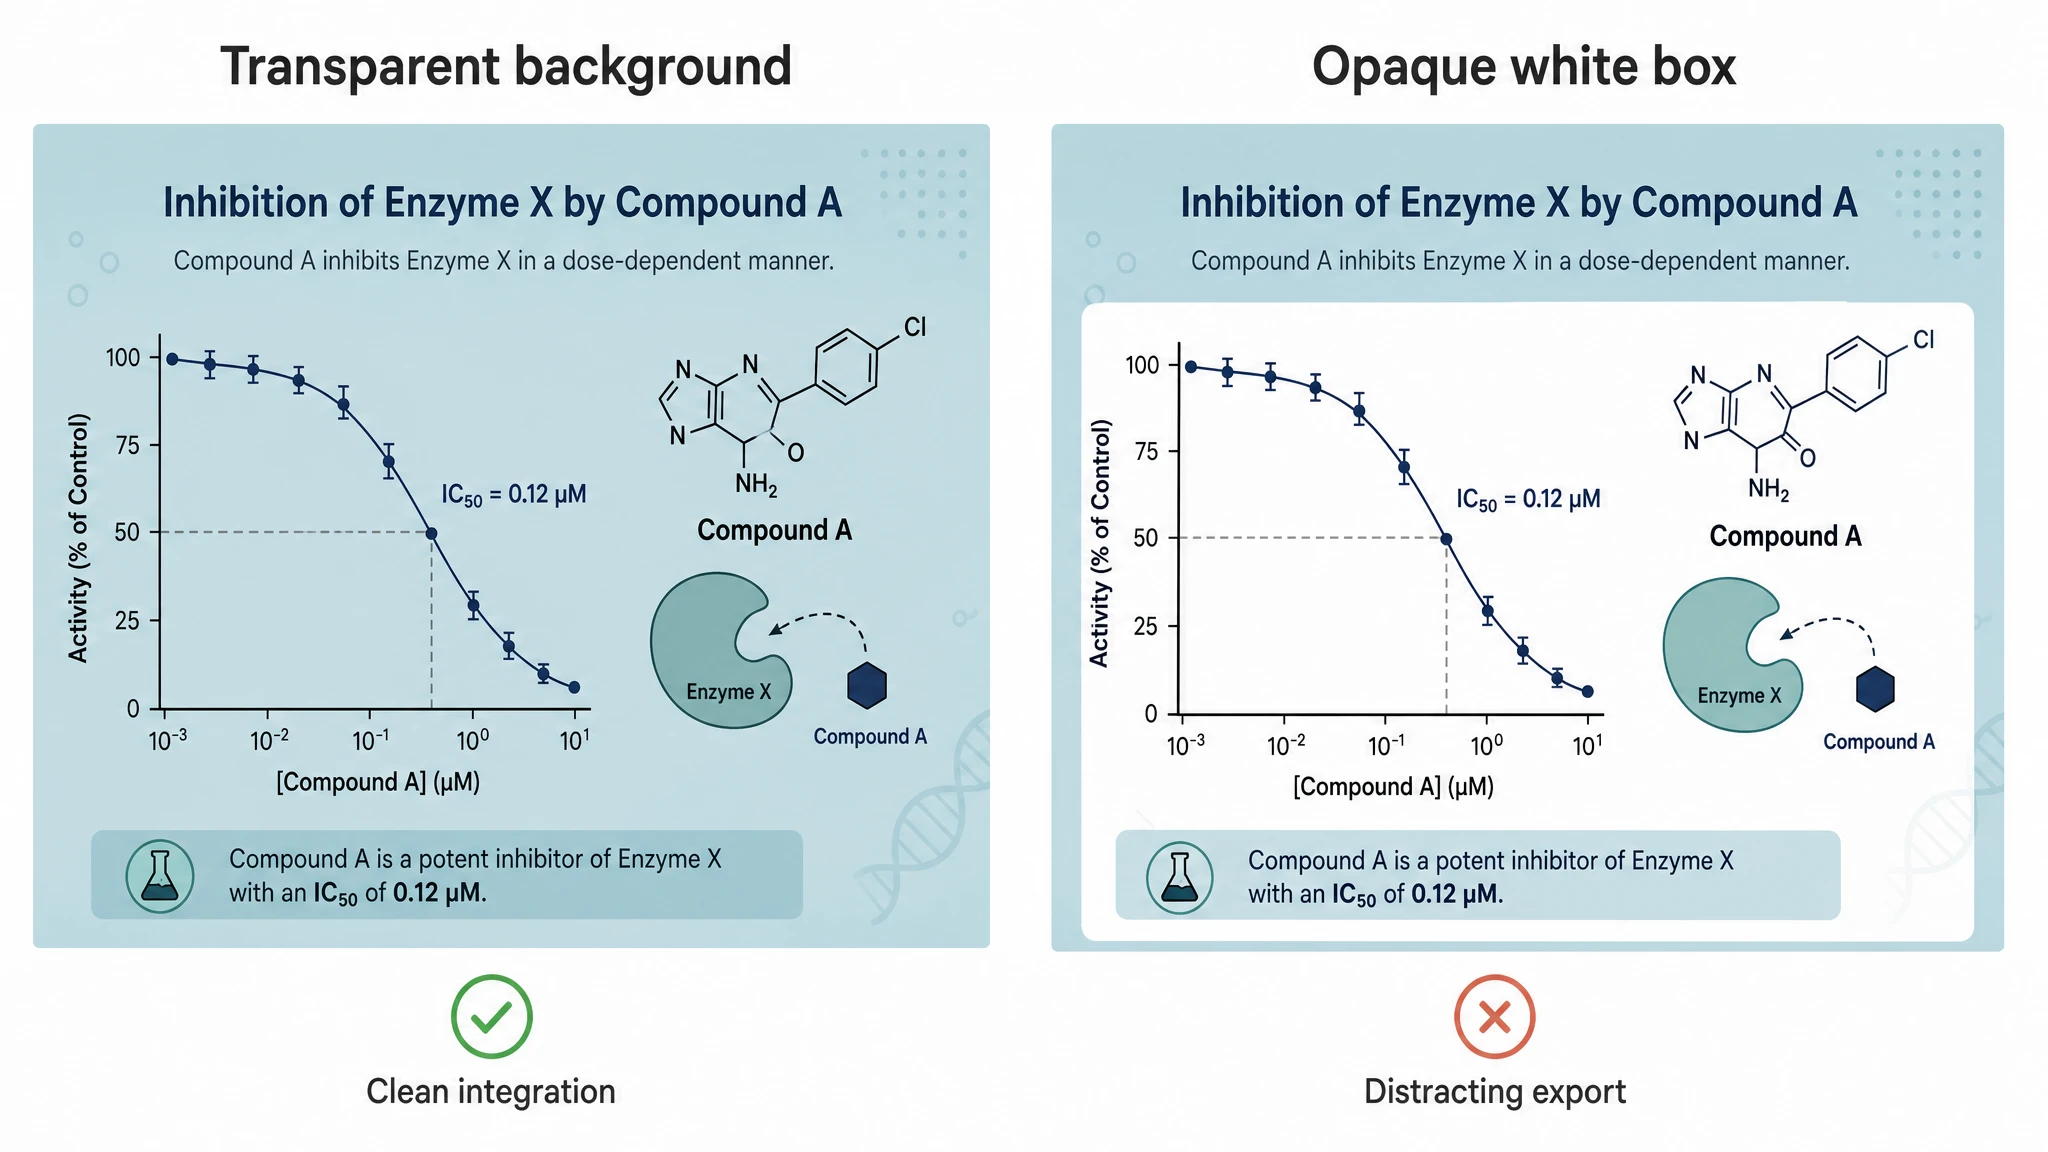
Color-Blind-Safe Encoding and a Deliberate Background
Roughly 8% of men have a red–green deficiency, and conference projectors distort hue and contrast further. Use the Okabe–Ito or viridis palettes, encode categories redundantly with shape, pattern, or direct labels, and hold text contrast at 4.5:1 or better. Decide the background explicitly: a transparent PNG suits a dark theme but can leave pale halos on anti-aliased edges, so check the composite before the talk.
Scientific Figures for PowerPoint— templates & examples
How to make Scientific Figures for PowerPoint
Describe your figure
Tell SciFig what to draw in plain language — no design tools required.
Generate with SciFig
Get a clean, publication-ready figure that matches your description in seconds.
Edit & export
Vectorize it into editable SVG, relabel everything, and export for your paper, poster, or slides.
Related searches
- scientific figures for powerpoint
- how to make scientific figures in powerpoint
- export figures for pptx
- high resolution figures for slides
- scientific diagram for presentation
- publication quality figure powerpoint
- export png for slides
- figures for conference slides
- make diagrams for powerpoint
- scientific illustration for slides
Make figures for
Related pages
Tutorials Templates
Browse more Tutorials templates in SciFig's library.
All Templates
Browse every template page in SciFig's library.
Graphical Abstract Maker
Summarize your study in one panel
Scientific Poster Generator
Design a conference research poster
AI Scientific Image Generator
Generate research figures from text
Conceptual Framework Generator
Map variables and their relationships
Frequently Asked Questions
Common questions about Scientific Figures for PowerPoint.

Ready to publish?
Make your own Scientific Figures for PowerPoint in minutes.
Start for freeFree to start · No credit card required · Built for researchers