
PRISMA Flow Diagram for Systematic Reviews
The standard, publication-ready figure for reporting how studies were identified, screened, and included in a systematic review or meta-analysis.
Updated

Start with up to 150 free credits|No credit card required
Get up to 350 free credits on day one when you join through an invite.
What is PRISMA Flow Diagram for Systematic Reviews?
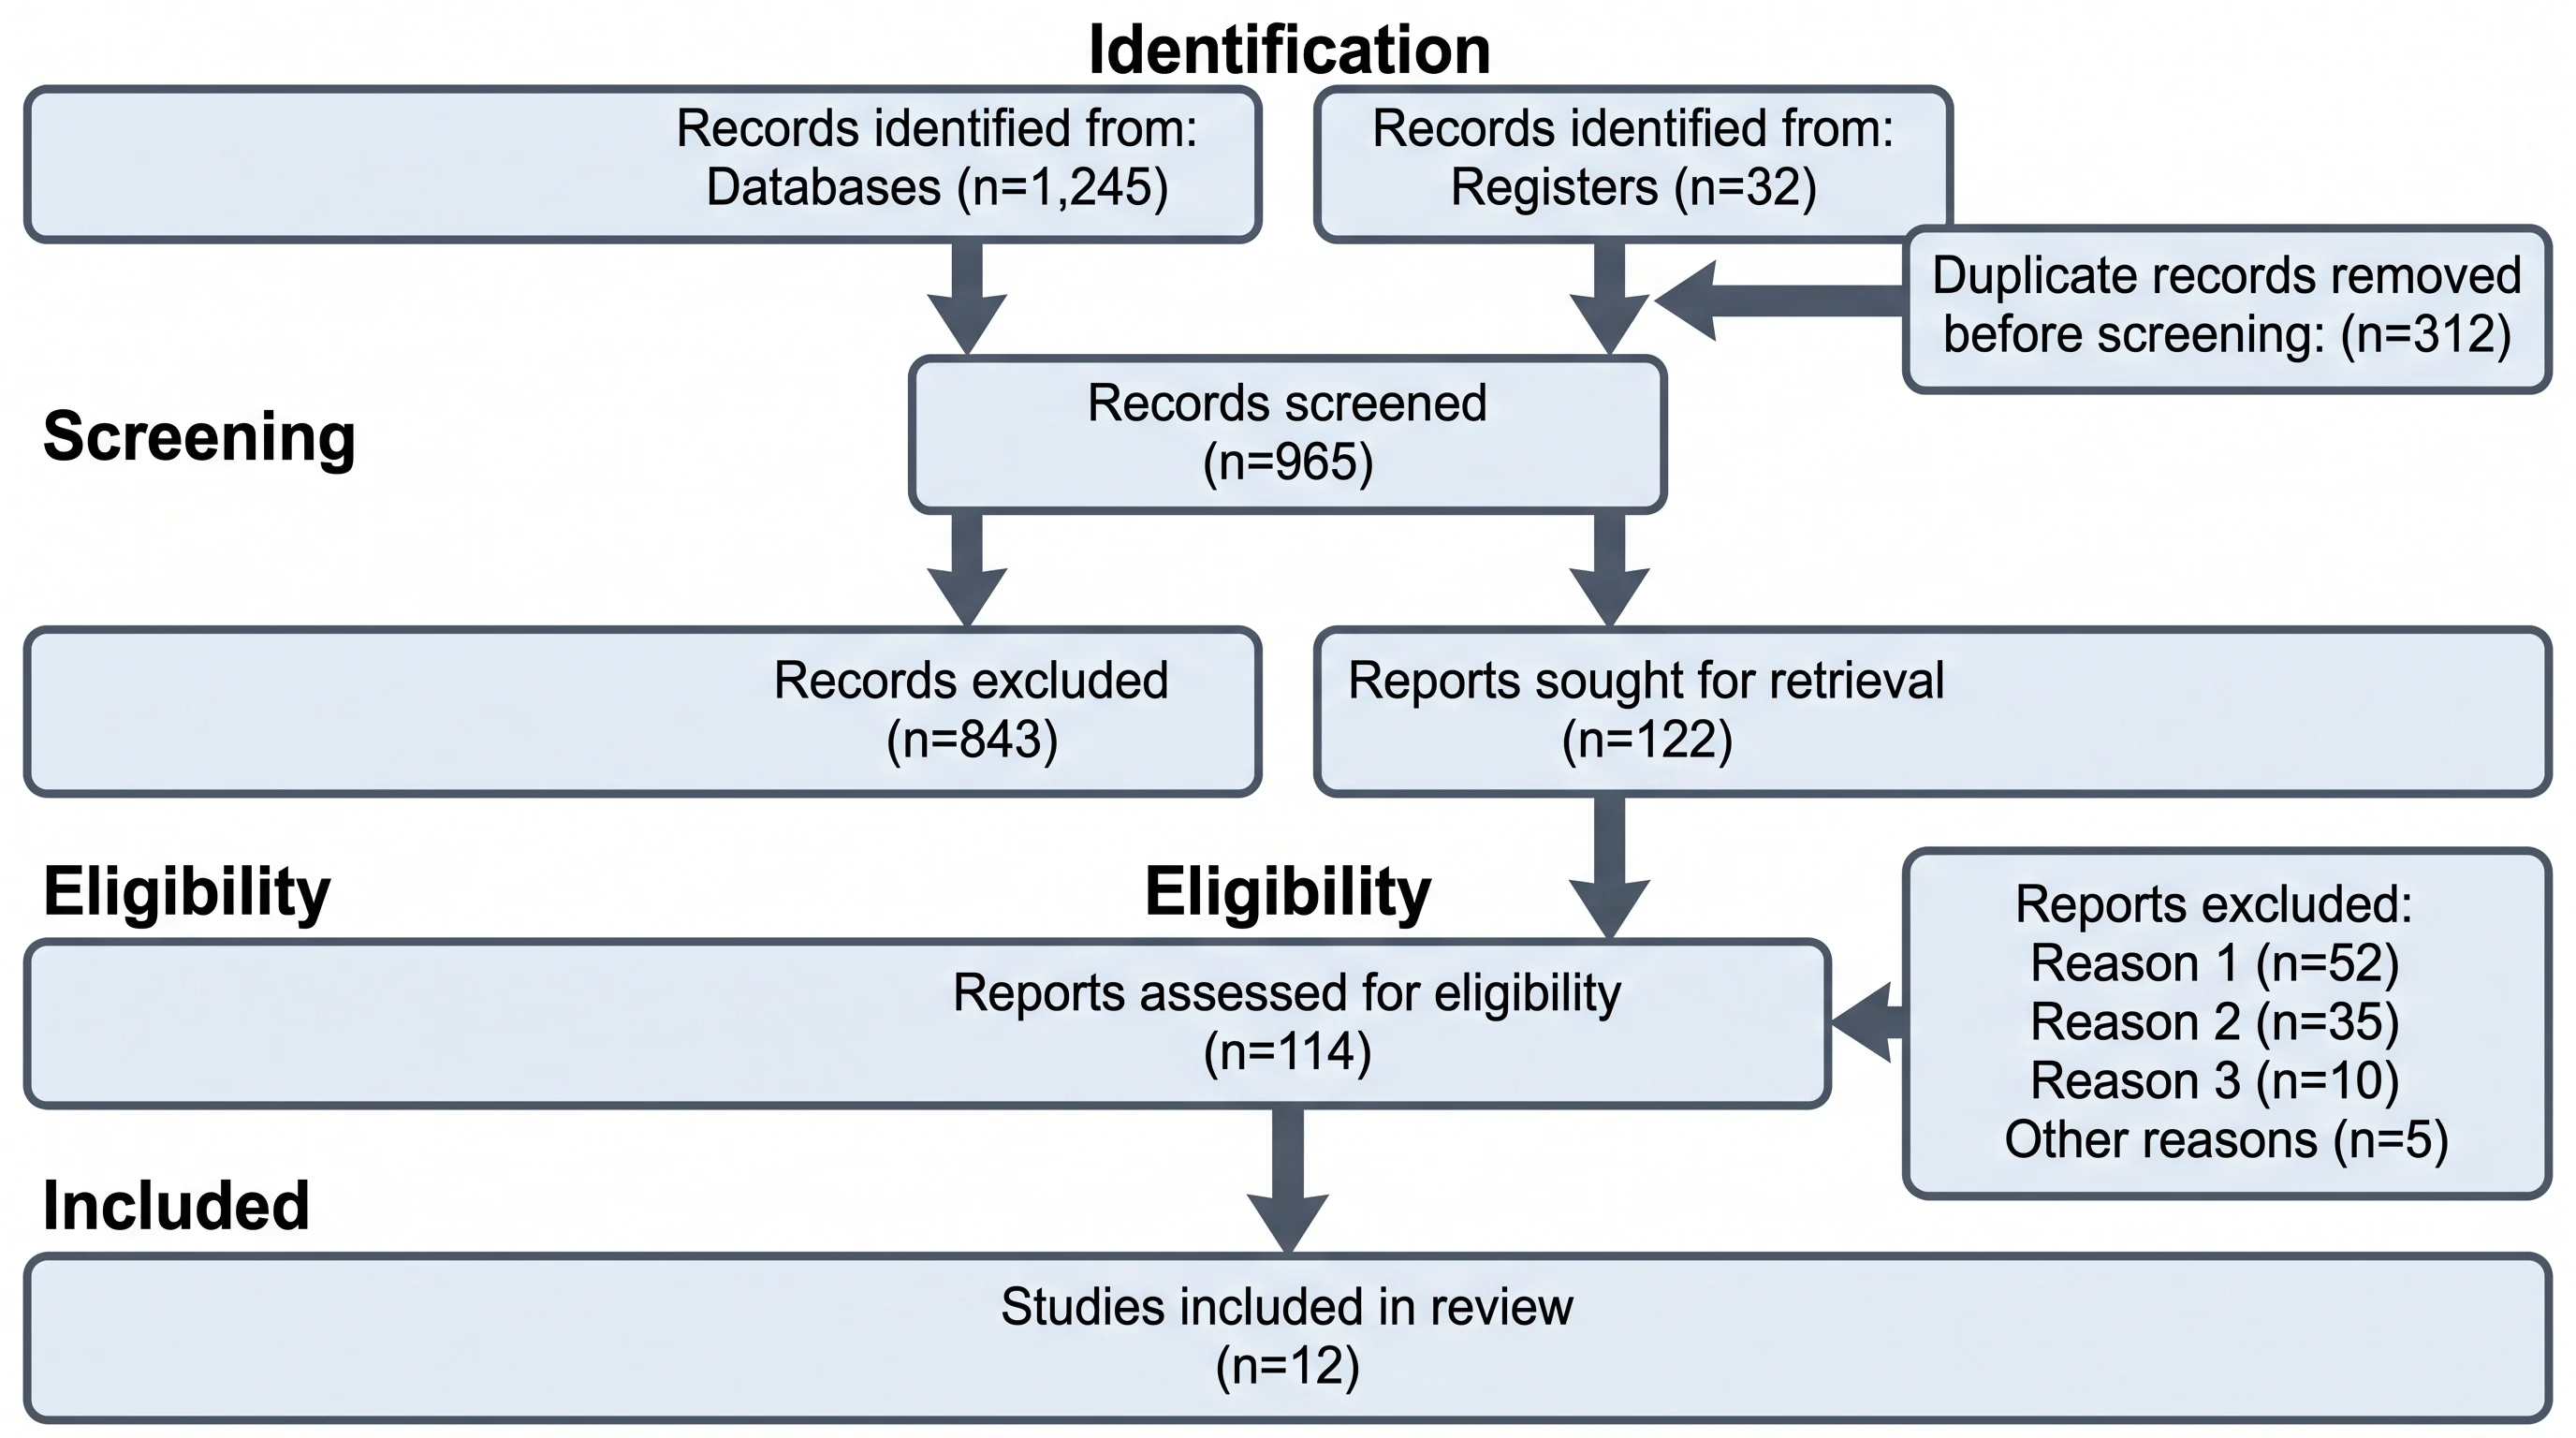
A PRISMA flow diagram is the standard figure for reporting how studies were identified, screened, and included in a systematic review. It maps the four PRISMA phases — identification, screening, eligibility, and included — and records the number of records found, duplicates removed, reports excluded, and the reasons for exclusion. With SciFig you describe your review in plain language and generate a clean, publication-ready PRISMA flow chart you can relabel and export.
Why reviewers expect a complete record-flow figure
- The counts are the audit trail: a reader who cannot reconcile n at each stage cannot trust the evidence base behind your conclusions.
- PRISMA 2020 items 16a and 16b, and most journal submission systems, ask for the figure explicitly; editors routinely return manuscripts that omit it.
- It exposes attrition. A review that screened 4,000 titles and included six studies invites a different reading than one that screened 200 — and that is information the reader is entitled to.
- Protocol deviations become visible. Numbers that disagree with your PROSPERO registration are far easier to explain in a caption than to defend during peer review.
- Handover: when a screener leaves mid-project, the figure plus the exclusion log tells the next person exactly where the review stands.
- Updates are cheap. When the search is re-run before resubmission, only the counts change, not the structure.
Boxes and counts to label
- Identification — records retrieved from each database and register, reported per source (MEDLINE, Embase, CENTRAL, Web of Science) with the search date
- Duplicates removed before screening — separated into those removed by the reference manager or automation tool and those removed manually
- Records screened on title and abstract, with a single total for records excluded at this stage
- Reports sought for retrieval, and reports not retrieved — full texts that could not be obtained, including unanswered author requests
- Reports assessed for eligibility, with excluded reports itemised by reason and count
- Studies included in the review, and the number of reports per study — a study with three publications is still one study
- The second identification stream — citation searching, gray literature, registries, and organisation websites, screened in its own column
Where researchers use this figure
- The Methods section of a systematic review or meta-analysis, almost always as Figure 1
- A PROSPERO protocol or registered report, where the empty template documents the planned process before screening starts
- Scoping and rapid reviews, which reuse the structure with adapted stage labels (PRISMA-ScR)
- Grant applications that must show the evidence base was assembled systematically rather than selectively
- Thesis chapters and viva slides, where examiners probe the exclusion counts first
- Evidence-synthesis teaching and journal clubs, where the figure is read backwards to critique a published review
Everything you need in a publication-ready PRISMA flow diagram
Show every record from search to inclusion
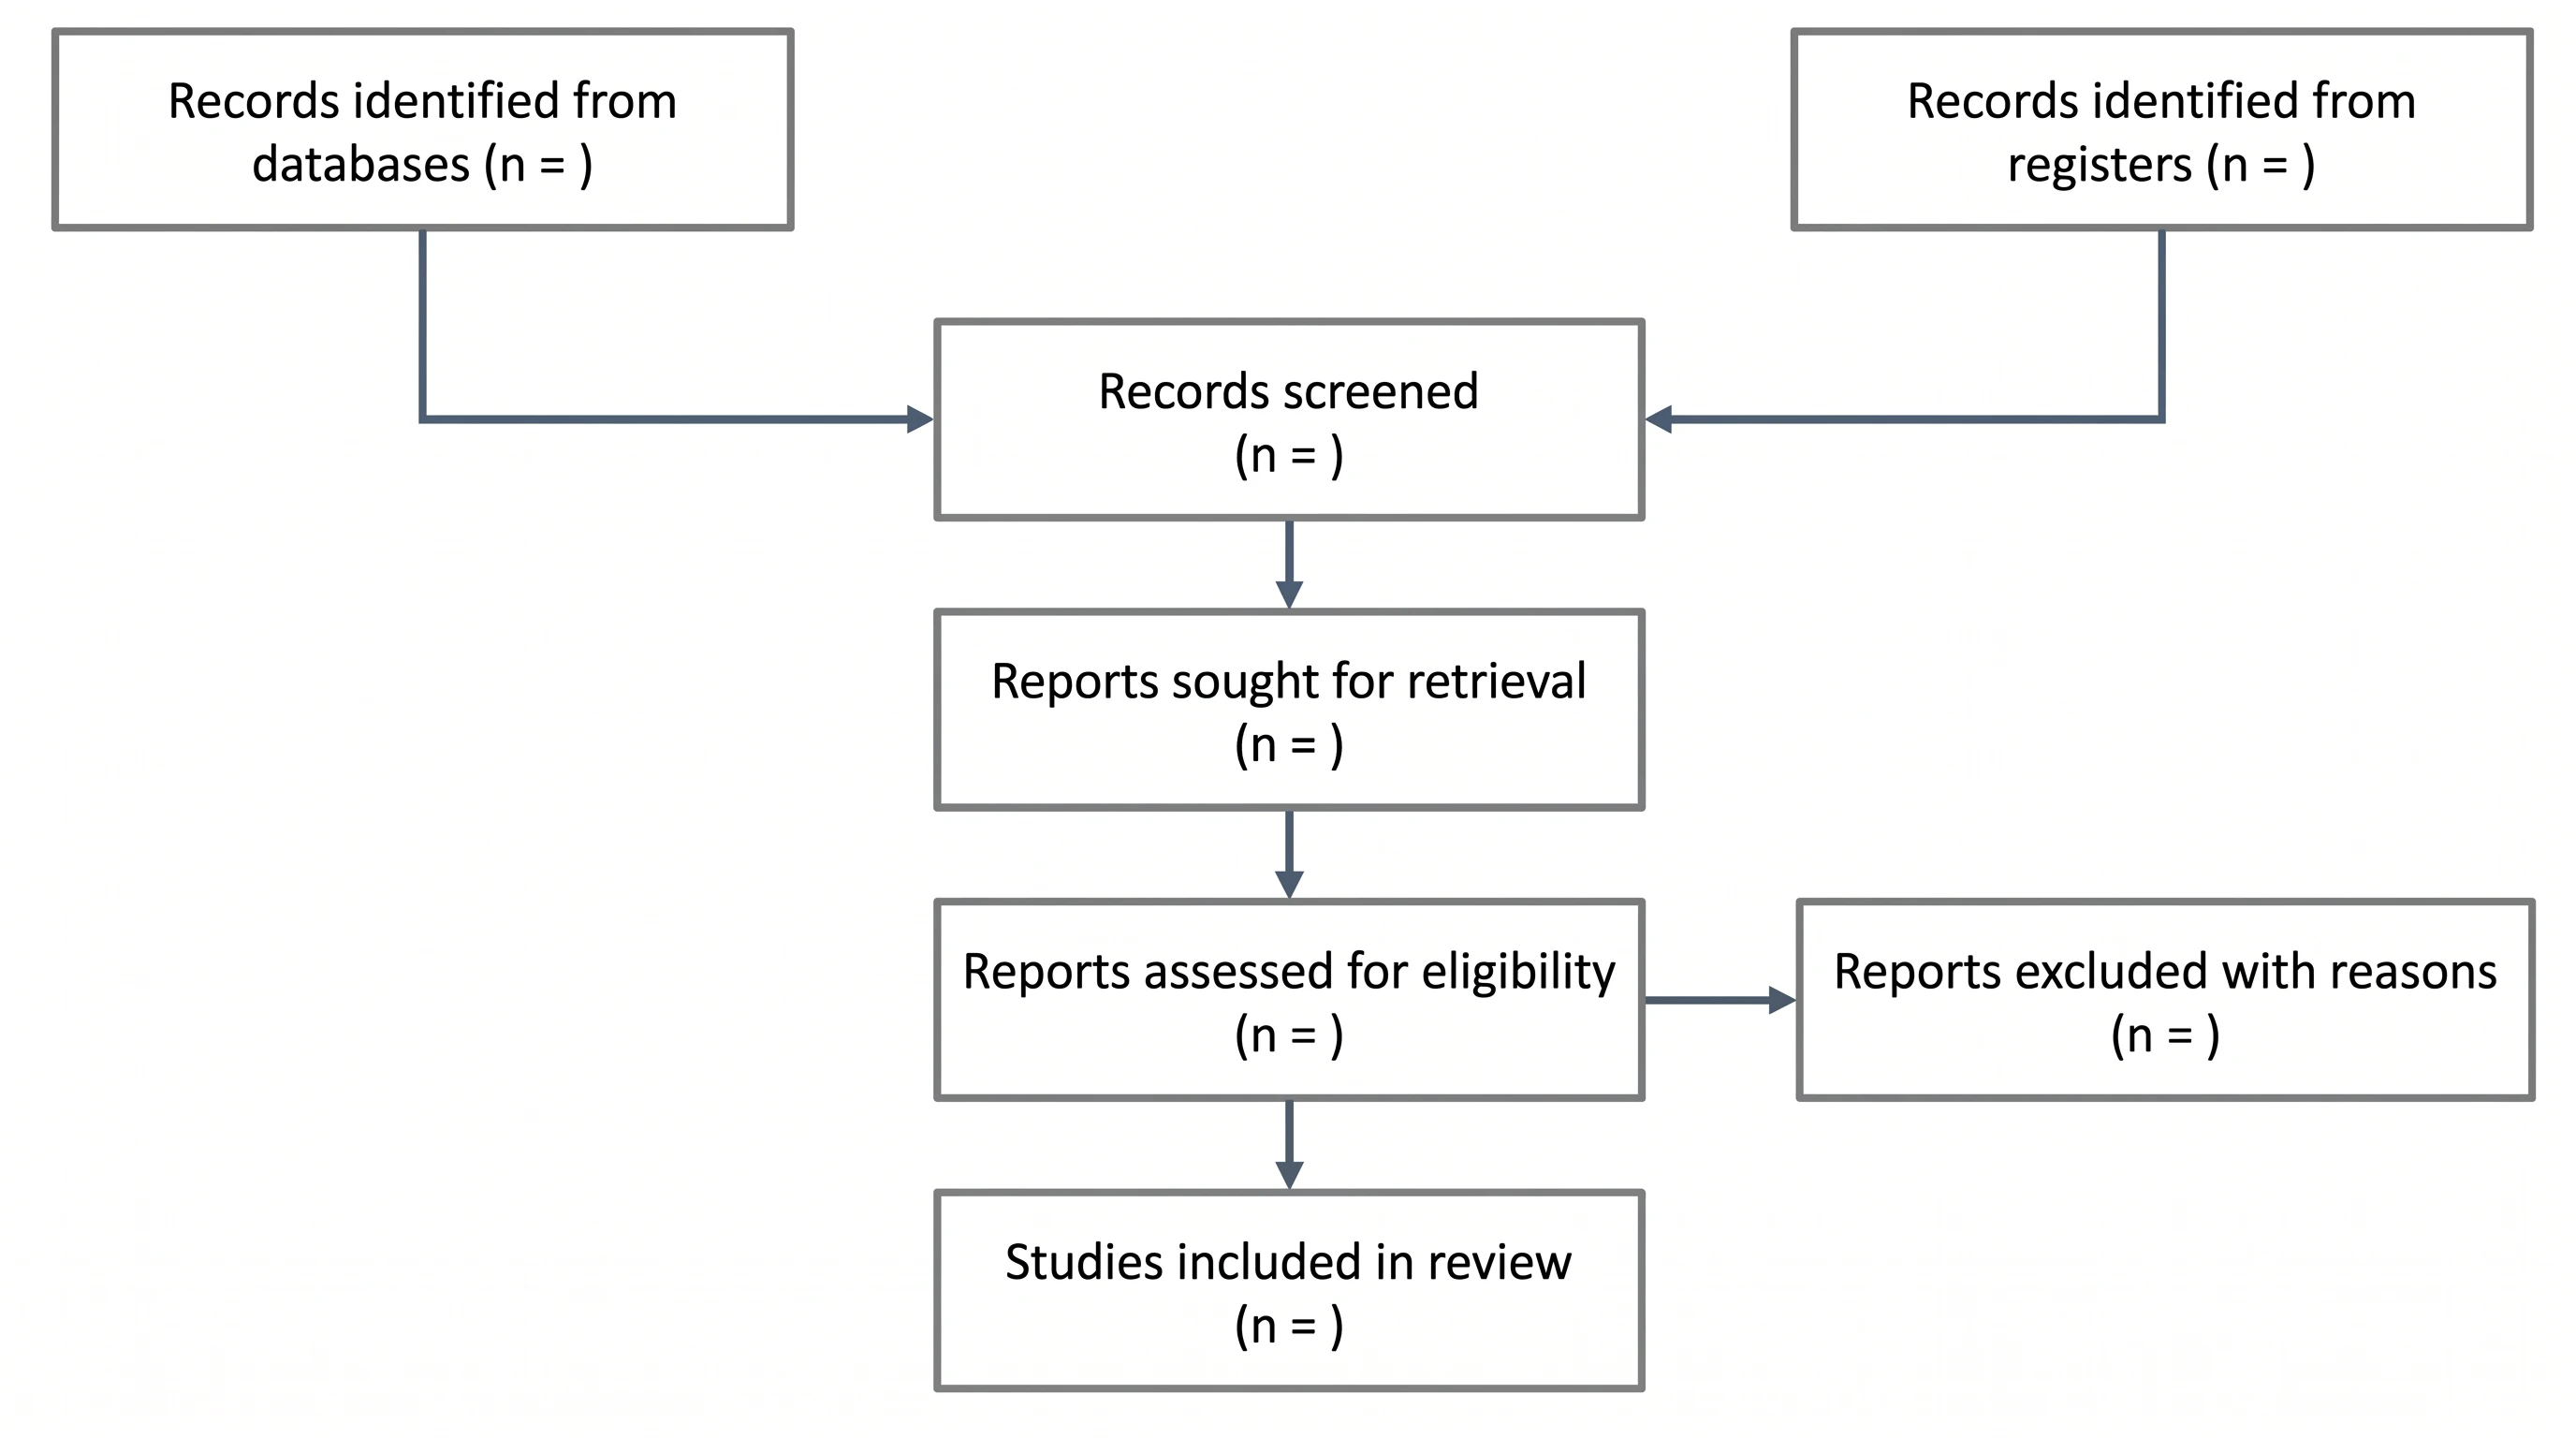
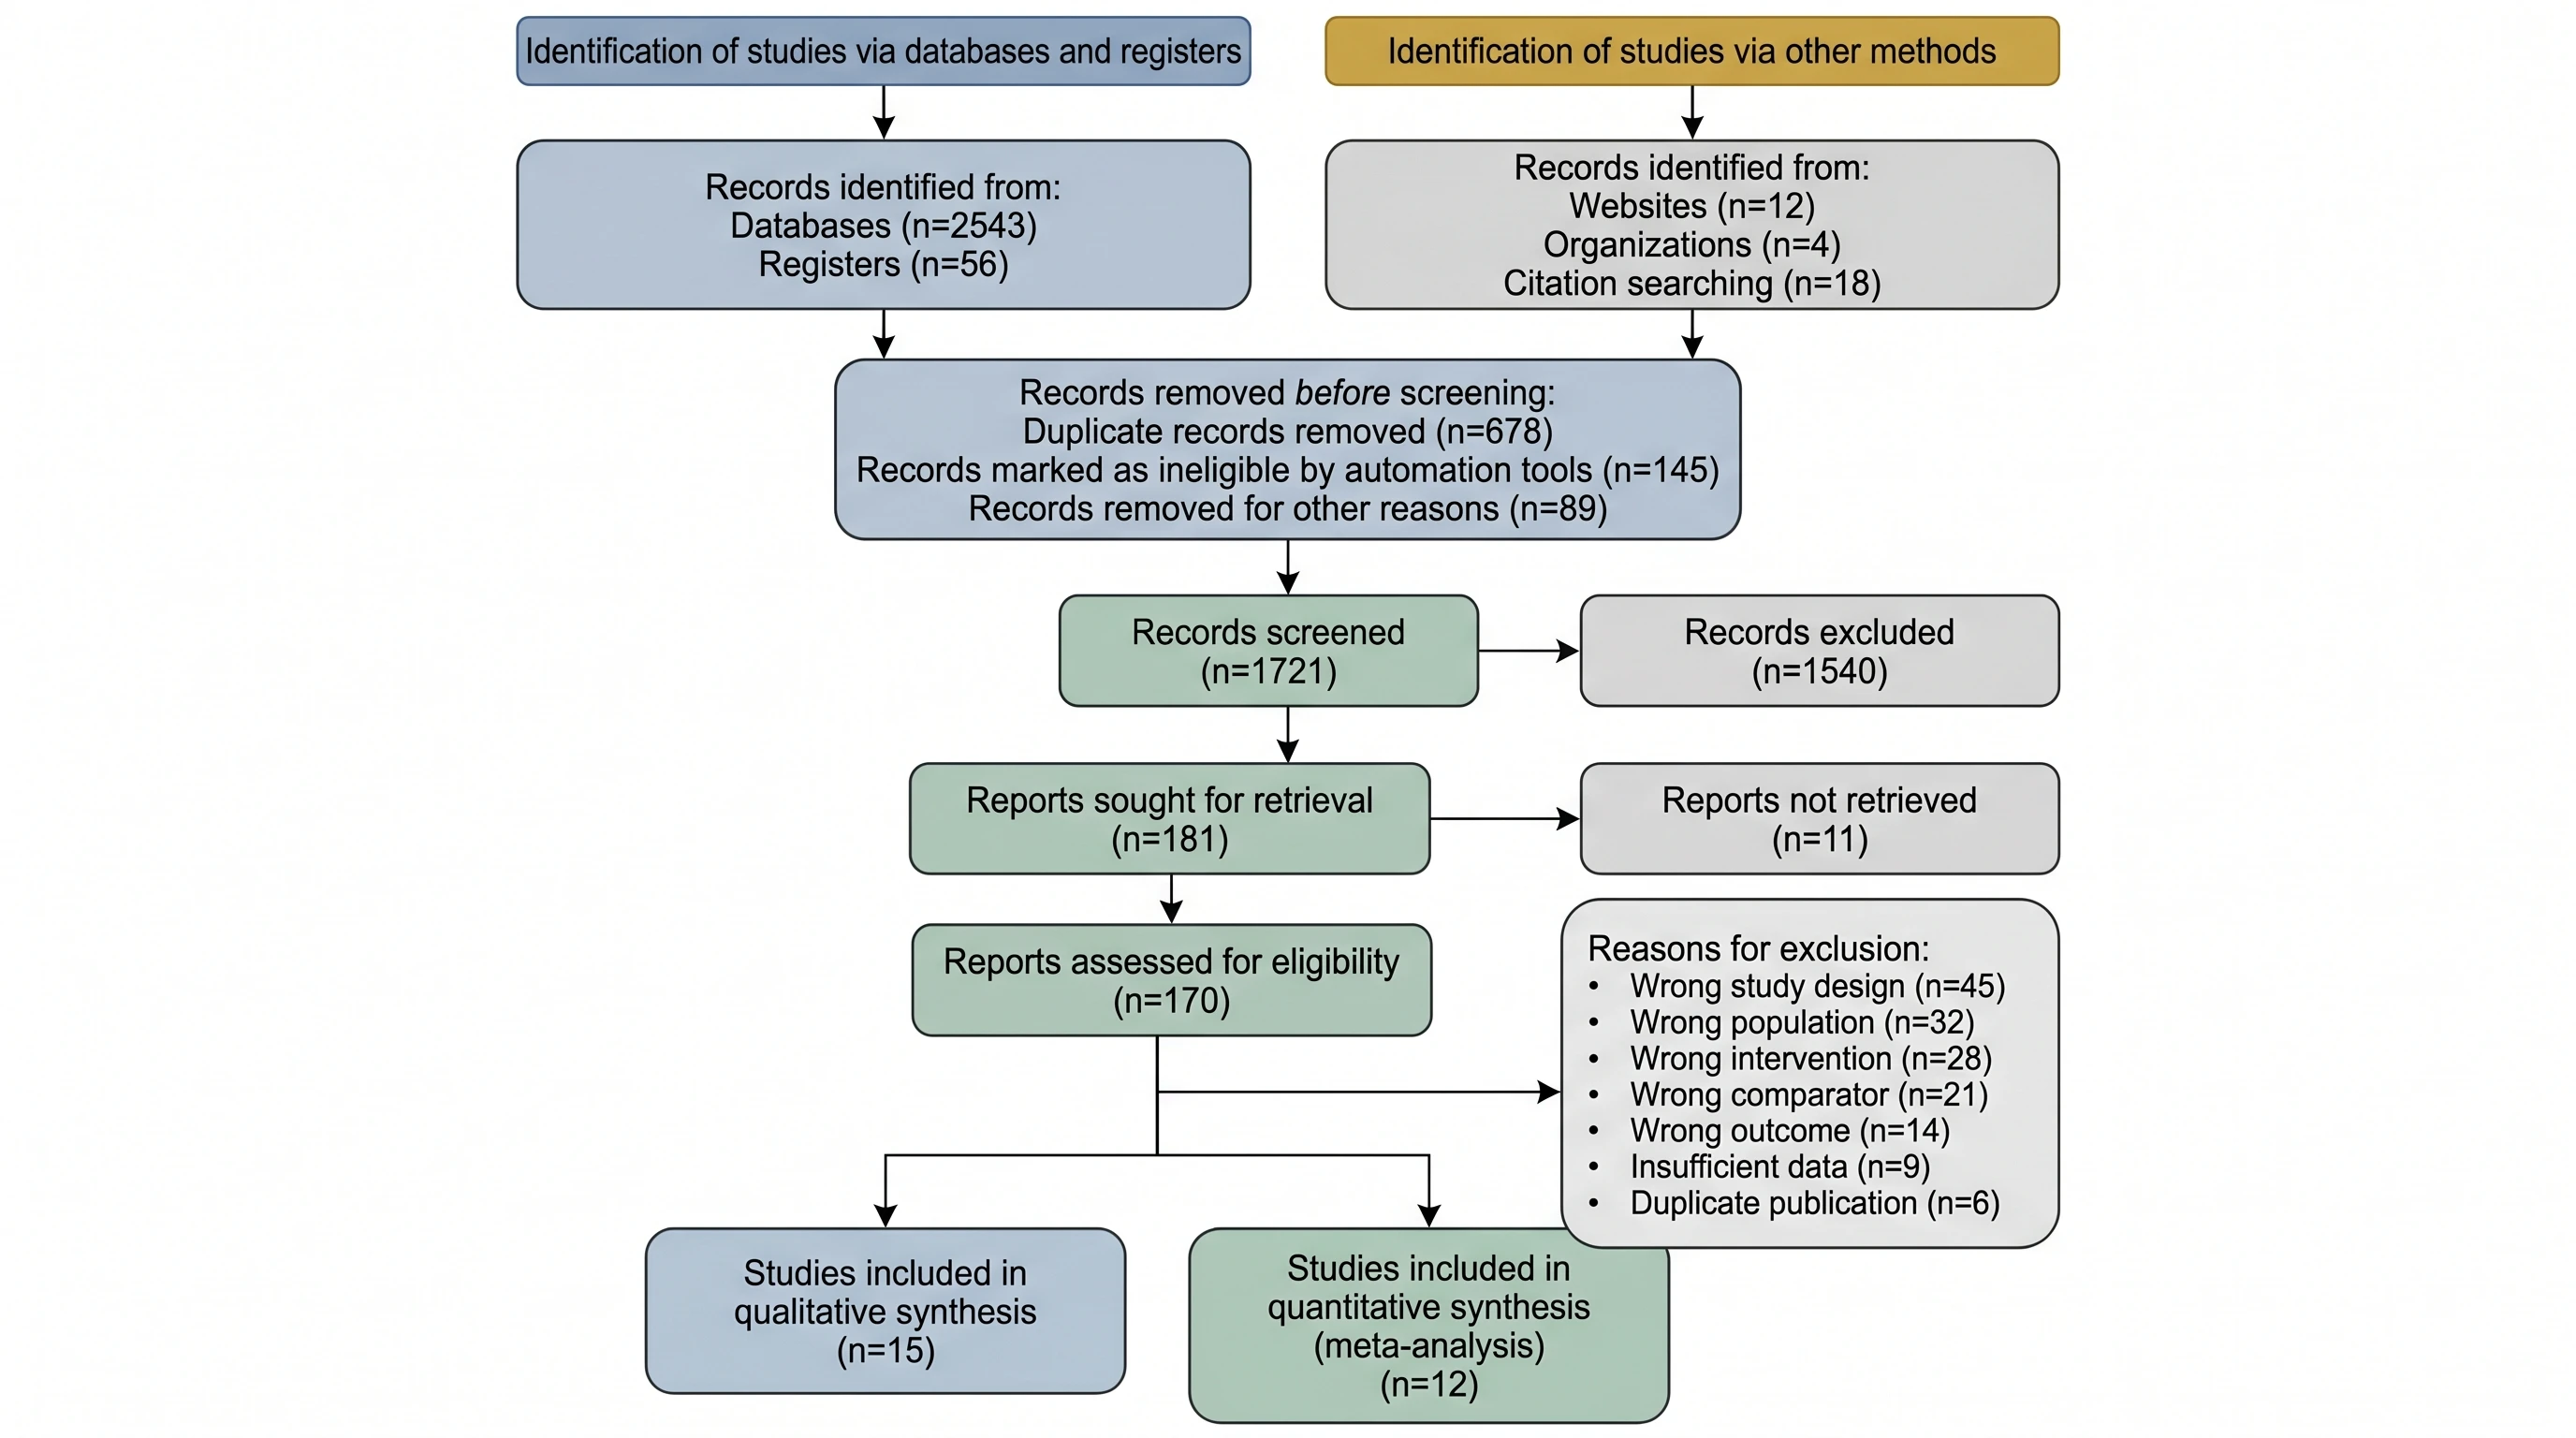
The figure carries the counts that let a reader reconstruct your review: records retrieved per database and register, duplicates removed before screening, titles and abstracts screened, reports sought for retrieval, full texts assessed, and studies finally included. Each box is a plain n=, and the arithmetic has to reconcile down the column. Describe your numbers once and the layout, arrows, and boxes are assembled for you. Build your own diagram with the PRISMA flow diagram generator.
Handle the 2020 two-column layout correctly
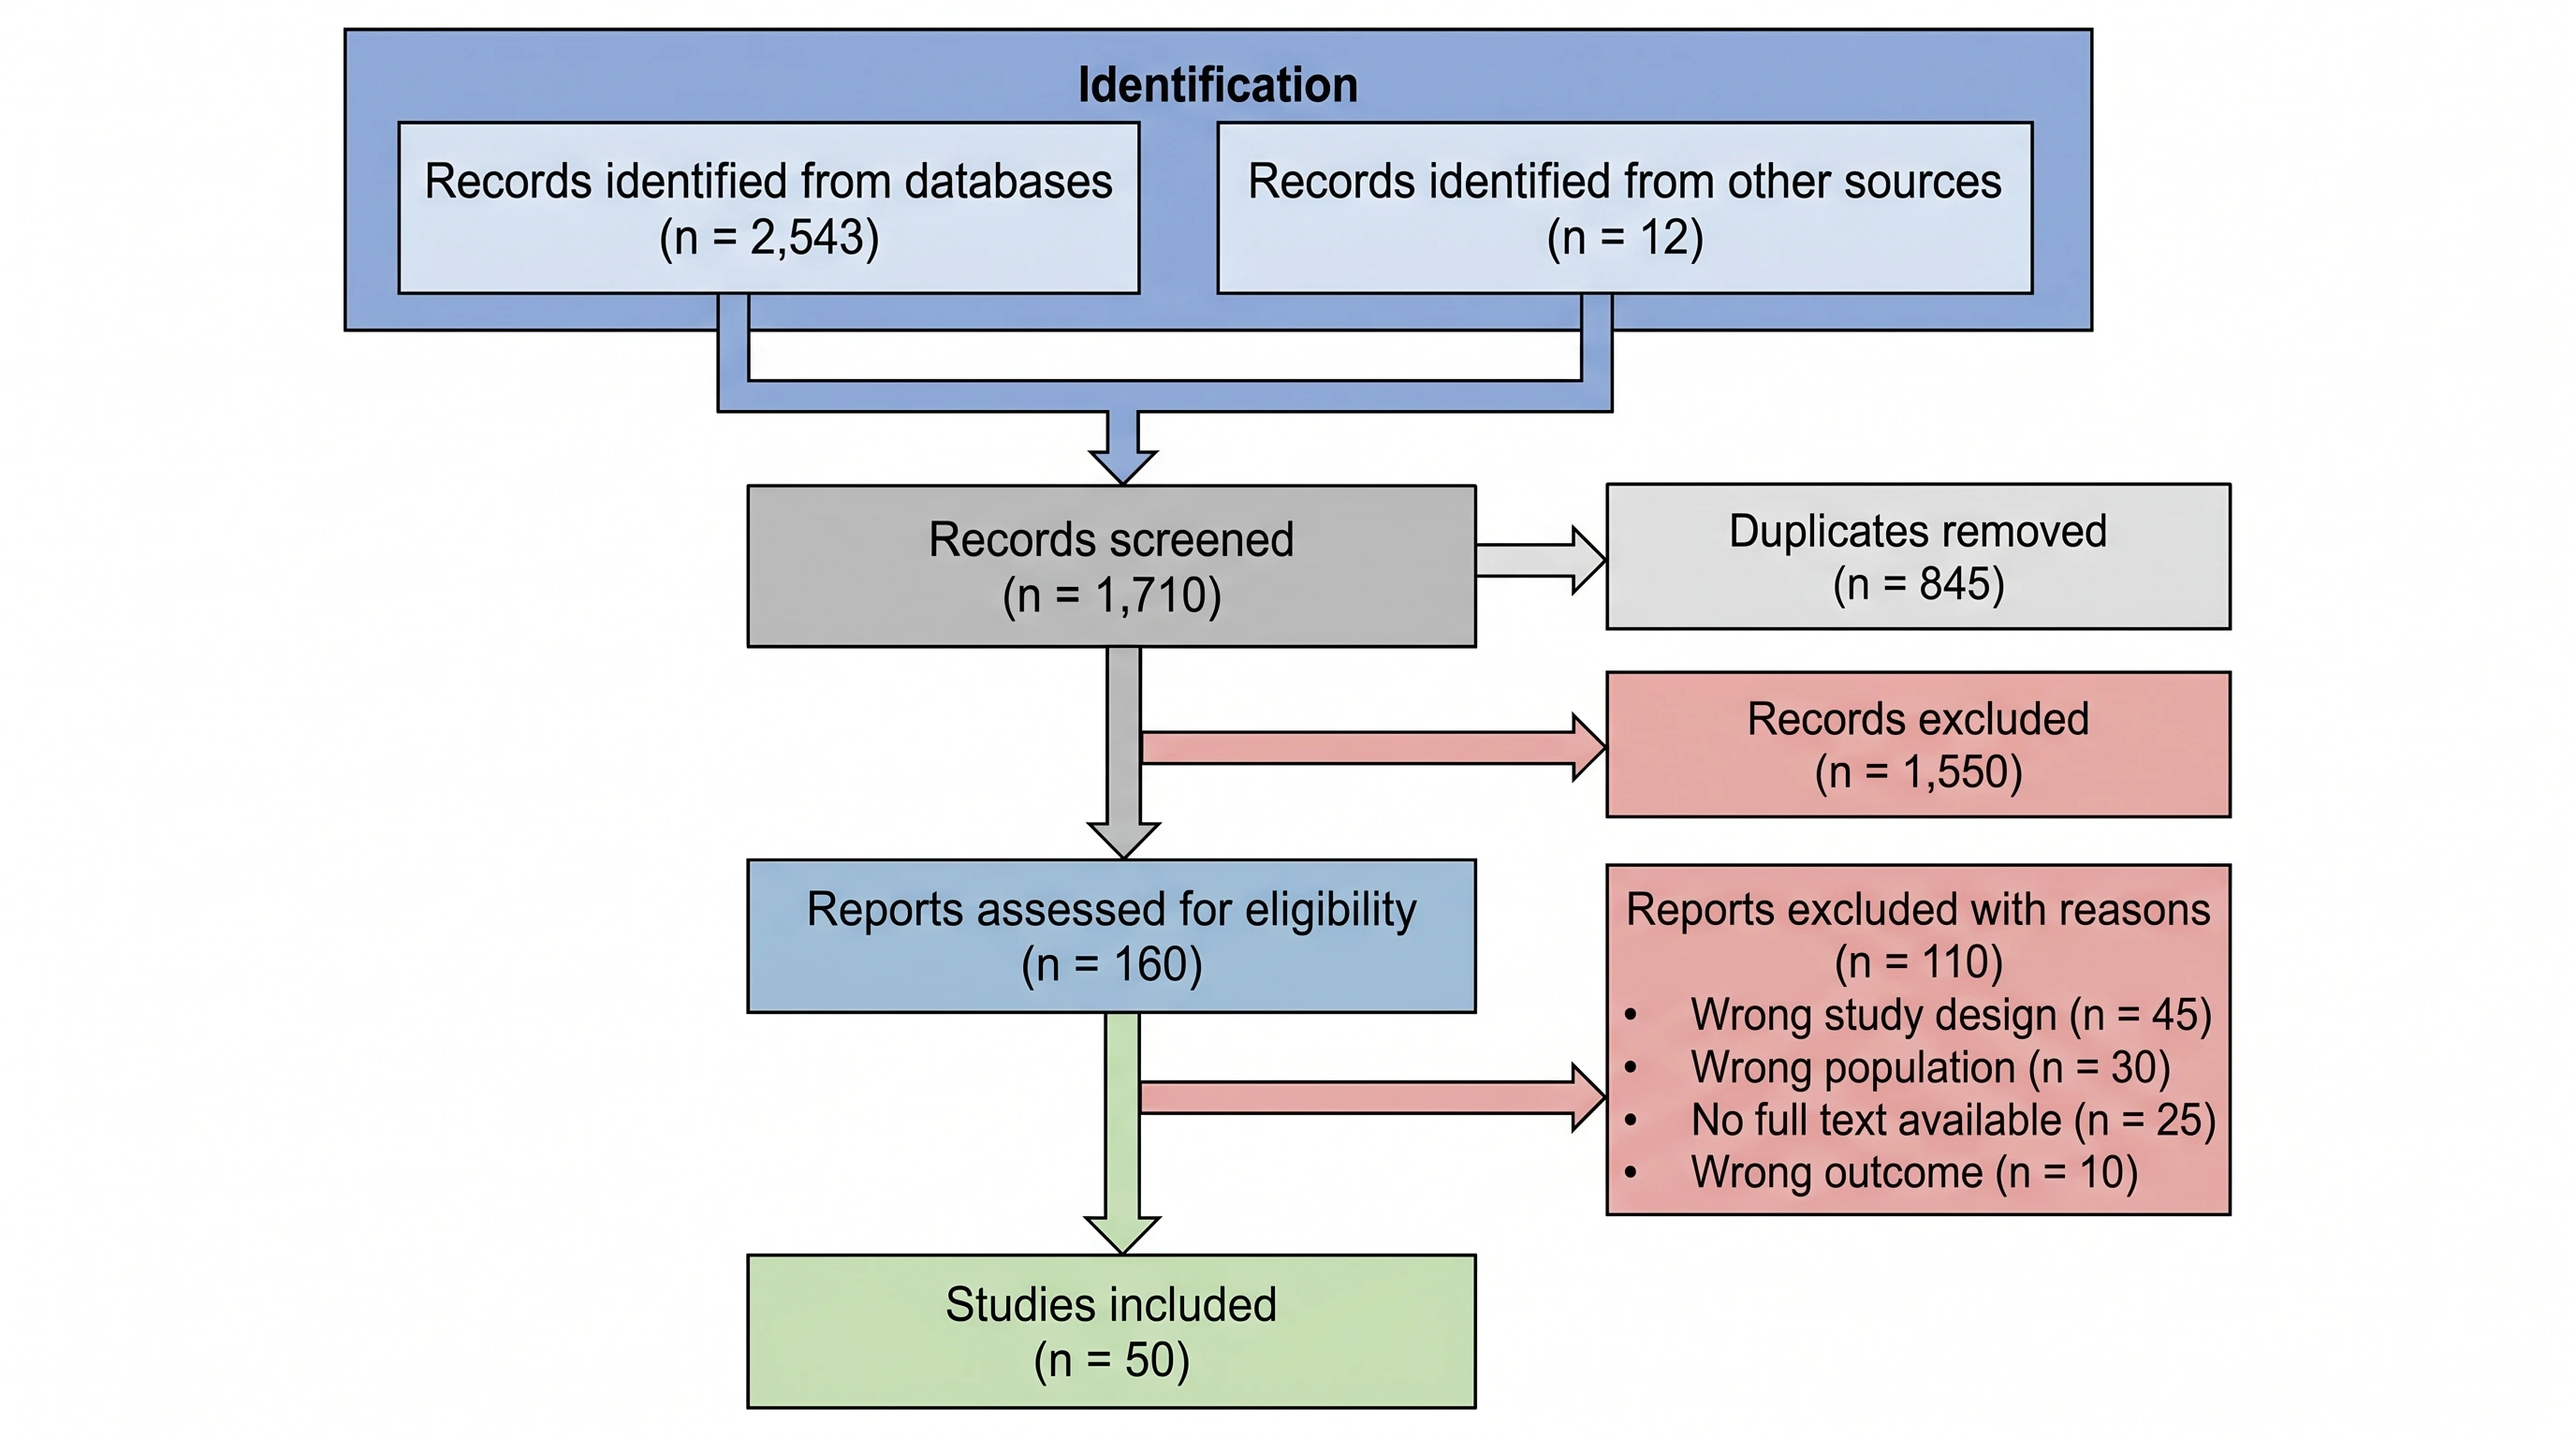
PRISMA 2020 splits identification into two columns: records found in databases and registers, and records found by other methods — citation chasing, preprint servers, trial registries, websites, and contact with authors. The two streams are screened separately and only merge at the included box. Reviewers notice when a team collapses them into one column, so the template keeps the streams and their arrows distinct.
List exclusion reasons with counts at full text
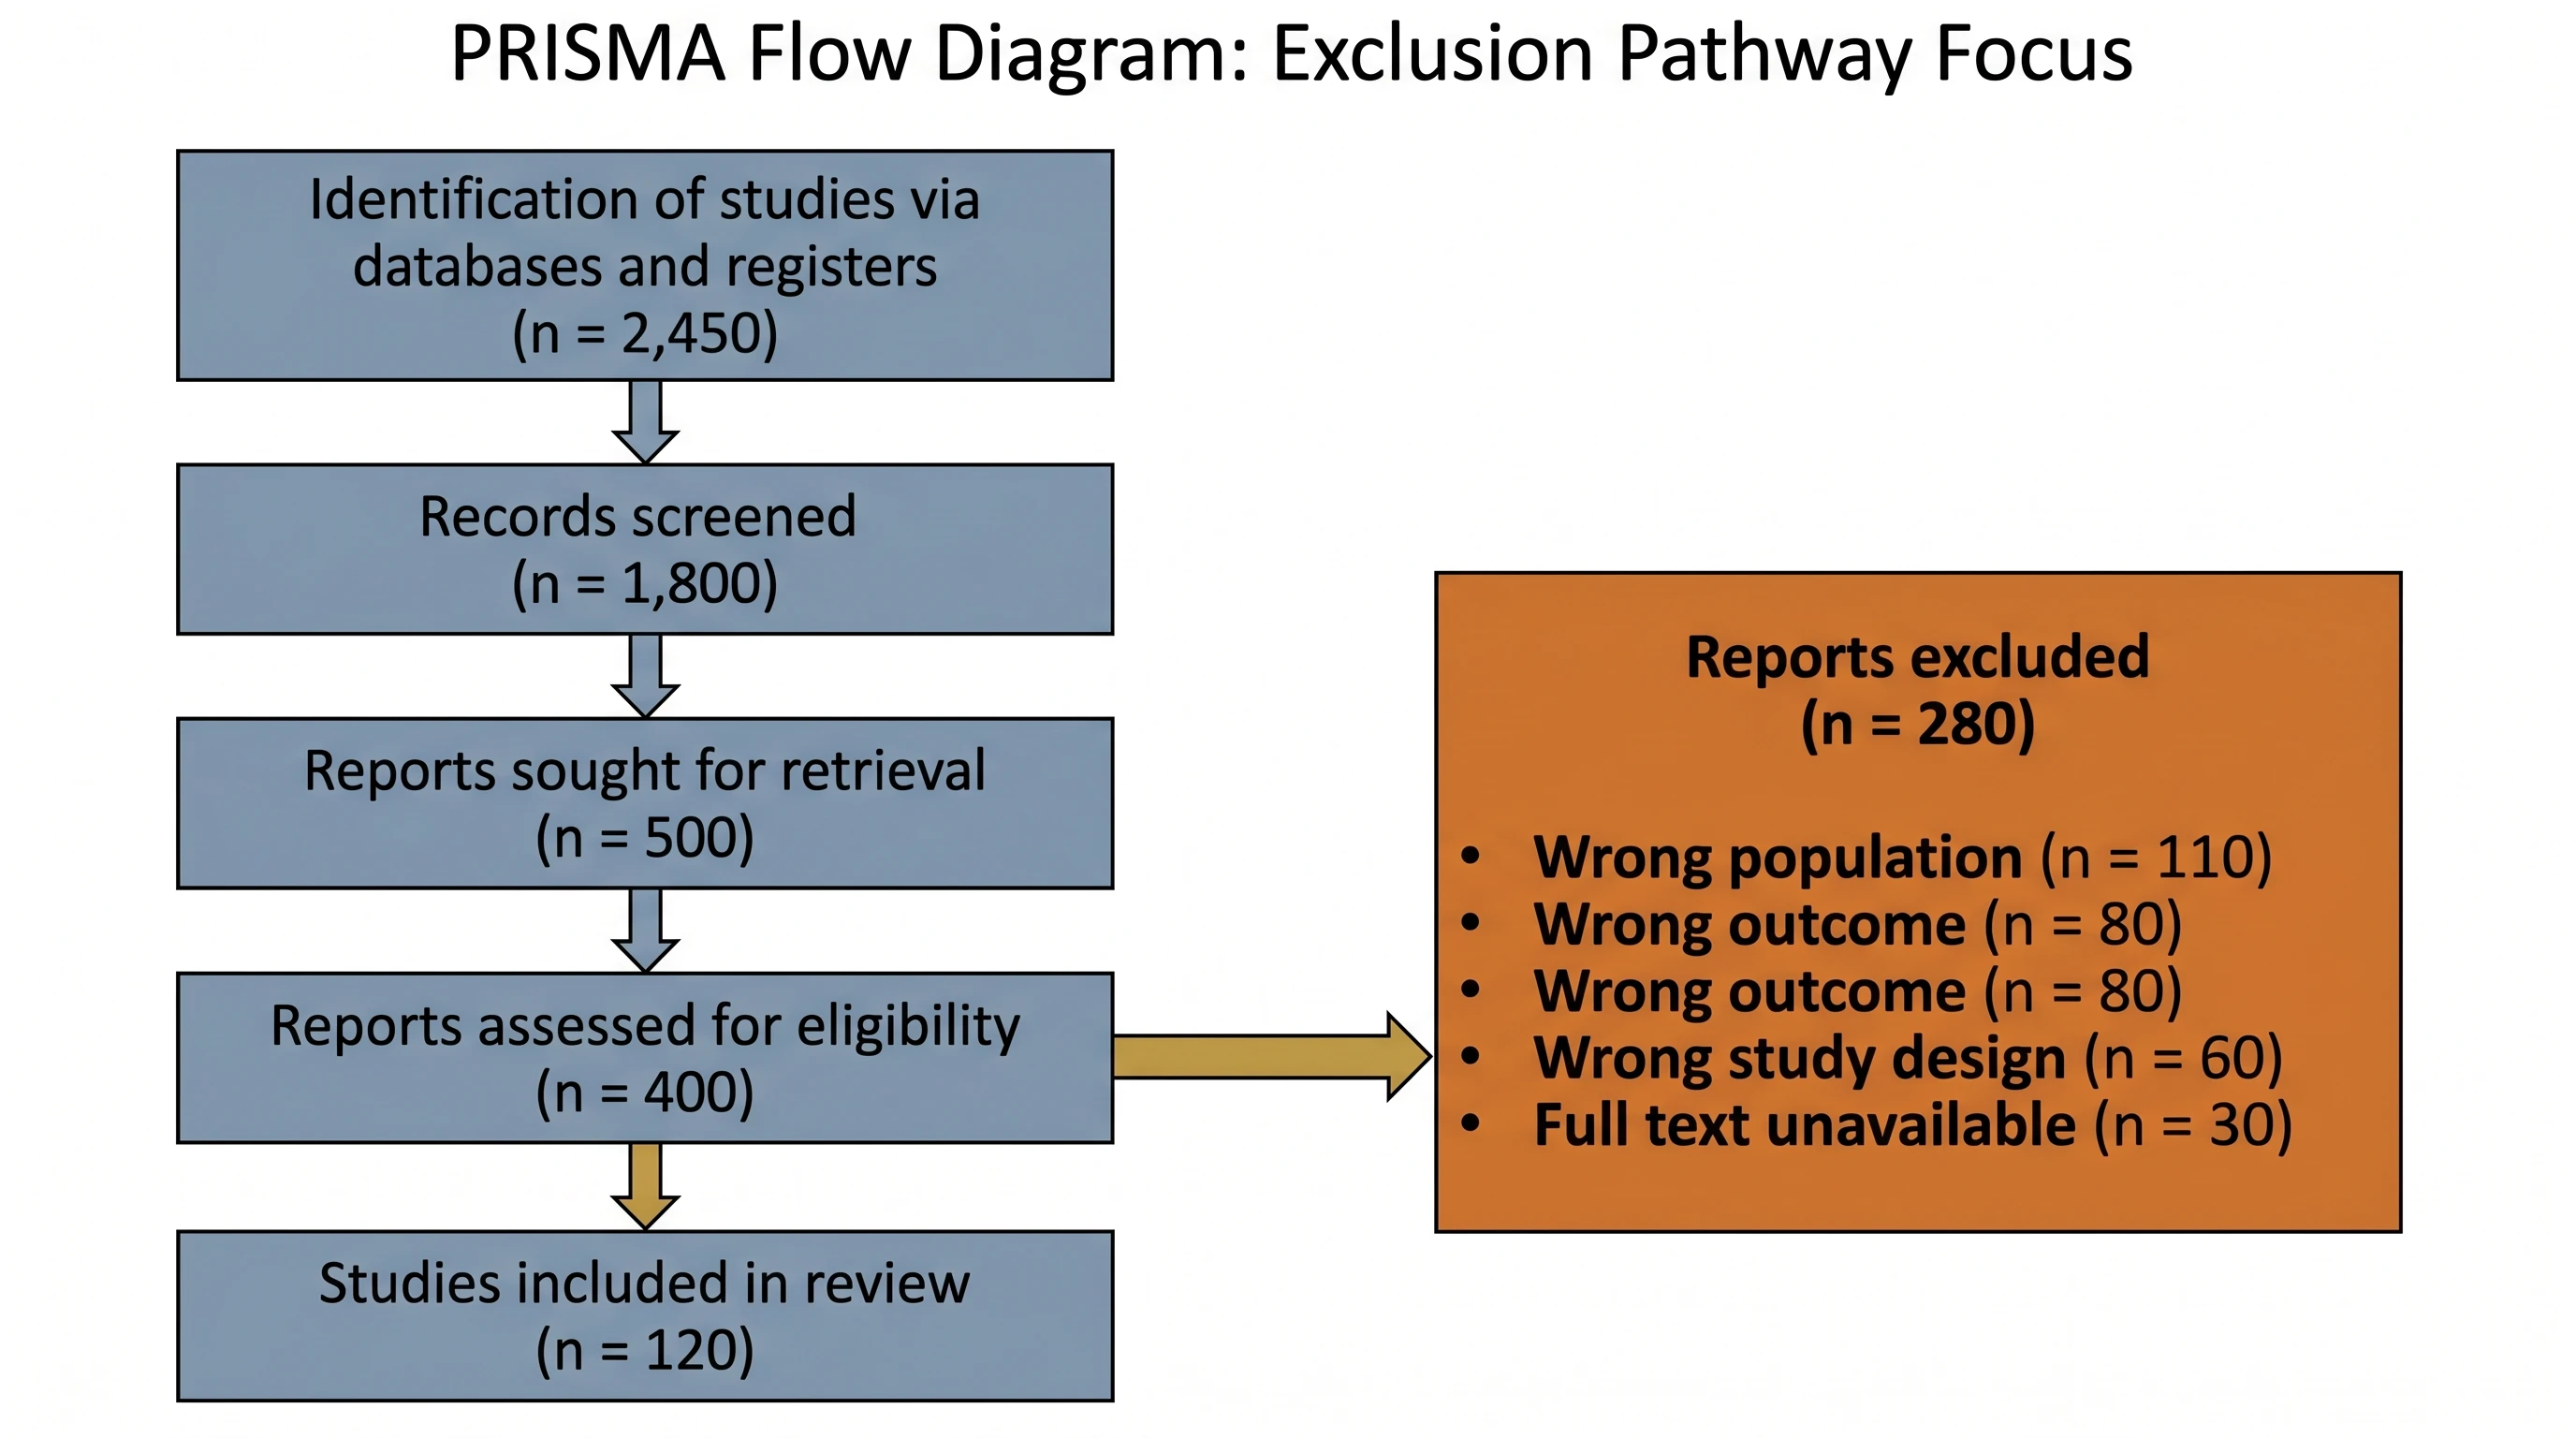
At the eligibility stage every excluded full text needs a reason and a number — wrong population, wrong intervention or comparator, no extractable outcome, ineligible design, duplicate report, retracted. Screening-stage exclusions are reported as a single total; only full-text exclusions are itemised. The side box expands to as many reasons as your review needs, and the counts stay linked to the boxes they came from.
Separate included studies from included reports
One study can appear as several reports — a trial paper, a secondary analysis, a conference abstract — so the final tier distinguishes studies included in the review from reports of those studies. If you pool results, add the number of studies contributing to each synthesis; a meta-analysis reader needs to see where the pooled n came from. Both variants are available as layouts.
PRISMA Flow Diagram for Systematic Reviews— templates & examples
How to make PRISMA Flow Diagram for Systematic Reviews
Describe your figure
Tell SciFig what to draw in plain language — no design tools required.
Generate with SciFig
Get a clean, publication-ready figure that matches your description in seconds.
Edit & export
Vectorize it into editable SVG, relabel everything, and export for your paper, poster, or slides.
Related searches
- prisma flow diagram
- prisma diagram
- prisma flowchart
- prisma flow chart
- prisma diagram template
- prisma flow diagram generator
- prisma creator
- exclusion flowchart maker
- systematic review figure flow chart
- diagrama prisma
- site or tool for fancy prisma flow design
Make figures for
Related pages
Research Methods Templates
Browse more Research Methods templates in SciFig's library.
All Templates
Browse every template page in SciFig's library.
Graphical Abstract Maker
Summarize your study in one panel
Scientific Poster Generator
Design a conference research poster
AI Scientific Image Generator
Generate research figures from text
Conceptual Framework Generator
Map variables and their relationships
Frequently Asked Questions
Common questions about PRISMA Flow Diagram for Systematic Reviews.

Ready to publish?
Make your own PRISMA Flow Diagram for Systematic Reviews in minutes.
Start for freeFree to start · No credit card required · Built for researchers