
Metabolic Syndrome (MetS): Causal Factors, Diagnosis, and Associated Diseases
A clear metabolic syndrome (MetS) schematic linking its causal factors, diagnostic criteria, and associated diseases for reviews, posters, and slides — edit and export.
Updated

Start with up to 150 free credits|No credit card required
Get up to 350 free credits on day one when you join through an invite.
What is Metabolic Syndrome (MetS): Causal Factors, Diagnosis, and Associated Diseases?
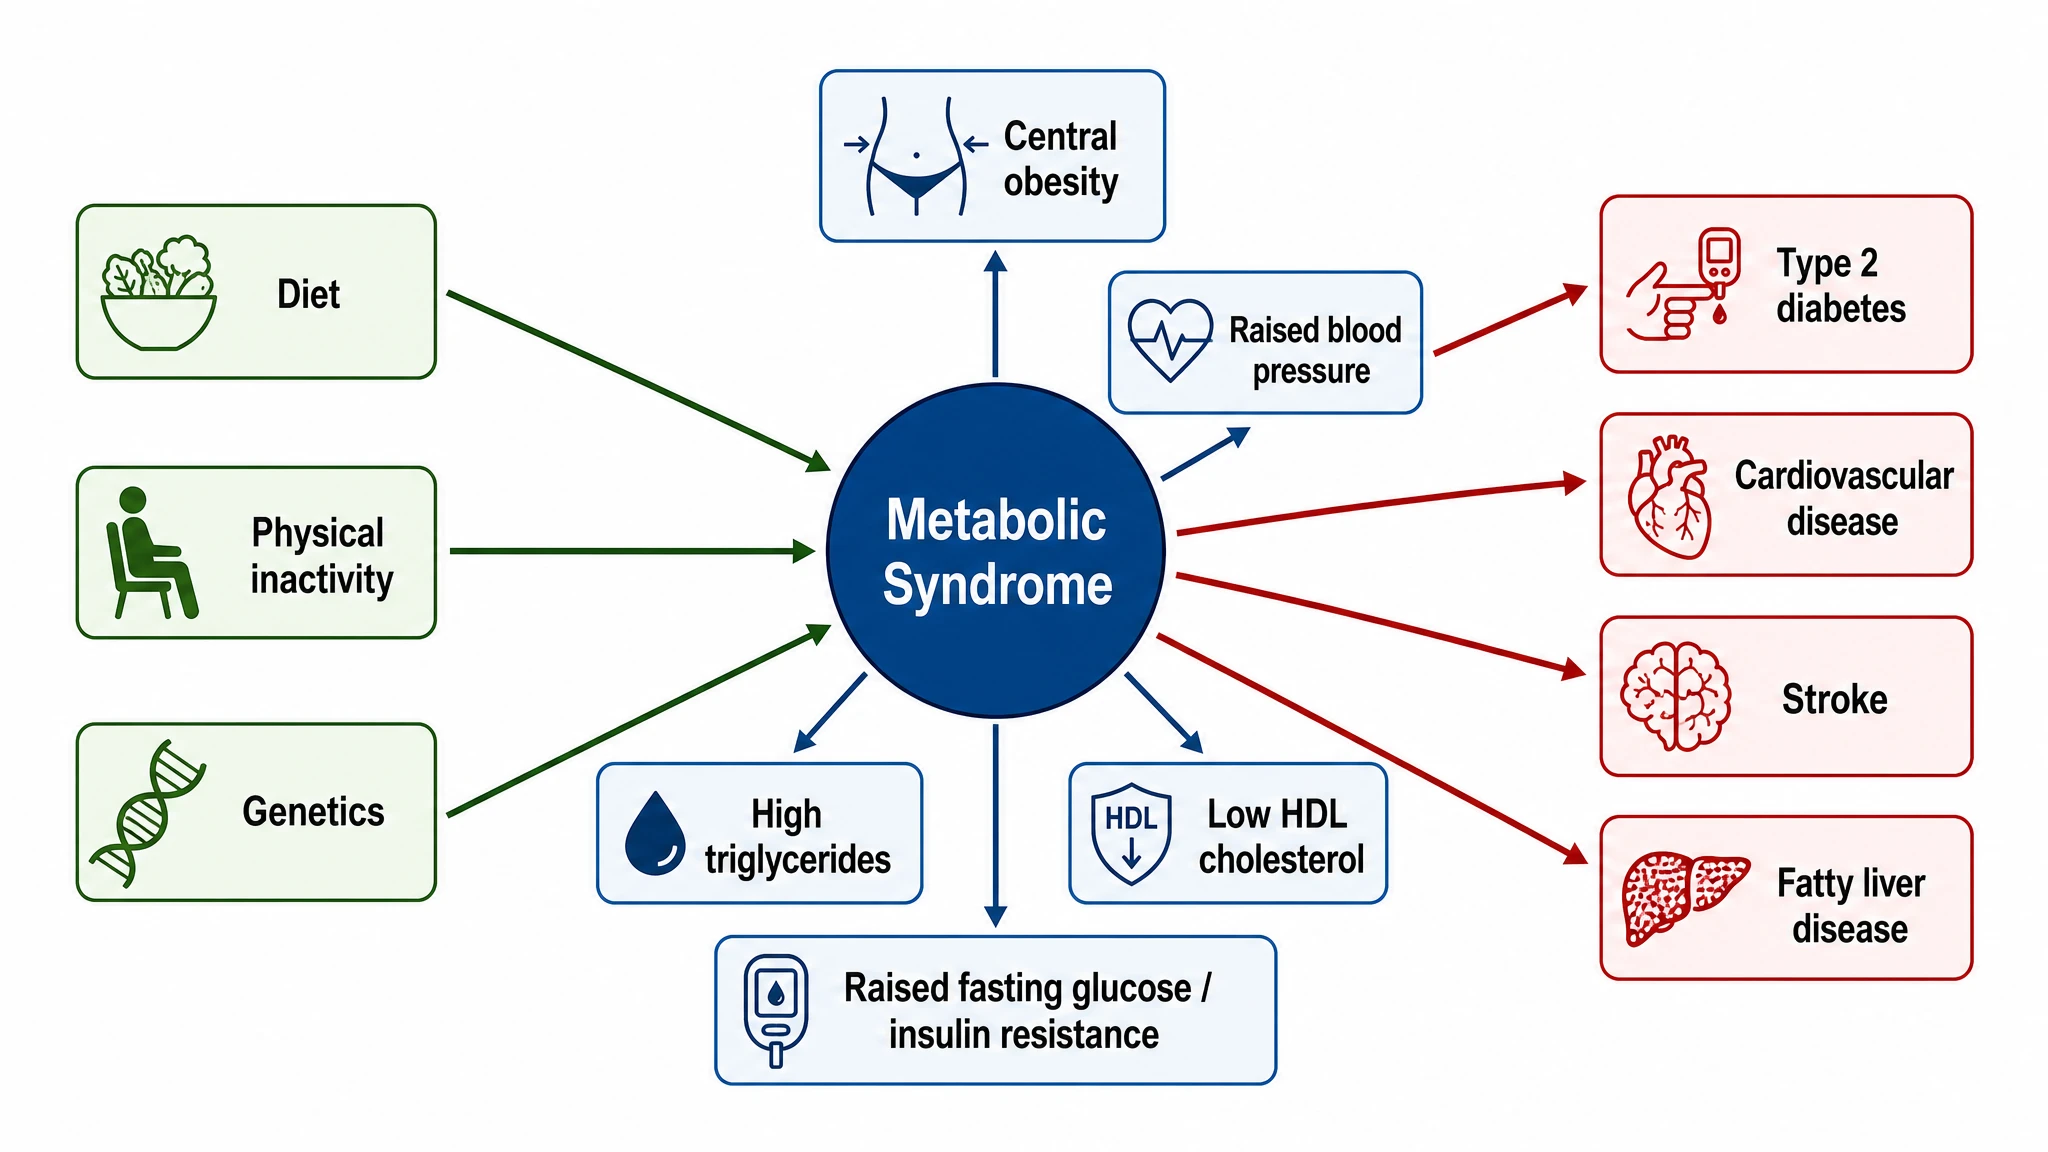
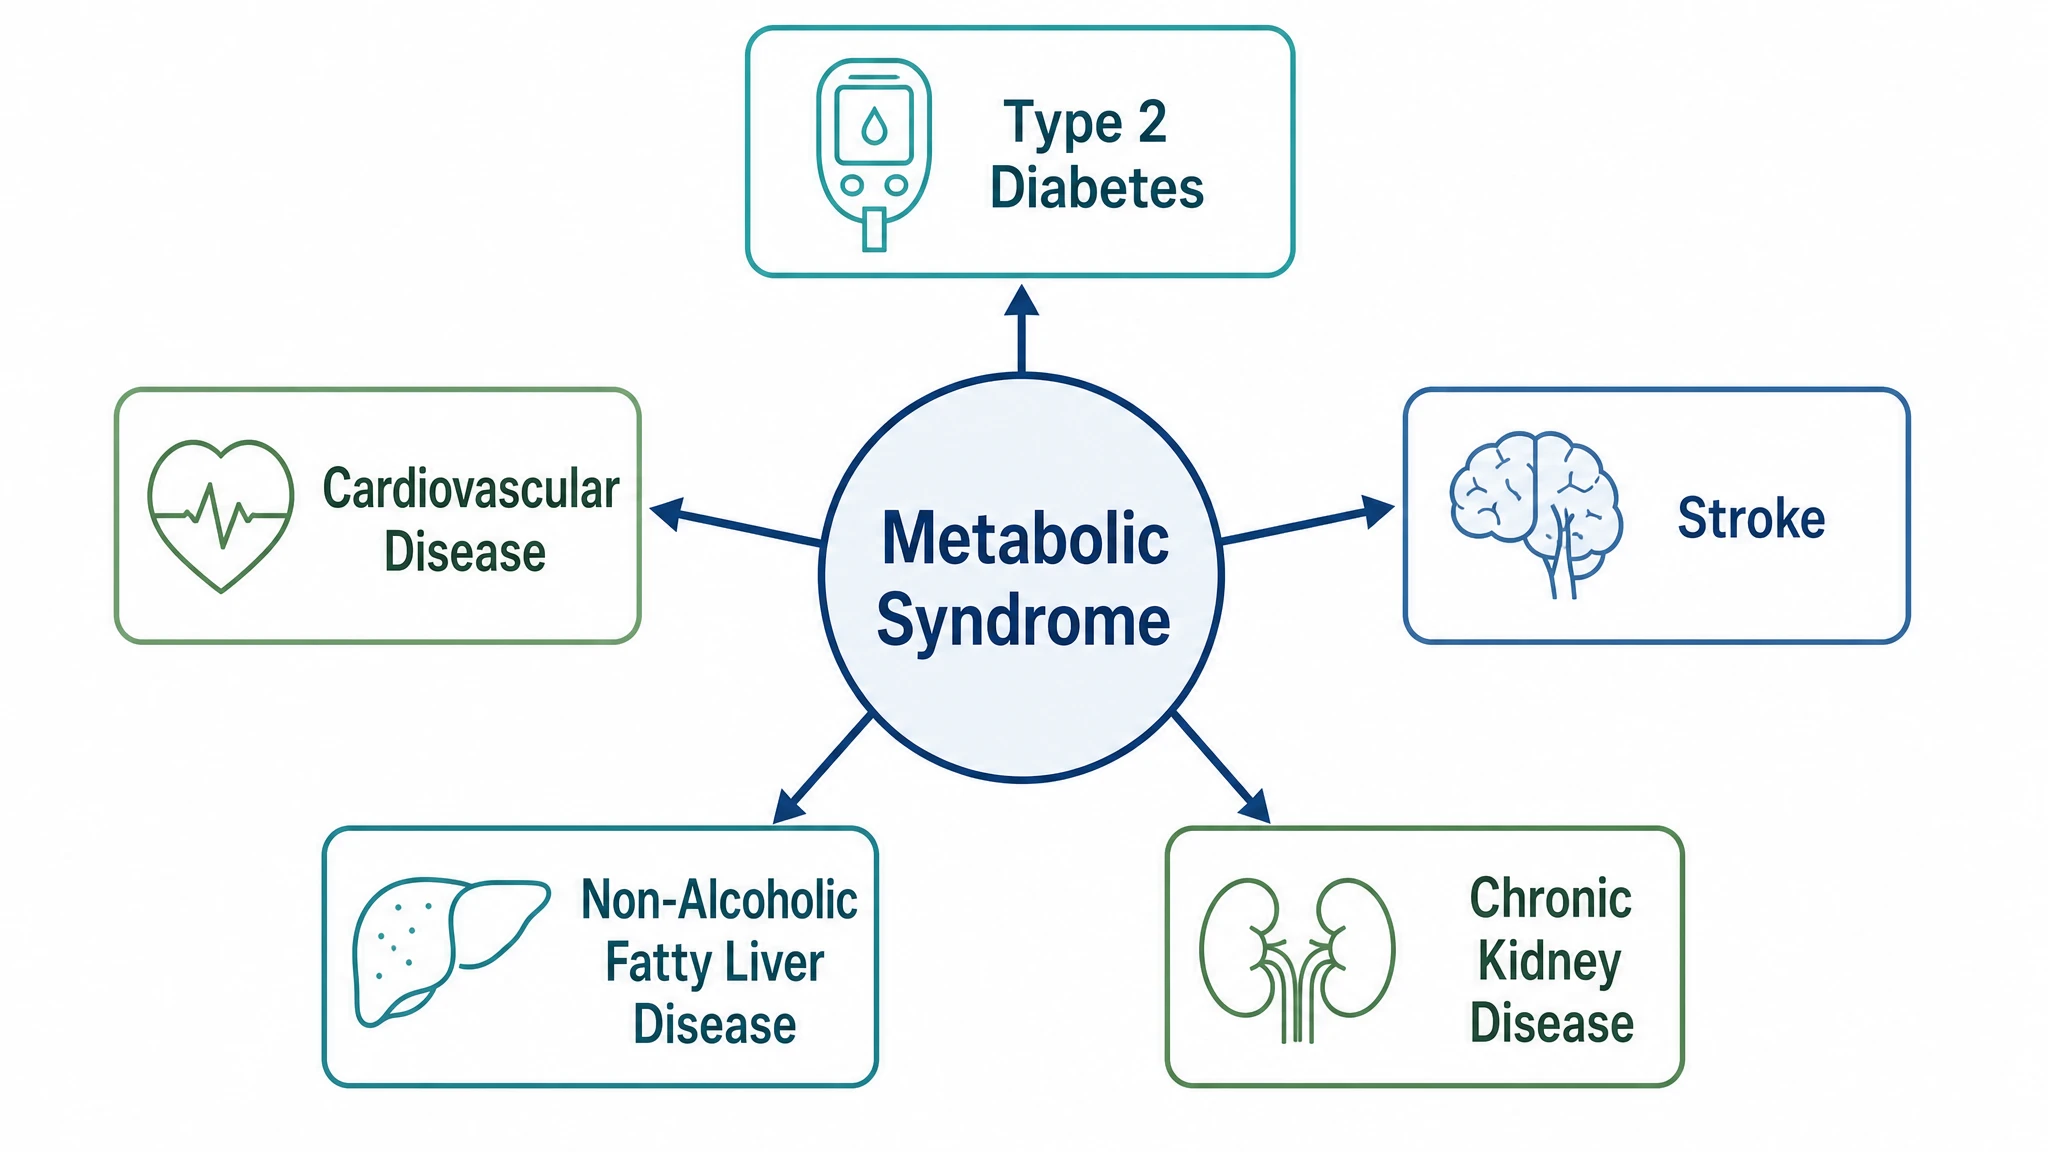
A metabolic syndrome schematic is a diagram that summarizes the cluster of conditions defining metabolic syndrome (MetS). It shows the core diagnostic factors — central obesity, raised blood pressure, dyslipidemia (high triglycerides, low HDL cholesterol), and raised fasting glucose with insulin resistance — and links them to associated diseases such as type 2 diabetes, cardiovascular disease, and fatty liver disease. With SciFig you generate an editable figure you can relabel and export.
Why Researchers Draw This Diagram
- One figure carries what a paragraph cannot: the criteria, the shared mechanism, and the disease endpoints are hard to hold in prose at the same time.
- It makes explicit that the traits are a correlated cluster with a common driver, not five independent comorbidities that happen to co-occur.
- Reviews and grant applications need a visual anchor that distinguishes ATP III from the IDF definition, since prevalence estimates differ substantially between them.
- Clinical teaching relies on it: trainees remember a diagram of the five criteria far better than a table of thresholds.
- Cohort and intervention papers use it as a graphical abstract to show which node their exposure or drug acts on.
- Public-health and epidemiology posters need one panel that non-specialist audiences can read from two meters away.
Elements to Include
- Central obesity — waist circumference with the definition-specific and ethnicity-specific cut-off stated on the figure, not left implicit.
- Atherogenic dyslipidaemia — triglycerides ≥150 mg/dL together with low HDL-C, drawn as one node since they share the VLDL/CETP mechanism.
- Raised blood pressure — ≥130/85 mmHg, or treatment for previously diagnosed hypertension.
- Raised fasting glucose — ≥100 mg/dL, spanning impaired fasting glucose through overt type 2 diabetes.
- Insulin resistance — the mechanistic hub, with free fatty acid flux, ectopic lipid, and compensatory hyperinsulinaemia shown as arrows into the four traits above.
- Chronic low-grade inflammation — adipose macrophage infiltration, TNF-α, IL-6, CRP, and reduced adiponectin.
- Downstream disease tier — T2DM, atherosclerotic CVD, MASLD, and chronic kidney disease, kept visually separate from the diagnostic criteria.
Where This Figure Is Used
- Narrative and systematic reviews of cardiometabolic risk, as the orienting first figure.
- Graphical abstracts for cohort studies reporting prevalence or incidence of the cluster.
- Introduction figures in papers on insulin sensitisers, GLP-1 receptor agonists, or lifestyle interventions, marking the node targeted.
- Medical and nutrition-science lectures covering diagnostic criteria and their mechanistic basis.
- Grant applications framing metabolic syndrome as a shared upstream driver of several disease endpoints.
- Conference posters and patient-facing materials where the criteria must be legible at a glance.
What the Figure Has to Get Right
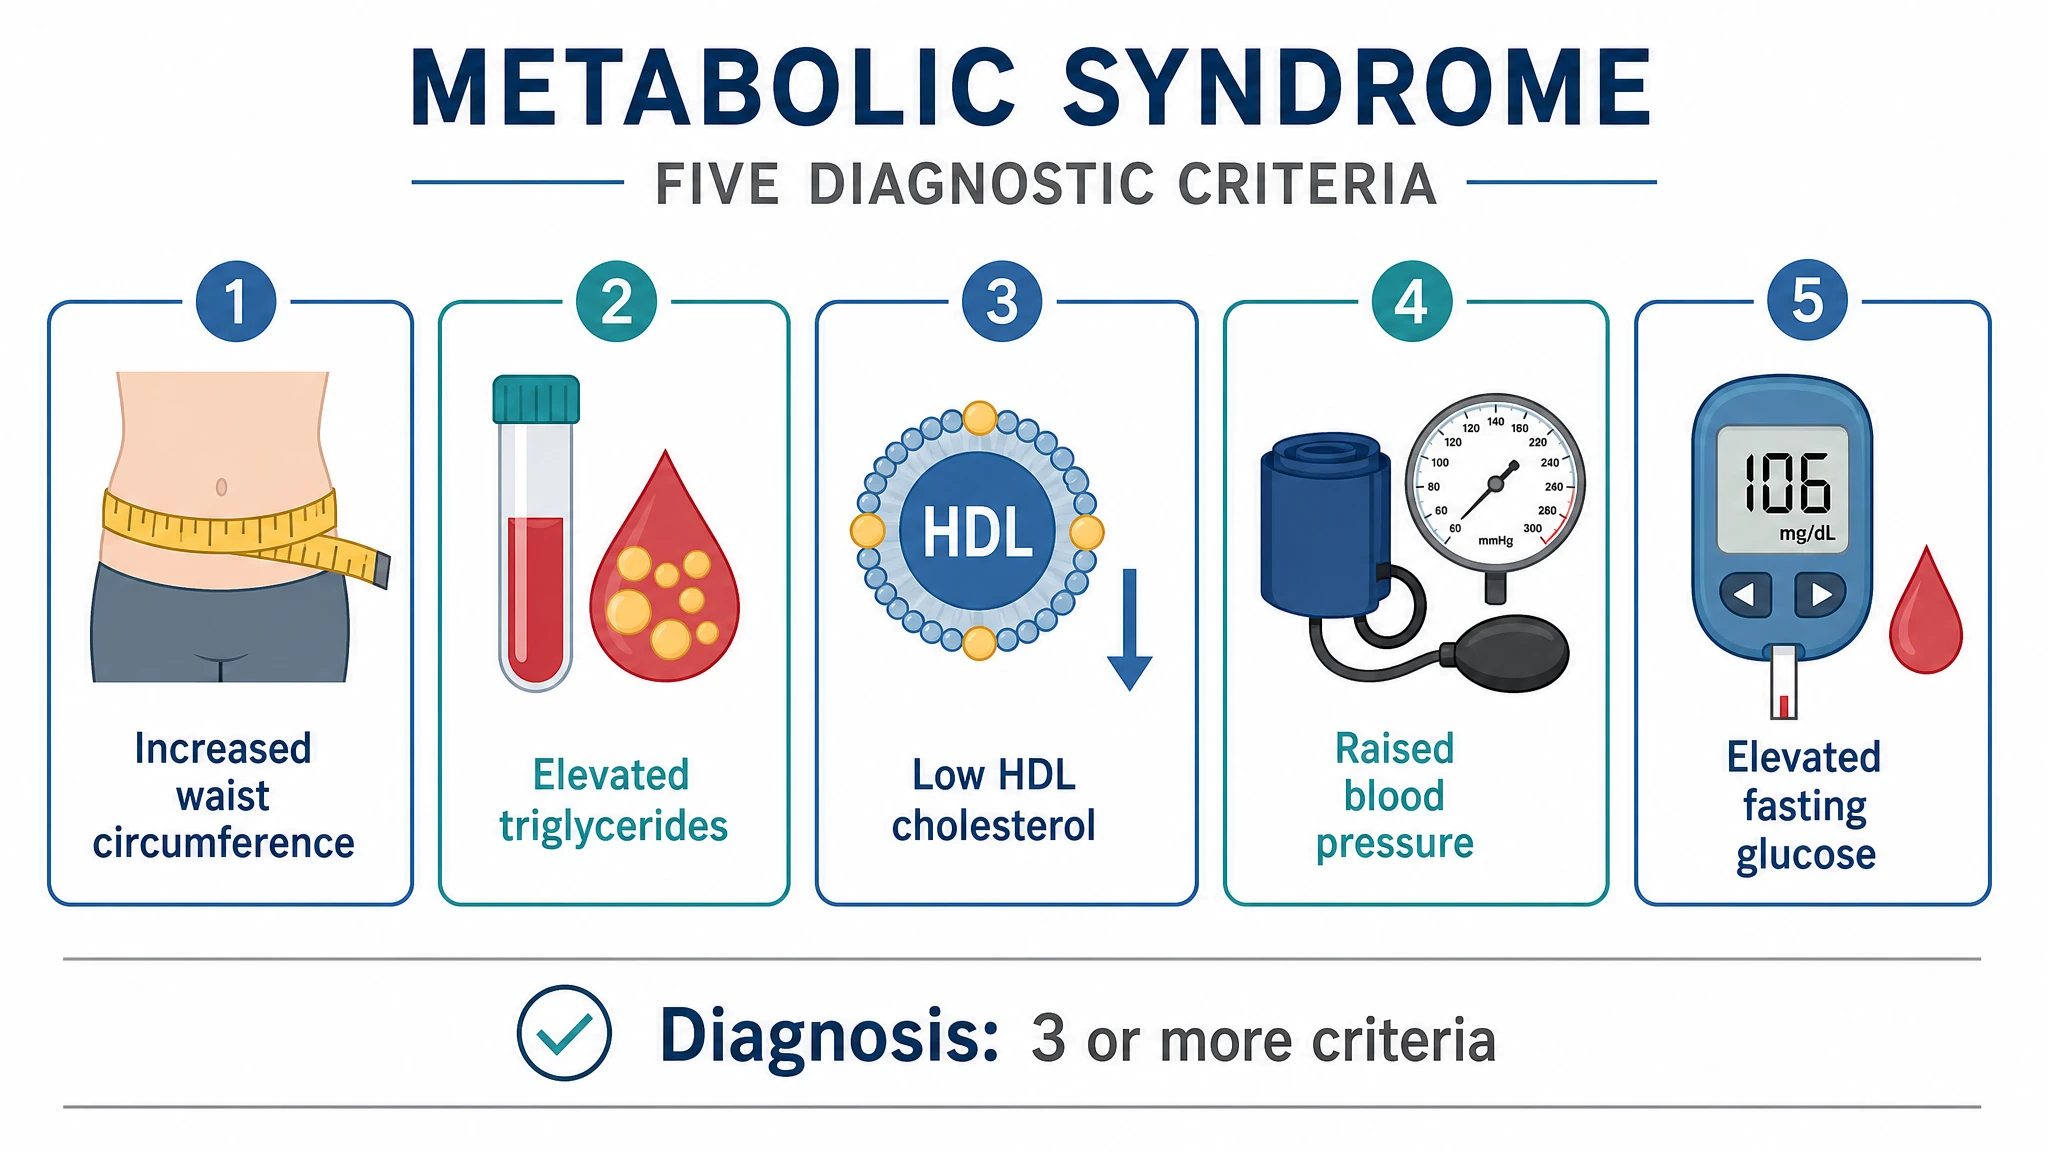
The Five Clinical Criteria, With Real Cut-Offs
NCEP ATP III calls for any three of five: elevated waist circumference (>102 cm in men, >88 cm in women), triglycerides ≥150 mg/dL, HDL-C <40 mg/dL in men or <50 mg/dL in women, blood pressure ≥130/85 mmHg, and fasting glucose ≥100 mg/dL. The IDF definition instead makes central adiposity obligatory and applies ethnicity-specific waist thresholds. A figure that omits the numbers or blurs the two definitions is not usable in a review.
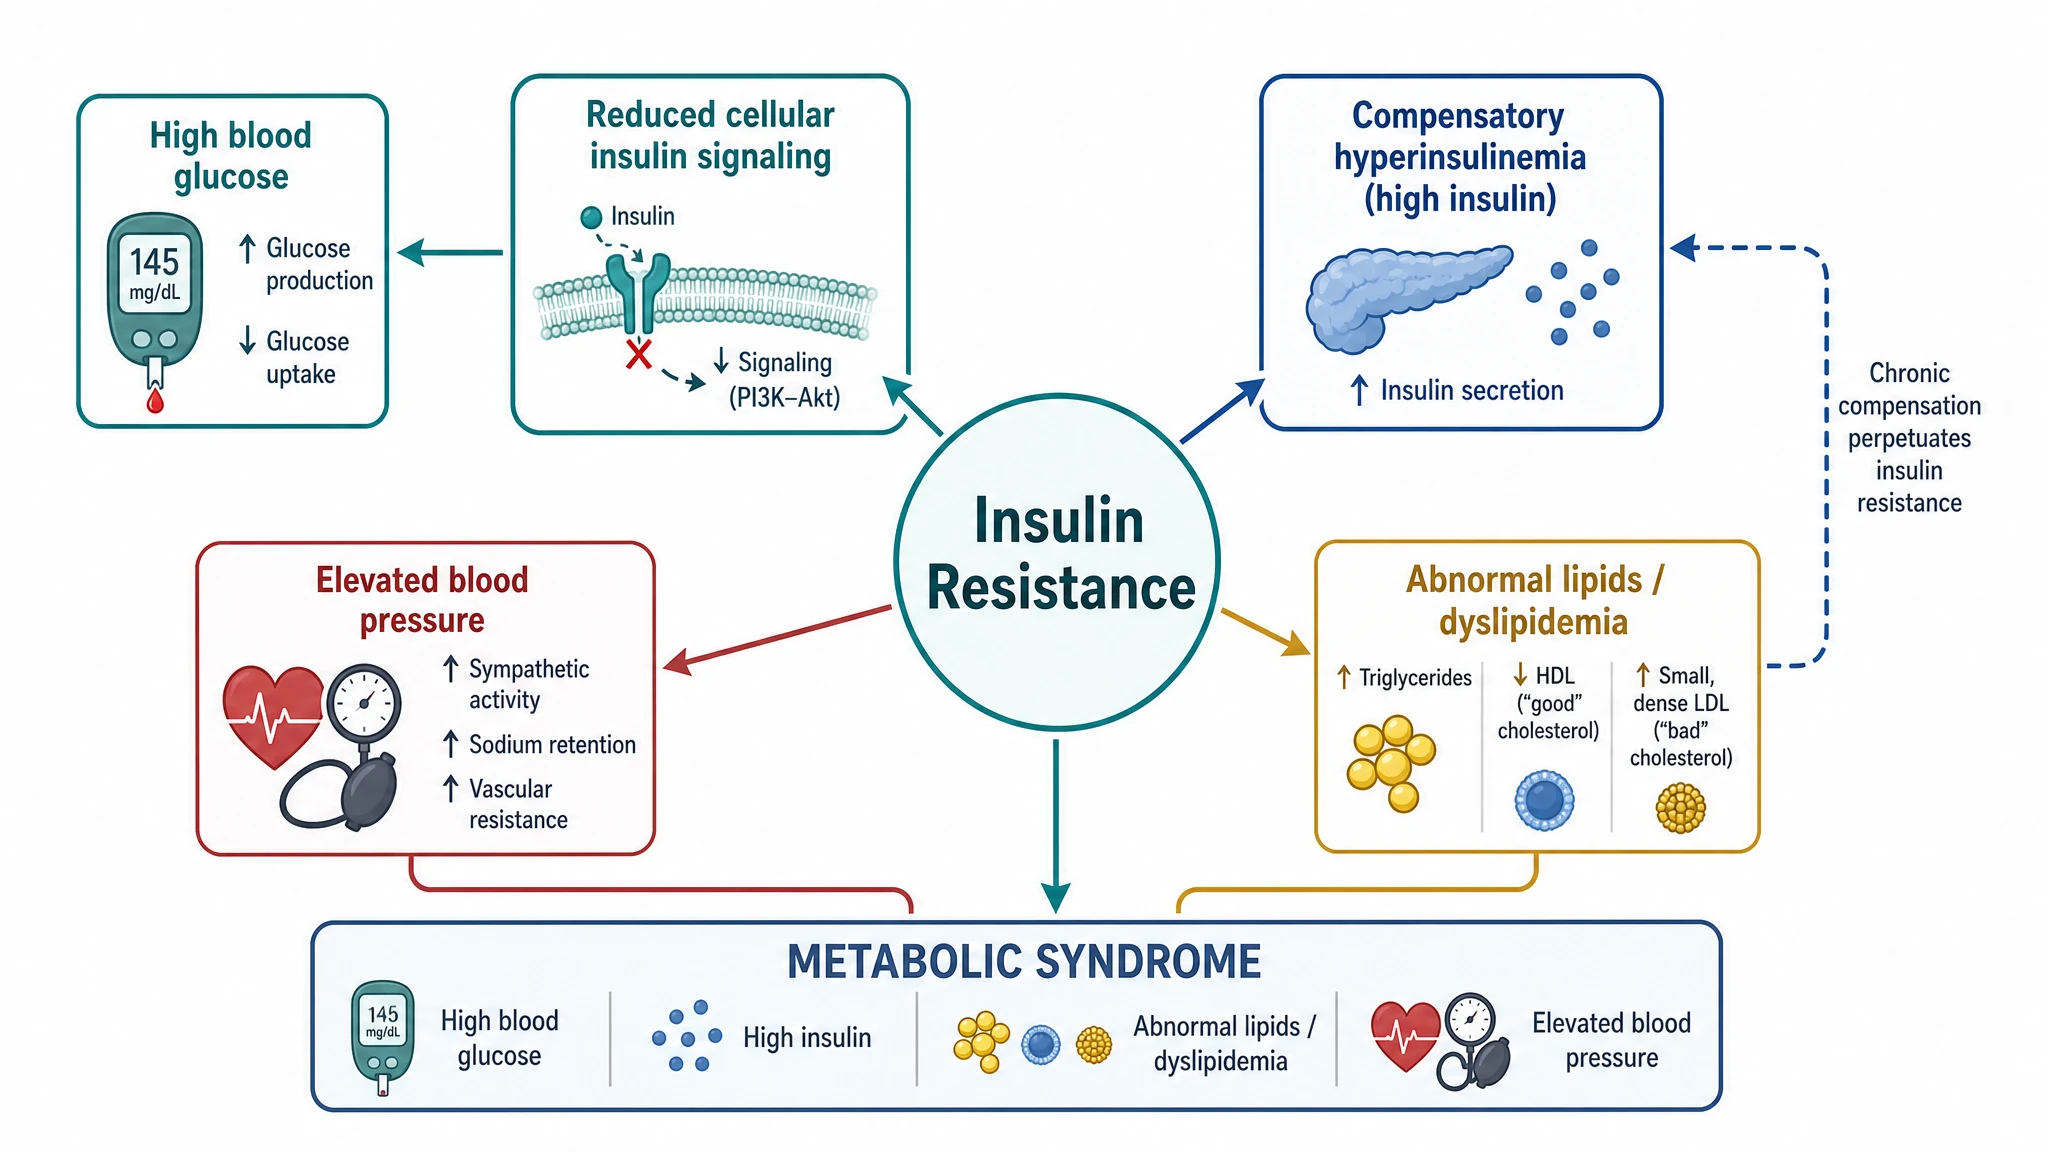
Visceral Adiposity and Insulin Resistance at the Core
The mechanistic center is expanded visceral adipose tissue: increased free fatty acid flux to the liver and muscle, ectopic lipid deposition, falling adiponectin, rising leptin, and low-grade inflammation driven by macrophage-derived TNF-α and IL-6. The result is impaired GLUT4 translocation, unrestrained hepatic gluconeogenesis, and compensatory hyperinsulinaemia. Drawing this hub explicitly is what separates a mechanistic schematic from a checklist of five boxes.
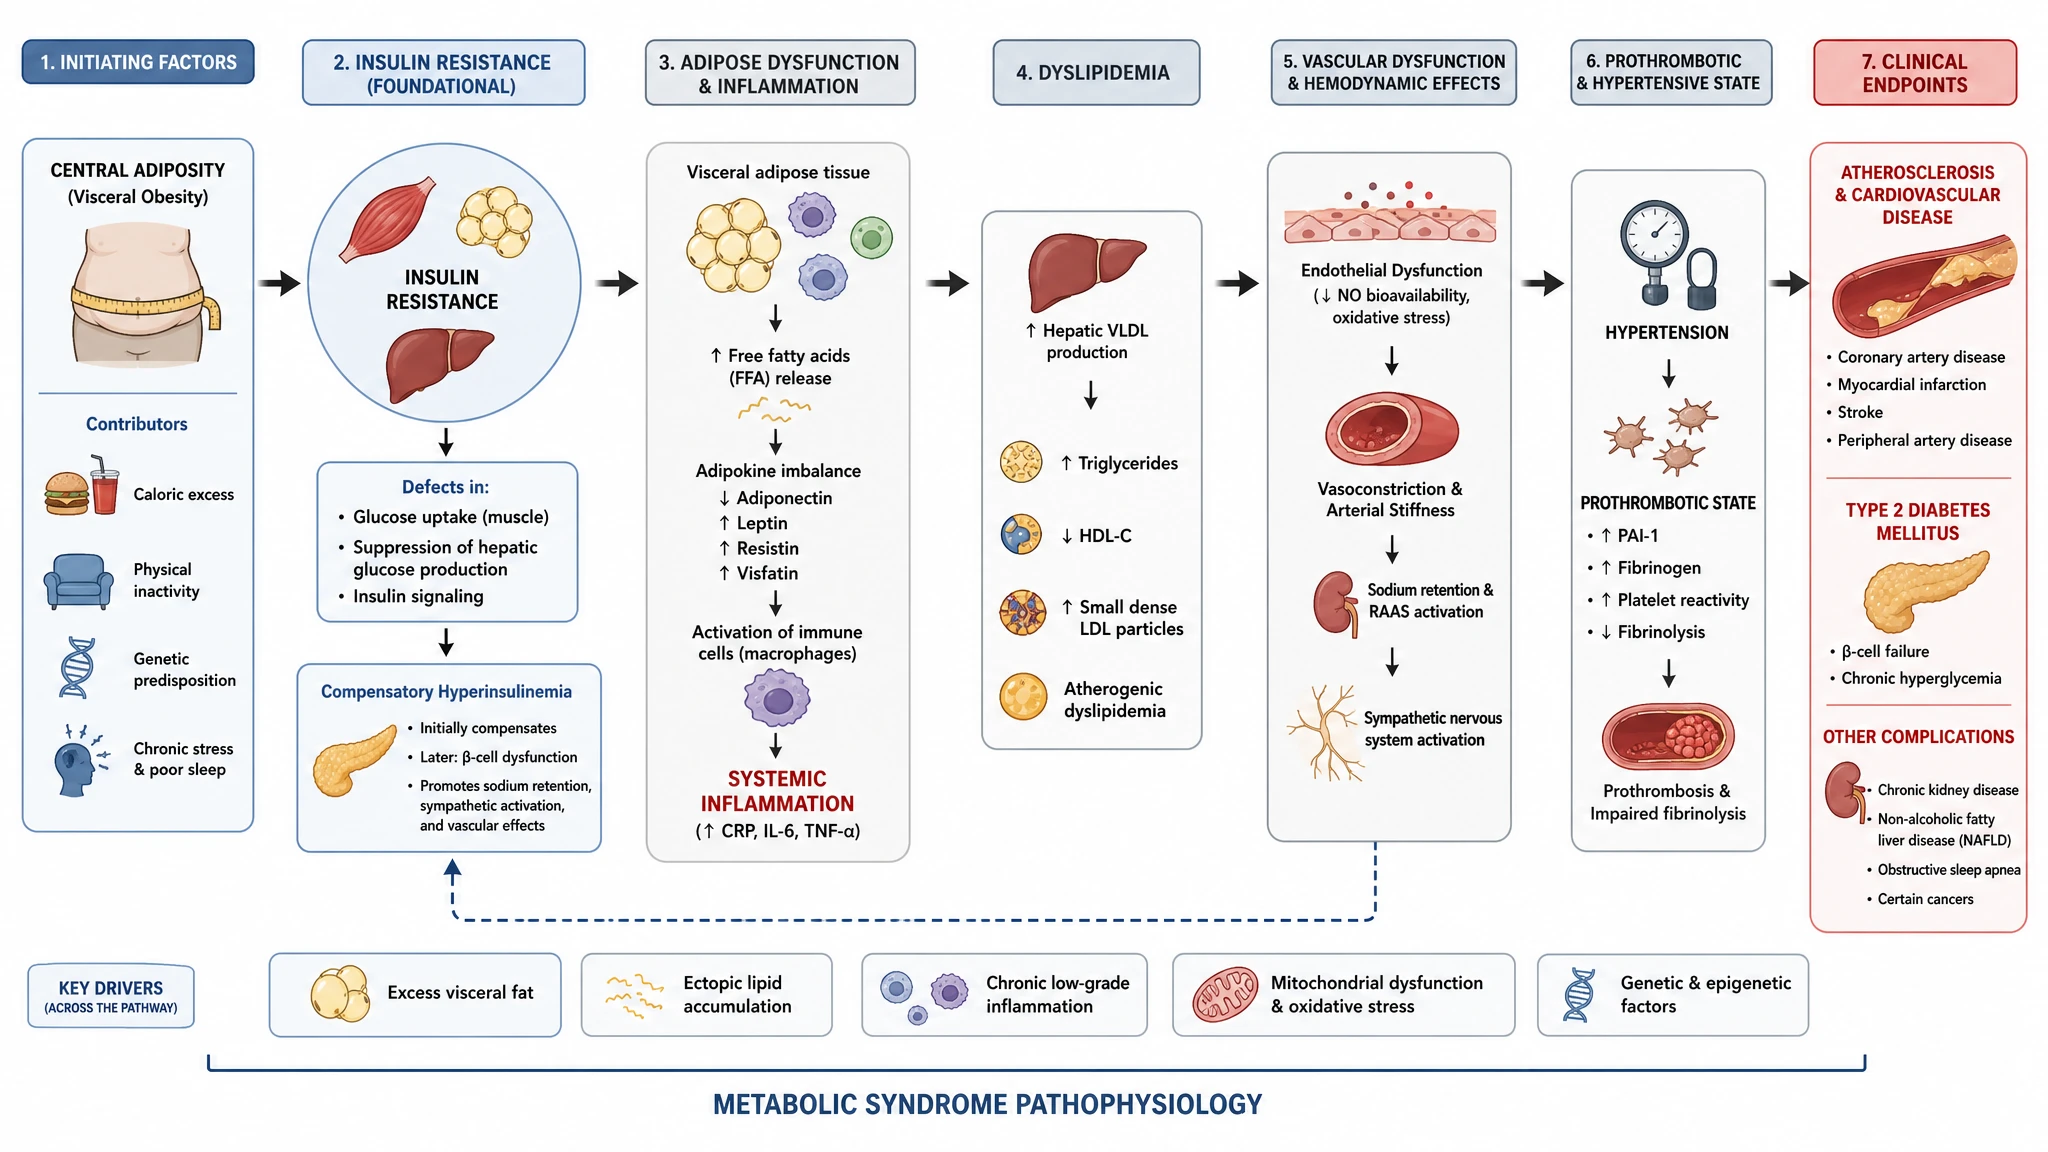
Mechanistic Links to Dyslipidaemia and Hypertension
Two criteria deserve their own arrows. Hepatic VLDL overproduction plus CETP-mediated exchange yields high triglycerides, small dense LDL, and depleted HDL — the atherogenic lipid triad. Hyperinsulinaemia in parallel raises renal sodium reabsorption, activates the sympathetic nervous system and the renin–angiotensin–aldosterone axis, and impairs endothelial nitric oxide signalling, producing the raised blood pressure. Showing these routes explains why the traits cluster rather than co-occurring by chance.
Downstream Disease Endpoints Drawn Explicitly
The clinical payoff of the cluster is what it predicts: type 2 diabetes, atherosclerotic cardiovascular disease, non-alcoholic fatty liver disease (now MASLD) progressing to steatohepatitis and fibrosis, chronic kidney disease, obstructive sleep apnoea, polycystic ovary syndrome, and several cancers. Keep these endpoints in a separate downstream tier so reviewers can distinguish diagnostic components from consequences — a distinction that is routinely collapsed in textbook figures.
Metabolic Syndrome (MetS): Causal Factors, Diagnosis, and Associated Diseases— templates & examples
How to make Metabolic Syndrome (MetS): Causal Factors, Diagnosis, and Associated Diseases
Describe your figure
Tell SciFig what to draw in plain language — no design tools required.
Generate with SciFig
Get a clean, publication-ready figure that matches your description in seconds.
Edit & export
Vectorize it into editable SVG, relabel everything, and export for your paper, poster, or slides.
Related searches
- metabolic syndrome schematic
- metabolic syndrome diagram
- metabolic syndrome criteria
- metabolic syndrome risk factors
- metabolic syndrome associated diseases
- mets diagnosis
- insulin resistance syndrome diagram
- metabolic syndrome causes
- components of metabolic syndrome
- central obesity hypertension dyslipidemia
Make figures for
Related pages
Medicine Templates
Browse more Medicine templates in SciFig's library.
All Templates
Browse every template page in SciFig's library.
Graphical Abstract Maker
Summarize your study in one panel
Scientific Poster Generator
Design a conference research poster
AI Scientific Image Generator
Generate research figures from text
Conceptual Framework Generator
Map variables and their relationships
Frequently Asked Questions
Common questions about Metabolic Syndrome (MetS): Causal Factors, Diagnosis, and Associated Diseases.

Ready to publish?
Make your own Metabolic Syndrome (MetS): Causal Factors, Diagnosis, and Associated Diseases in minutes.
Start for freeFree to start · No credit card required · Built for researchers