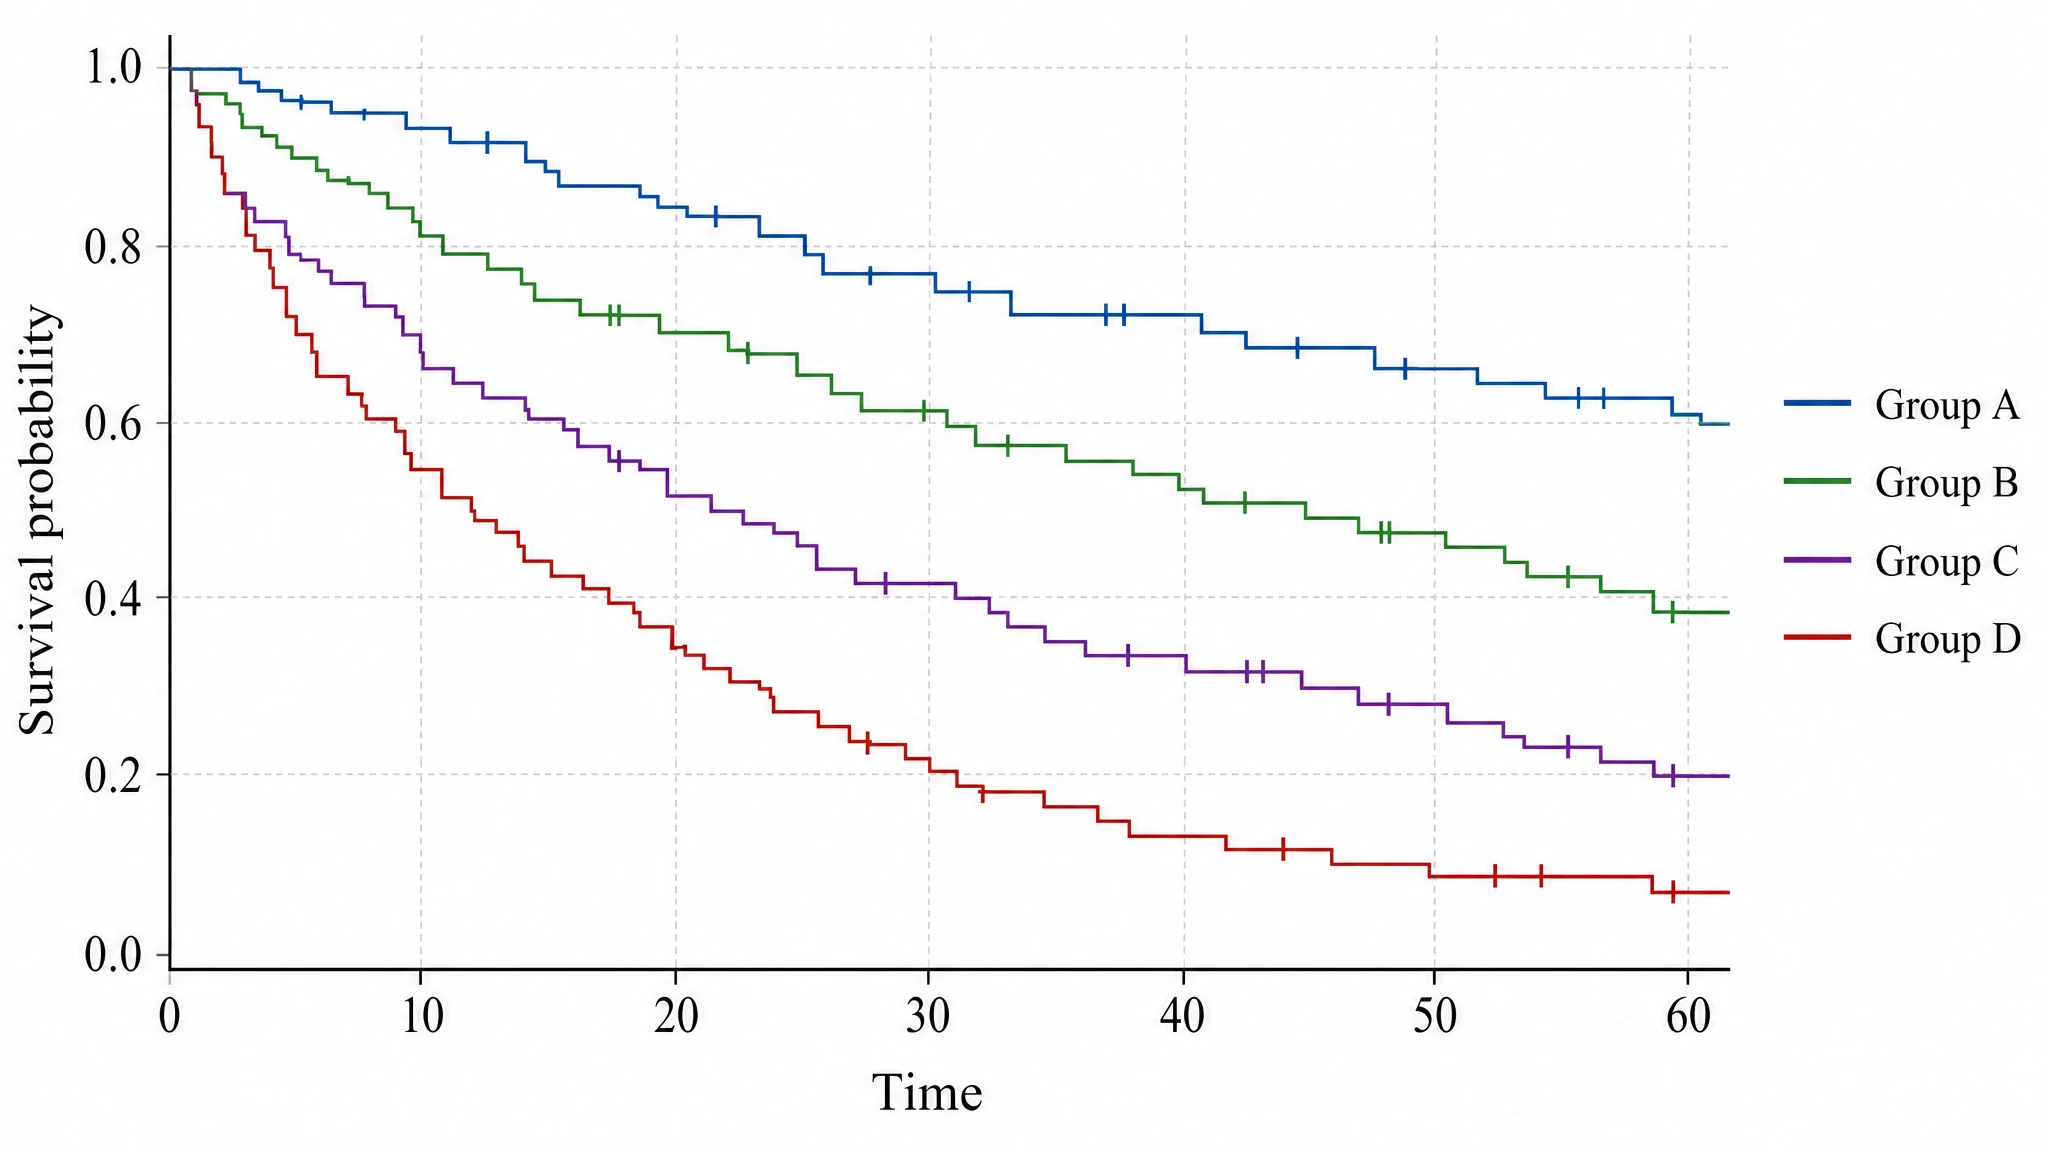
Kaplan-Meier Survival Curve
The standard stepwise survival curve for plotting the probability of survival over time, with censoring tick marks and side-by-side comparison of study groups.
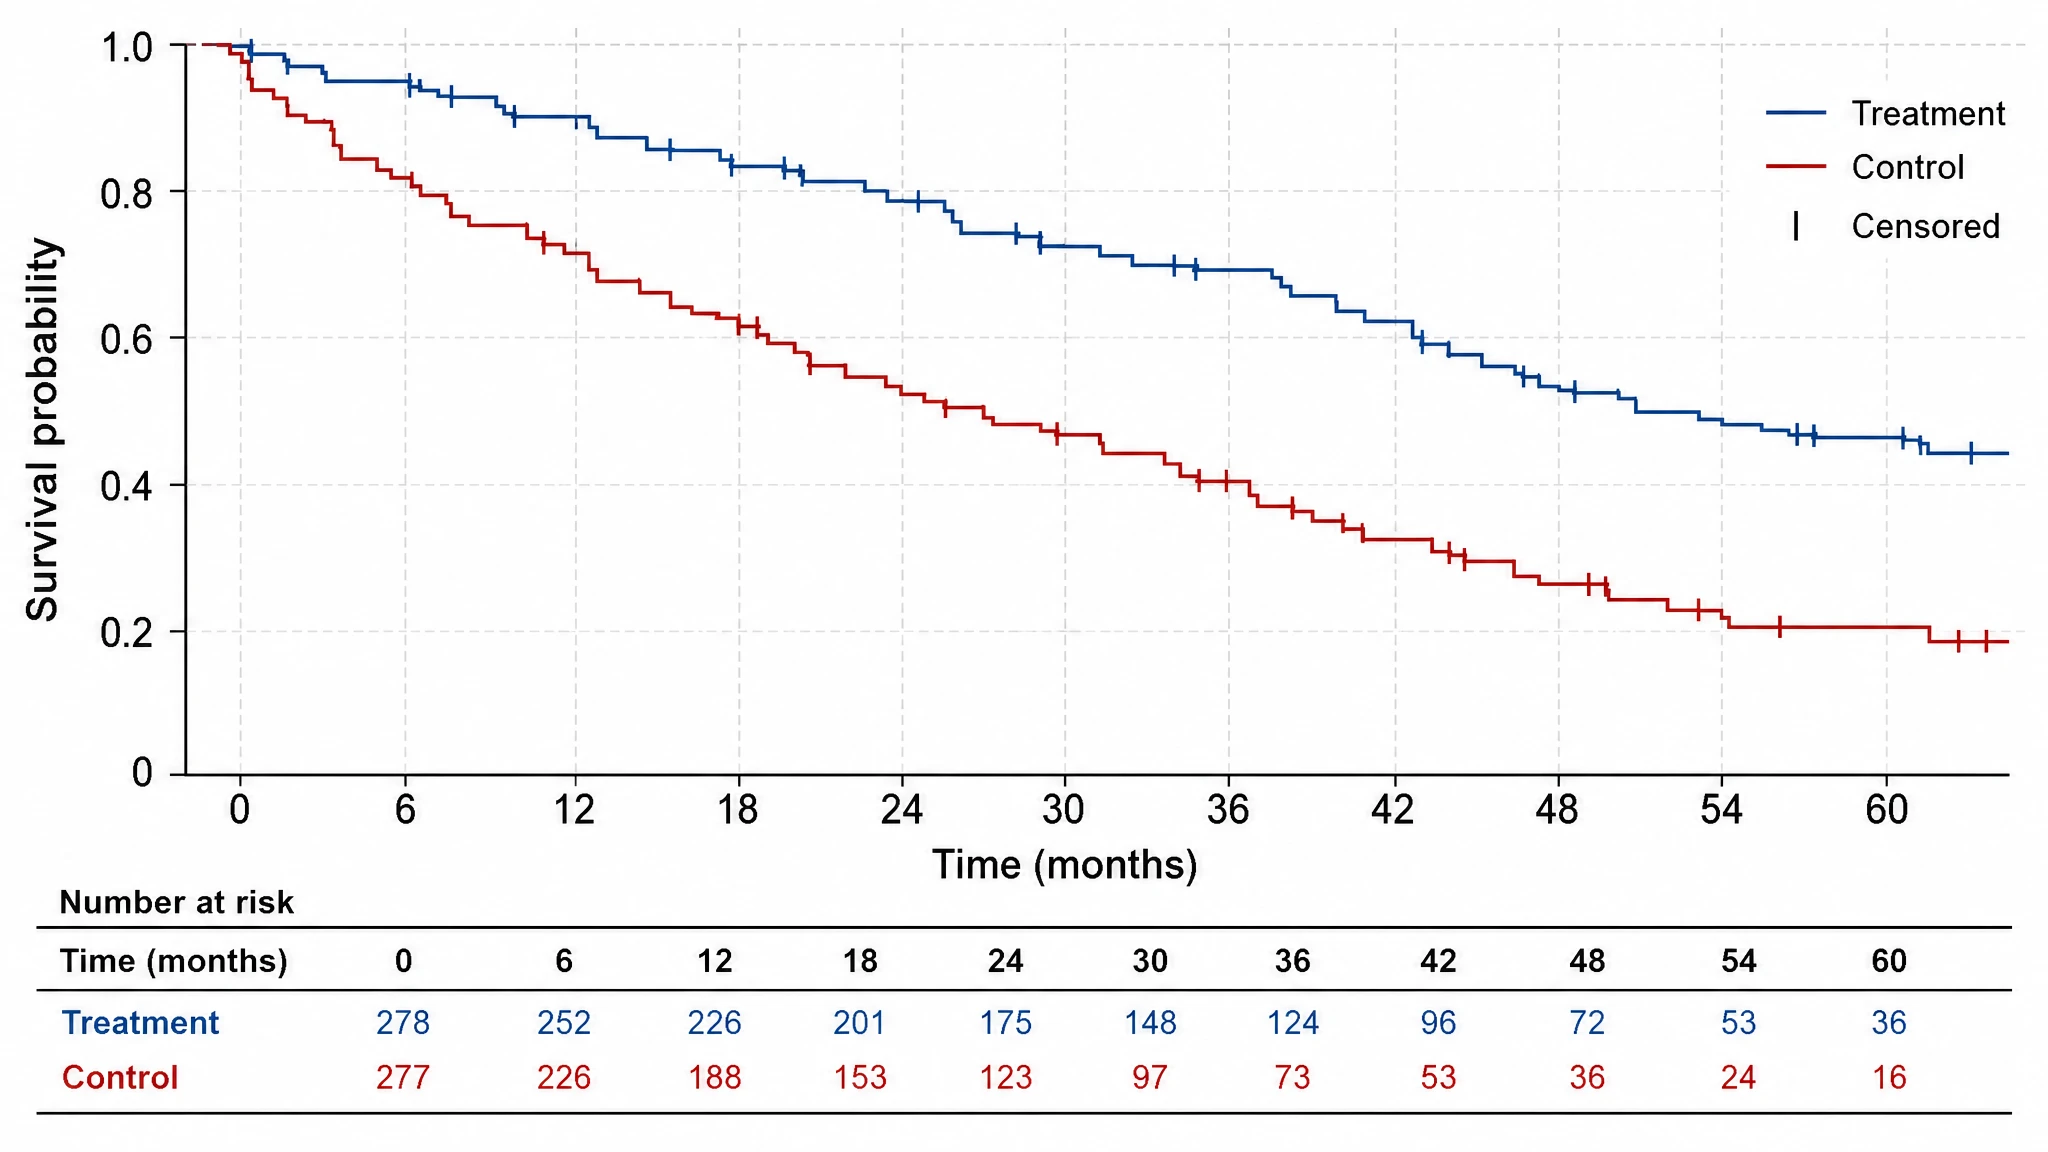
Figure prompt
Core Subject (e.g., Cas9 protein cutting DNA)
Action / Details (e.g., Double strand break, detailed molecular view)
Start with 200 free credits|No credit card required
Get up to 400 free credits on day one when you join through an invite.
What is Kaplan-Meier Survival Curve?
A Kaplan-Meier survival curve, or KM survival curve, is a stepwise graph that plots the estimated probability of survival on the y-axis against time on the x-axis. The curve starts at a survival probability of 1.0 and steps downward each time an event occurs, while small tick marks indicate censored subjects who left the study or had no event by the end of follow-up. With SciFig you generate a clean, publication-ready Kaplan-Meier survival curve with a number-at-risk table, ready to export.
Why time-to-event data needs this estimator rather than a mean
- Follow-up ends before every subject has an event. Dropping those subjects biases the estimate; treating their last observed time as an event time biases it the other way. The estimator uses their information up to the moment they leave the risk set, and no further.
- Subjects enter and exit at different times, so the denominator is not fixed. The risk set is recomputed at every event time instead of being taken from baseline.
- It is non-parametric — no assumption that the hazard follows an exponential, Weibull or any other distribution, which matters when the true hazard is not monotone.
- The shape carries information that a single summary statistic destroys: early separation that later converges, a plateau suggesting a cured fraction, or curves that cross.
- Reviewers read the plot, the risk table and the test together. A bare p-value with no curve is not acceptable in clinical journals.
- The method generalises far beyond mortality: relapse, graft failure, device failure, time to treatment discontinuation — any well-defined time to a first event.
What a complete survival figure contains
- Axes and time origin — survival probability from 0 to 1 (or 0-100%) against time since a clearly stated origin such as randomisation, surgery or diagnosis. The choice of time zero changes the curve and must be declared.
- Step function — flat between event times, dropping only where events occur, computed as the running product of (1 - d_i / n_i) over ordered event times.
- Censoring marks — small ticks where subjects leave without an event. The method assumes censoring is non-informative, meaning dropout is unrelated to prognosis; when it plainly is not, say so.
- Number-at-risk table — counts per arm at each labelled time point, aligned under the axis so the reader can see the denominator shrink.
- Confidence band — a pointwise 95% interval, usually from Greenwood's variance formula, which widens as the risk set empties.
- Median survival and landmark estimates — the time at which the curve crosses 0.5, with its interval, plus fixed-horizon rates such as 5-year survival for arms where the median is never reached.
- Comparison statistics and the competing-risks caveat — log-rank p-value and Cox hazard ratio; where subjects can fail from an unrelated cause, use the cumulative incidence function instead, because treating competing events as censored overstates the event probability.
Fields that depend on this plot
- Oncology trials, reporting overall survival and progression-free survival by treatment arm.
- Transplantation, tracking graft and patient survival with long, staggered follow-up.
- Cardiology and stroke research, plotting time to a first major adverse cardiovascular event.
- Infectious disease studies, measuring time to pathogen clearance or to relapse after therapy.
- Translational biomarker work, splitting a cohort by expression level and comparing the resulting strata.
- Reliability engineering and device studies, where the same estimator handles time-to-failure with right-censored units still in service.
What each variant of the Kaplan-Meier plot is for, and what a reviewer will look for in it.
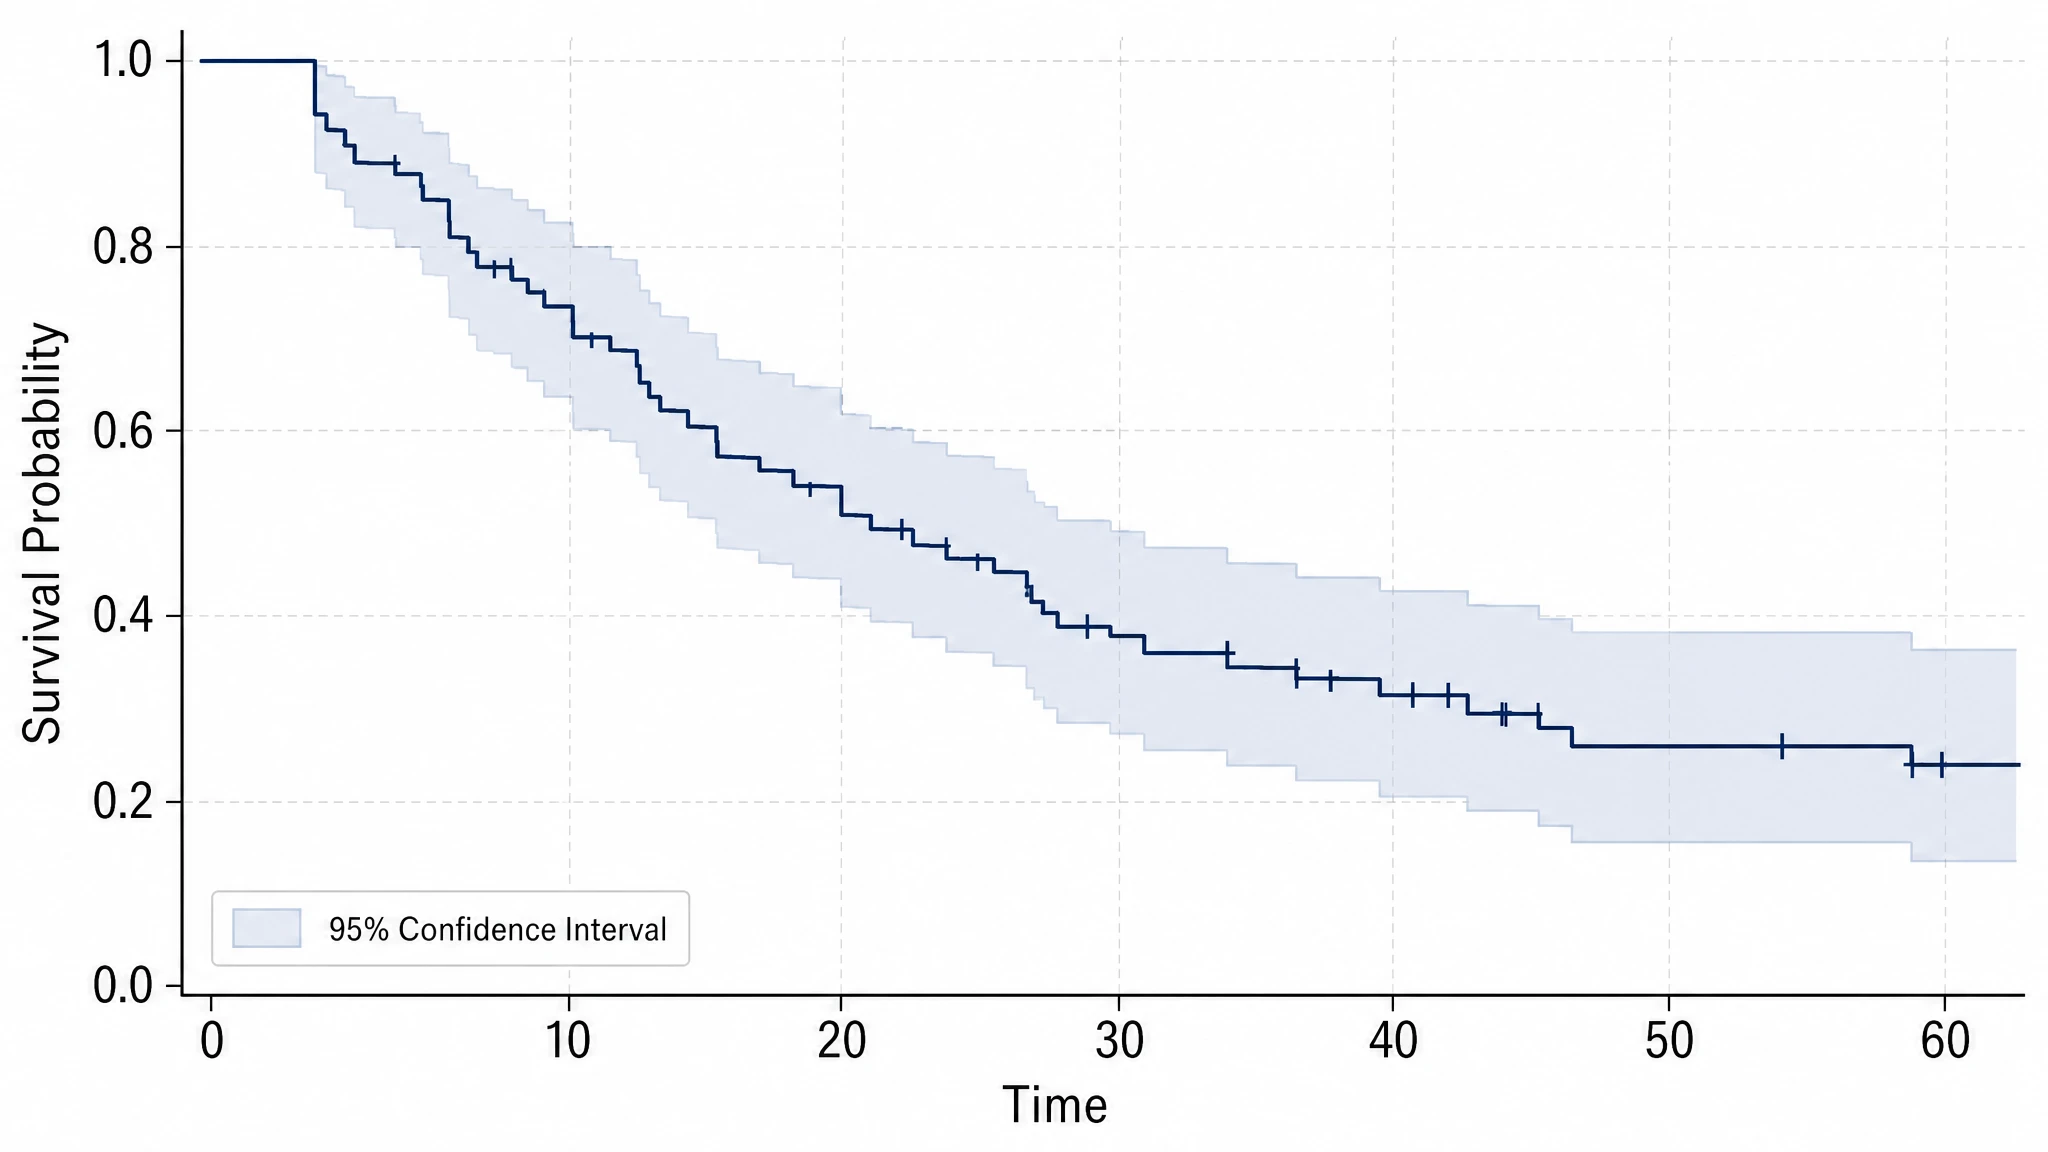
The step function and its censoring tick marks
Survival is estimated as a running product over event times: at each time an event occurs, the estimate is multiplied by (1 - d/n), where d is the number of events and n the number still at risk. Nothing happens between events, which is why the trace is flat and then drops. Tick marks flag censored subjects — lost to follow-up, or still event-free at analysis — who leave the risk set without an event.
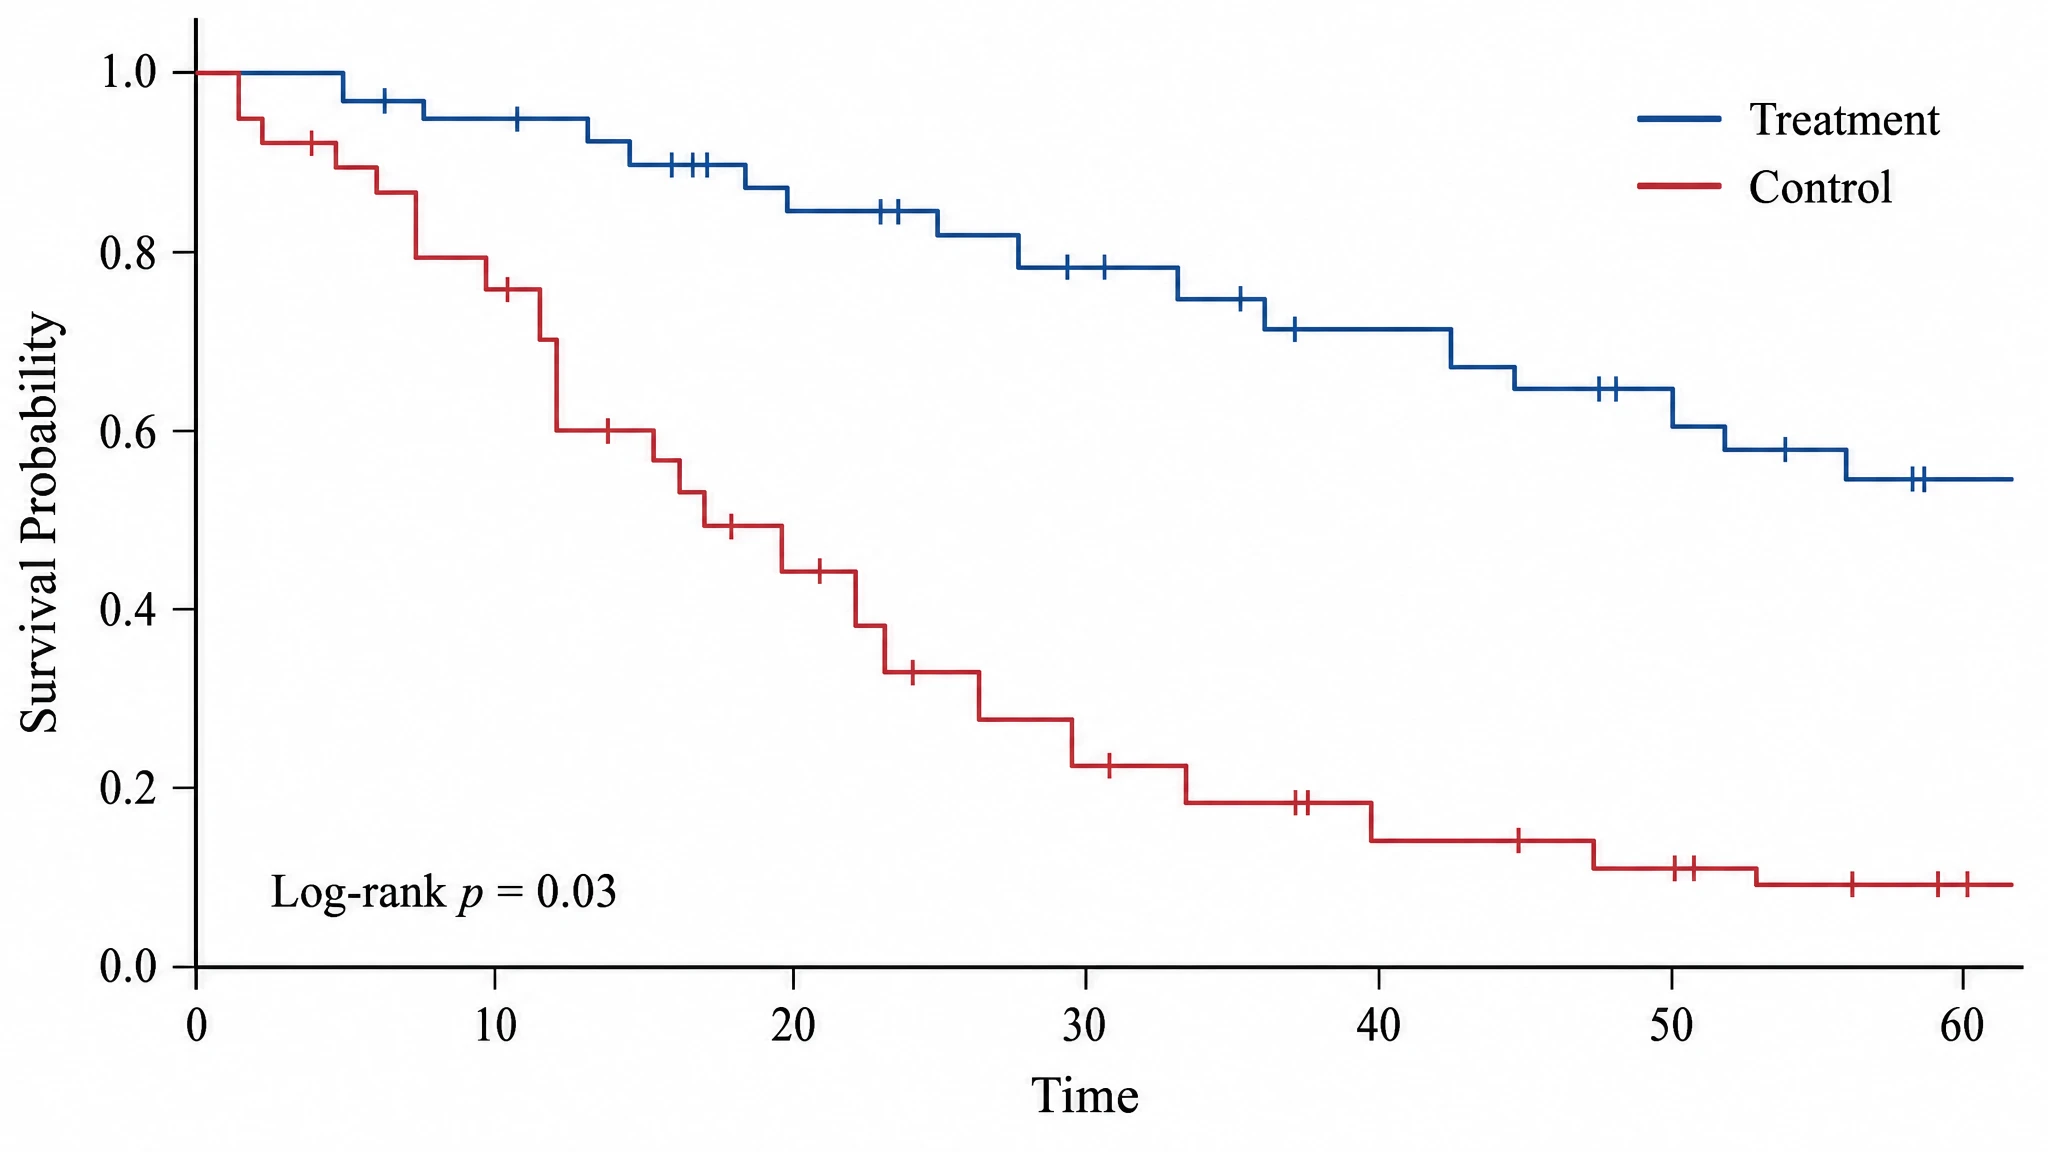
Two arms, a log-rank test, a hazard ratio
Arms are compared with the log-rank test, which pools observed-minus-expected event counts across all event times and tests the null of identical survival functions. It has most power when hazards are proportional. Always report an effect size beside it — a hazard ratio with a confidence interval from a Cox model — because a p-value alone says nothing about how large the separation between the arms actually is.
The number-at-risk table is not optional
The right-hand tail of any survival plot is estimated from very few subjects and therefore moves in large, unstable steps. A number-at-risk table beneath the time axis tells the reader how many remain in each arm at each labelled time, and so where the estimate stops being trustworthy. Most clinical journals now require it. Median survival belongs alongside it, with a 95% interval, and is undefined if the curve never reaches 0.5.
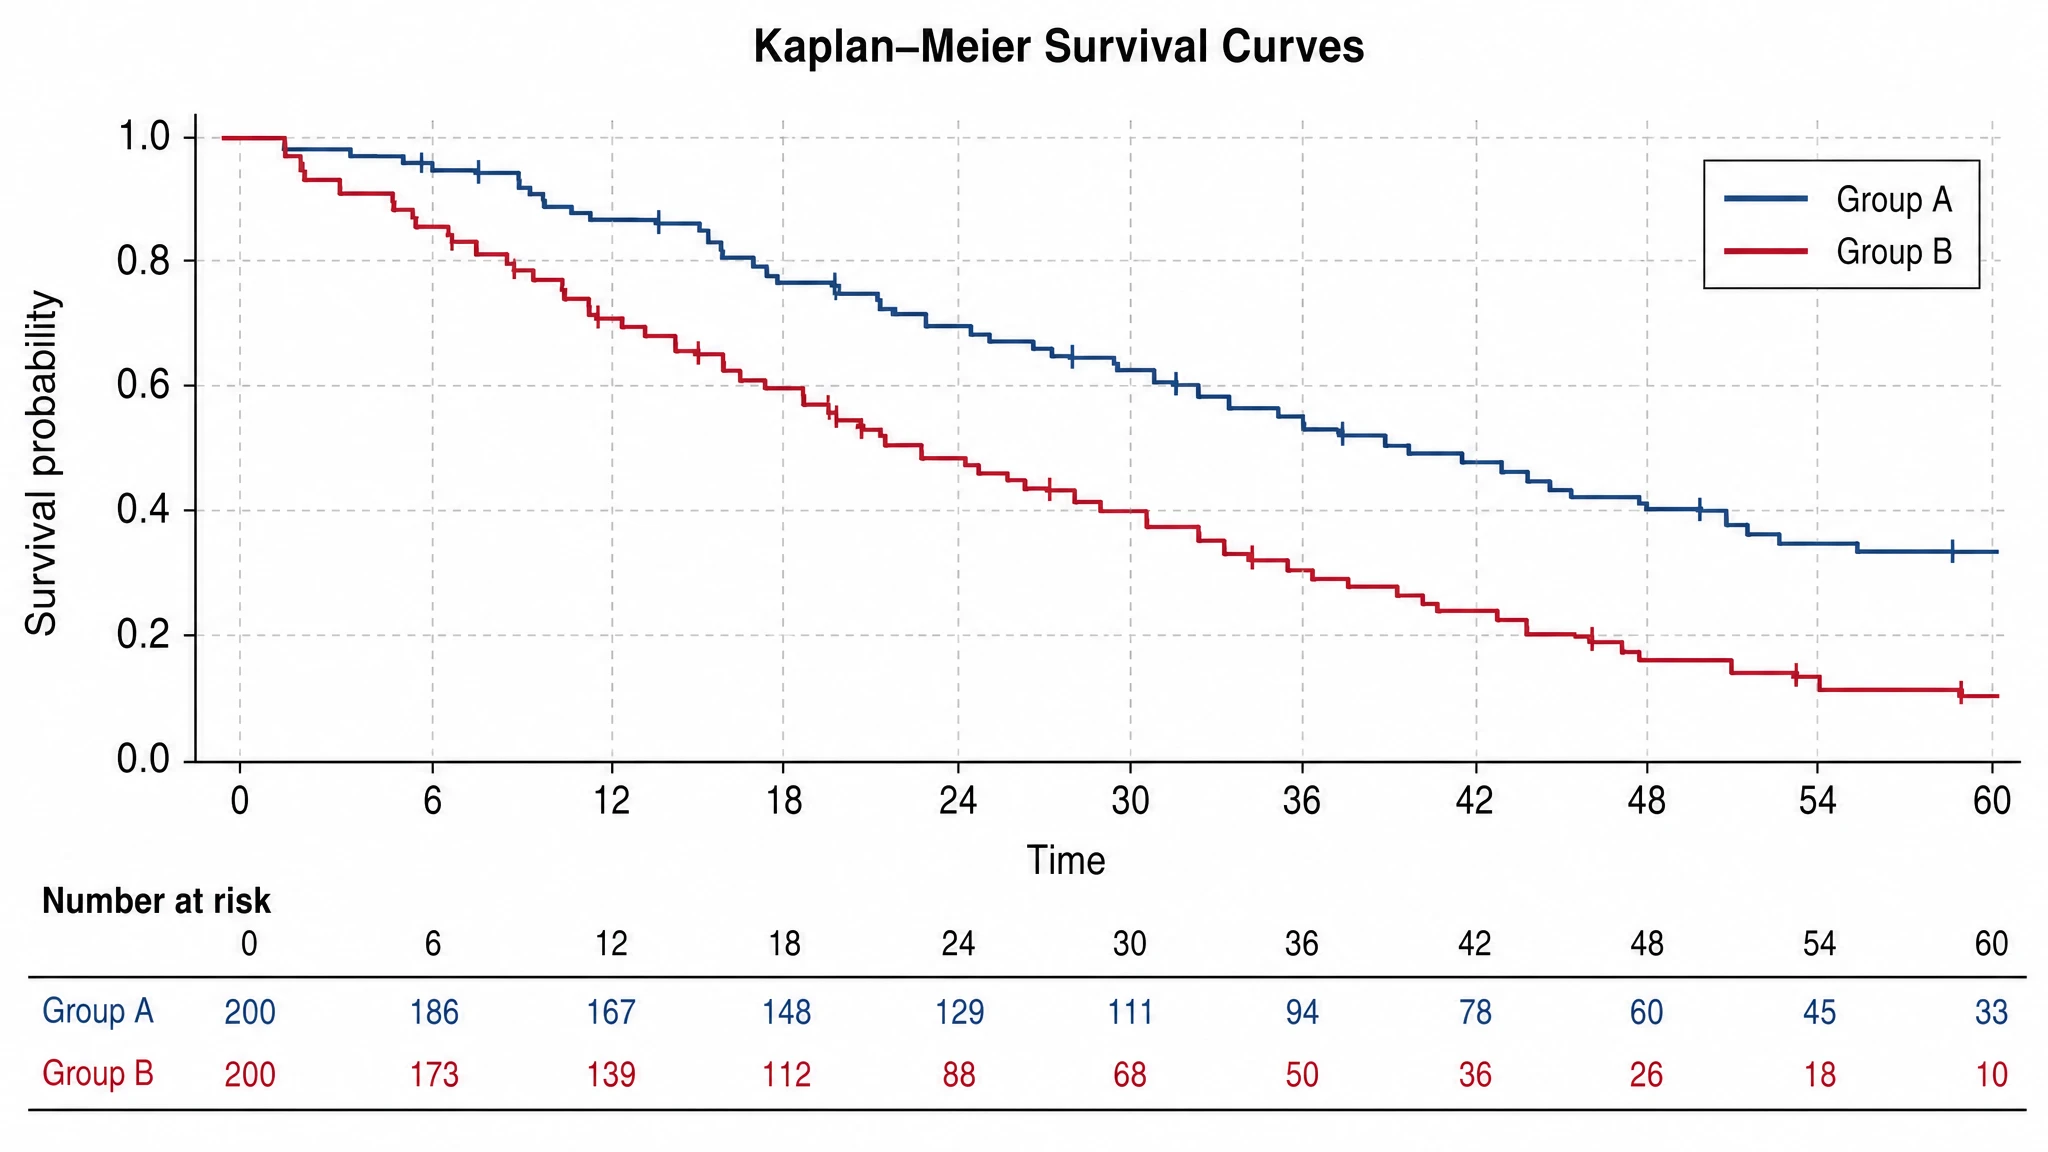
Three or more strata, and their pitfalls
Biomarker-high, -intermediate and -low strata are usually drawn on one panel. Two cautions apply. Pairwise log-rank tests across k groups need a multiplicity adjustment, and strata defined by a cut-point chosen to maximise separation will overstate the effect unless that cut-point was pre-specified or externally validated. Curves that cross are a visible sign that proportional hazards fails, in which case a single hazard ratio is not interpretable.
Kaplan-Meier Survival Curve— templates & examples
How to make Kaplan-Meier Survival Curve
Describe your figure
Tell SciFig what to draw in plain language — no design tools required.
Generate with SciFig
Get a clean, publication-ready figure that matches your description in seconds.
Edit & export
Vectorize it into editable SVG, relabel everything, and export for your paper, poster, or slides.
Related searches
- kaplan-meier survival curve
- km survival curve
- kaplan meier curve
- kaplan meier plot
- survival curve
- kaplan-meier survival curve graph
- kaplan-meier curves
- survival curve graph
- km plots
Make figures for
Frequently Asked Questions
Common questions about Kaplan-Meier Survival Curve.

Ready to publish?
Make your own Kaplan-Meier Survival Curve in minutes.
Start for freeFree to start · No credit card required · Built for researchers