
GC-MS System Schematic Diagram
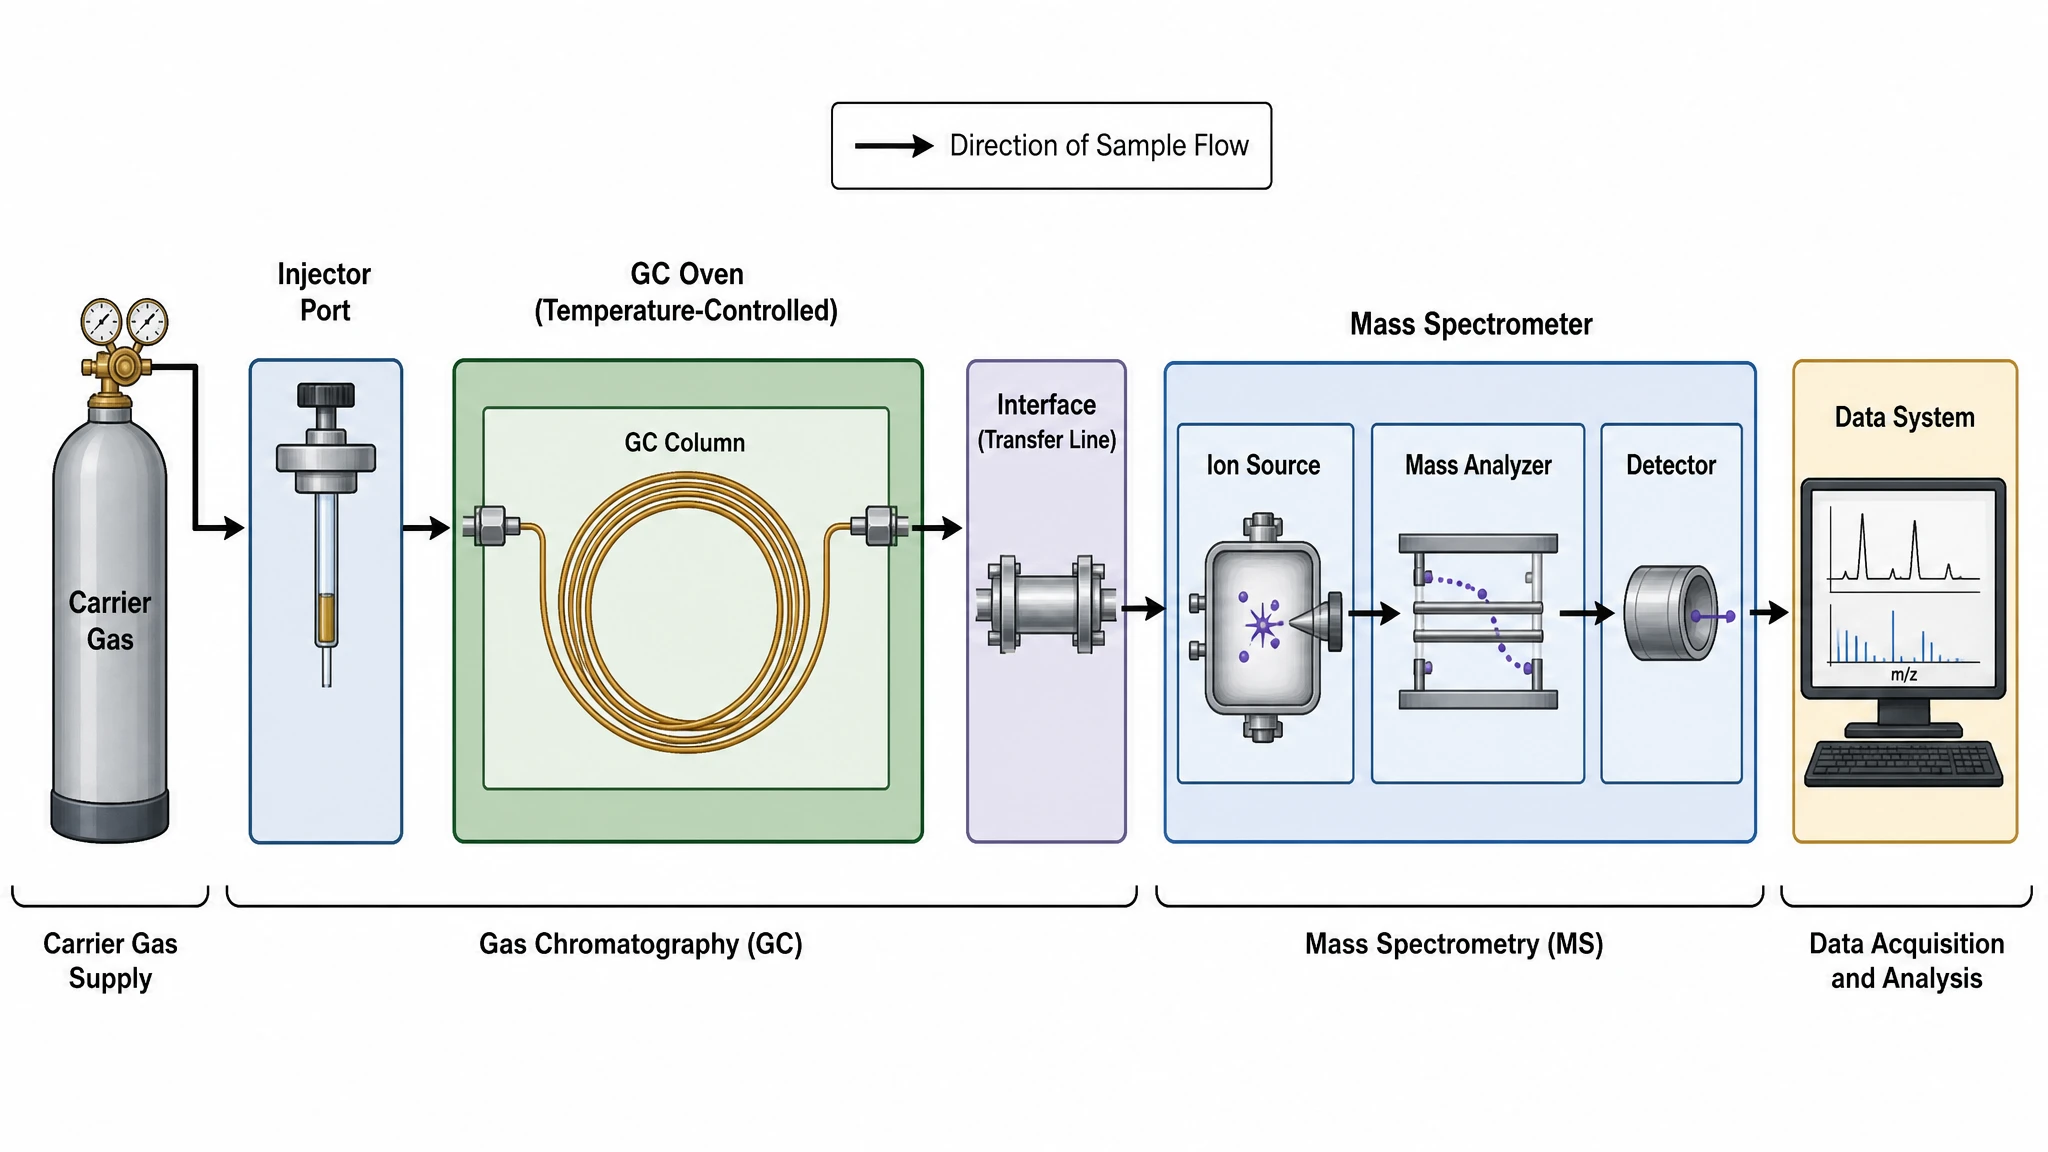
An editable GC/MS schematic that traces a sample from the injector through the gas-chromatography column into the mass spectrometer's ion source, analyzer, and detector.
Updated

Start with up to 150 free credits|No credit card required
Get up to 350 free credits on day one when you join through an invite.
What is GC-MS System Schematic Diagram?
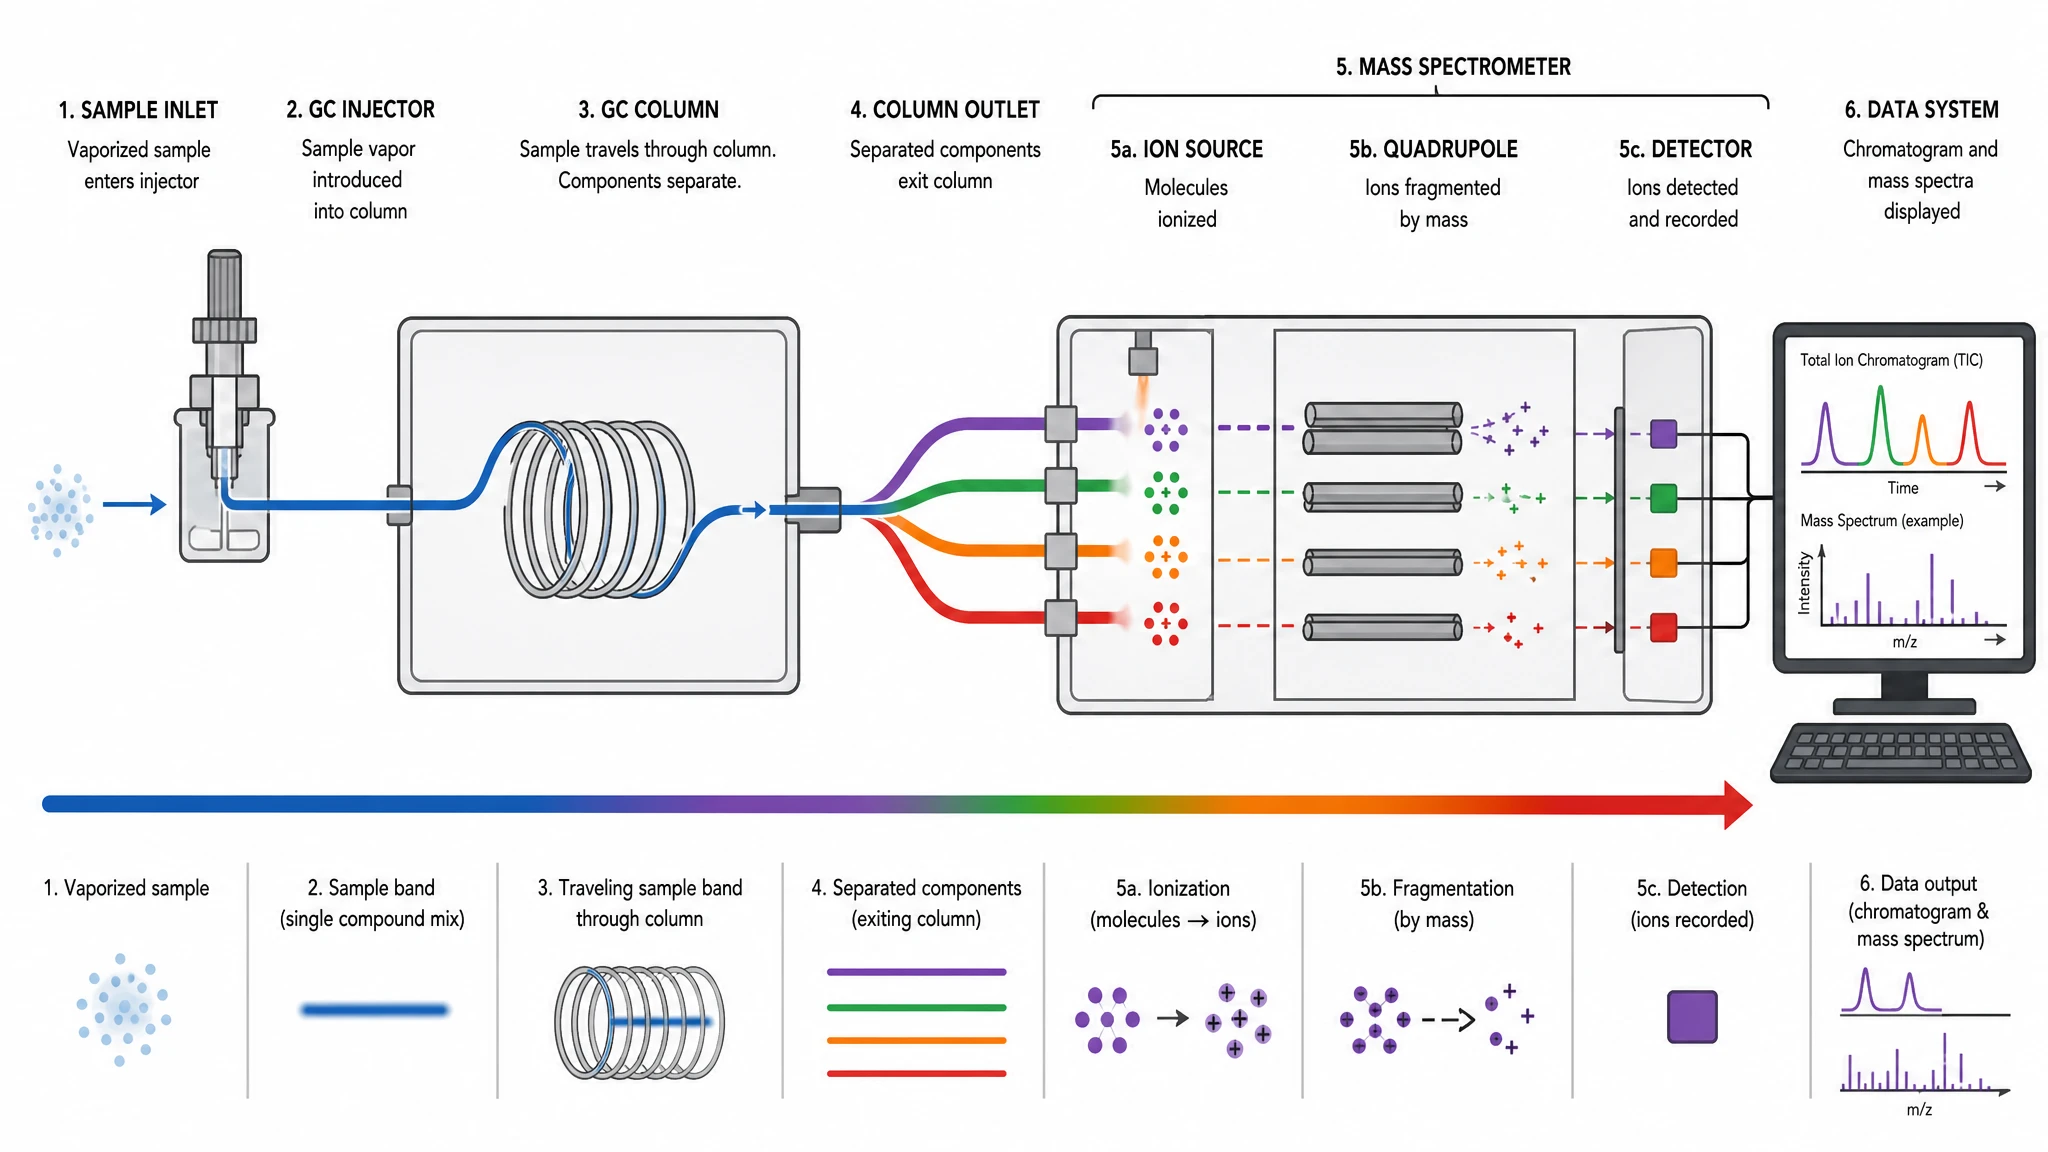
A GC-MS schematic is a block diagram of a gas chromatography–mass spectrometry instrument. It traces a sample from the injector port, through the heated GC column where compounds separate, into the mass spectrometer — the ion source ionizes each eluting compound, the mass analyzer sorts ions by mass-to-charge ratio, and the detector records them. With SciFig you describe the GC/MS workflow in plain language and generate a clean, editable schematic you can relabel and export.
Why your paper needs an instrument schematic
- Methods sections are judged on reproducibility — a diagram shows conditions that prose buries
- Reviewers can check the ionization mode and analyzer type at a glance instead of parsing paragraphs
- Analytical chemistry journals increasingly expect instrument figures in supplementary material
- Teaching and onboarding go faster when the sample path is visual rather than described
- Method-validation reports and SOPs need a consistent, reusable instrument figure
- A clean schematic separates your setup from the generic vendor diagram everyone else reuses
Key components to label
- Carrier gas supply — typically helium or hydrogen, with pressure regulation
- Injector port — split, splitless, or on-column, held above the analyte boiling range
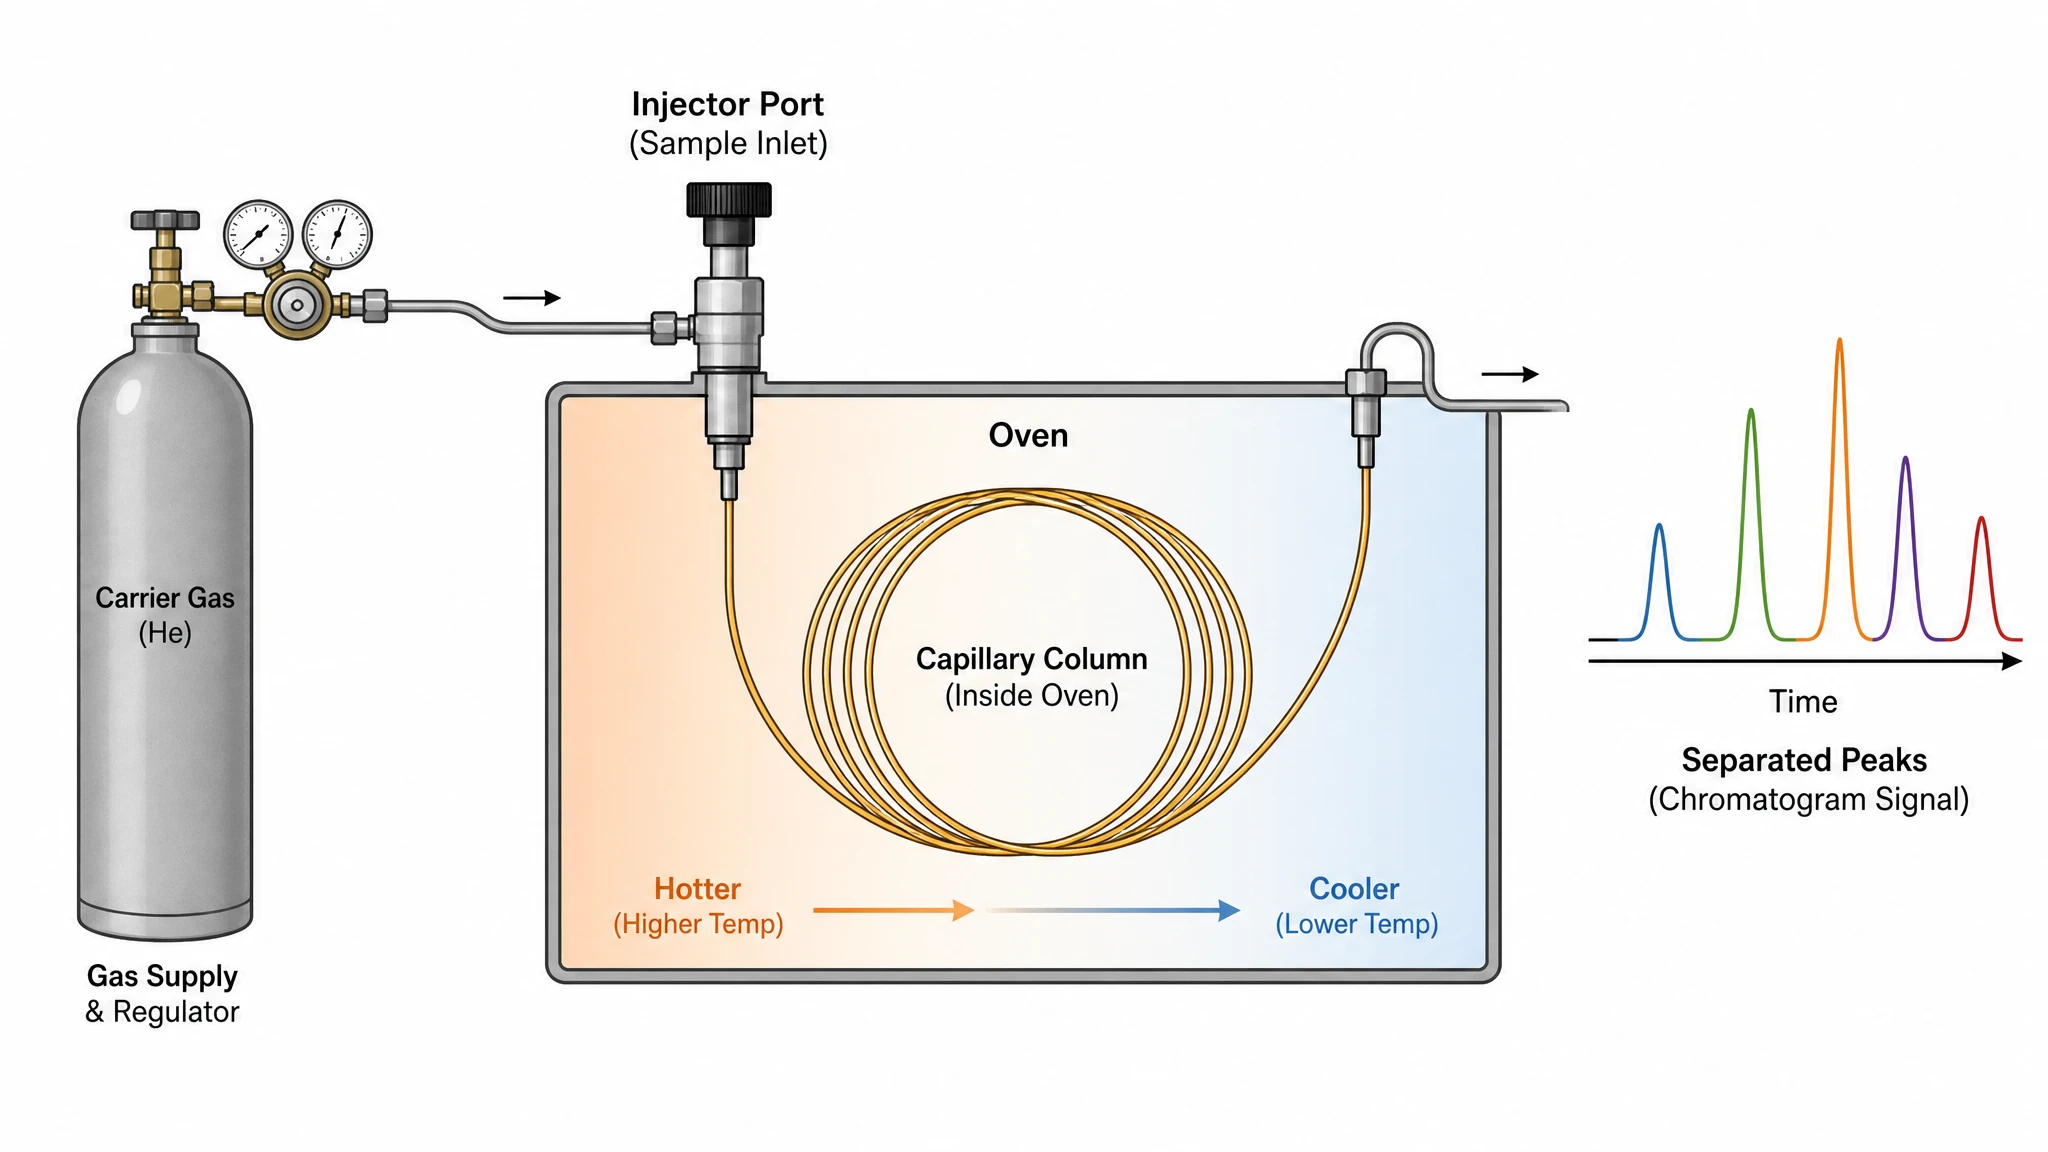
- Capillary column inside the temperature-programmed oven — where separation actually happens
- Heated transfer line — keeps eluting compounds in the gas phase into the mass spectrometer
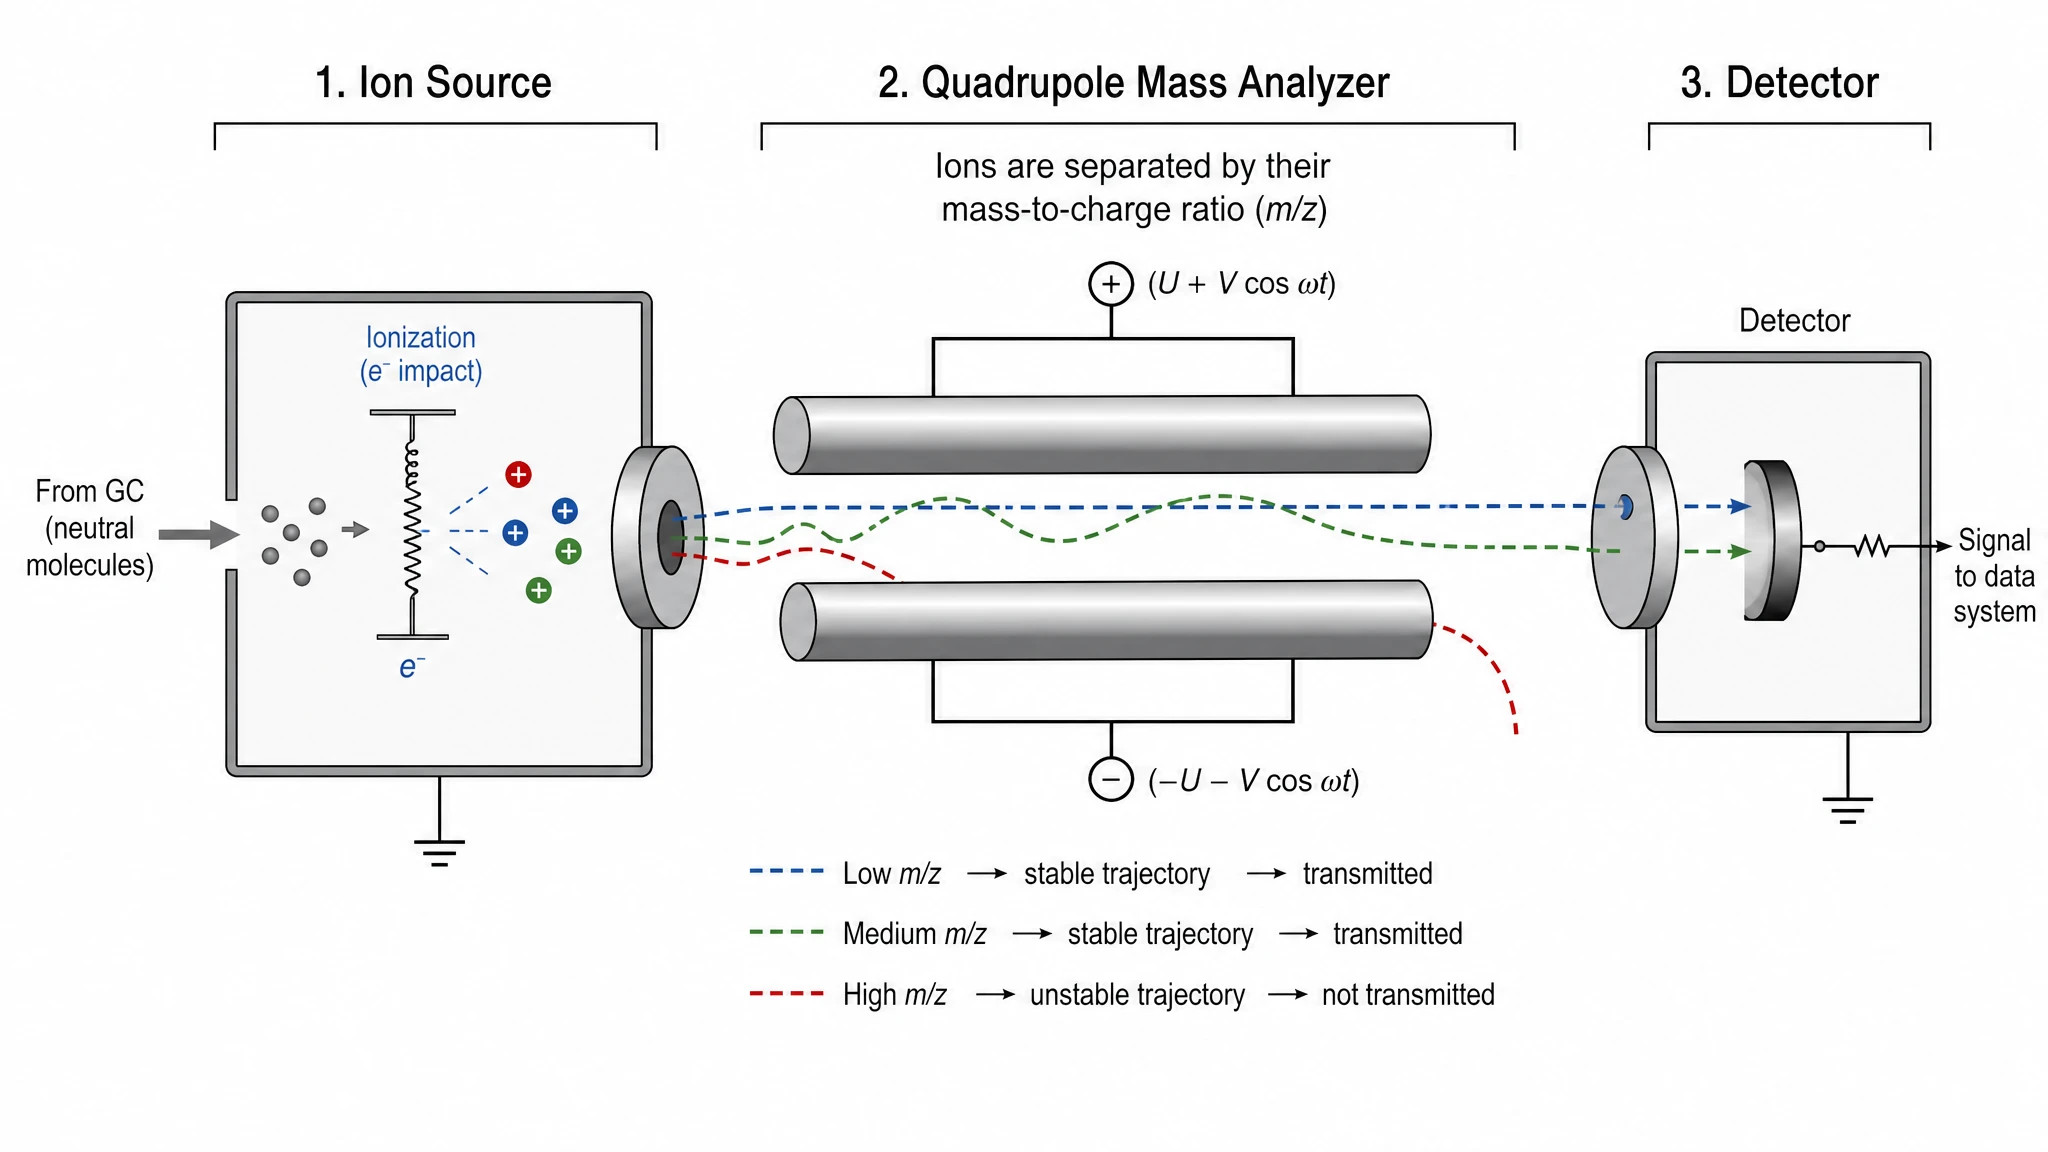
- Ion source — electron ionization at 70 eV, or chemical ionization for softer fragmentation
- Mass analyzer — quadrupole, ion trap, or time-of-flight, sorting ions by mass-to-charge ratio
- Detector and data system — electron multiplier feeding the chromatogram and spectra
Where researchers use this figure
- Methods sections and supplementary material in analytical chemistry manuscripts
- Grant applications that must justify the analytical platform
- Standard operating procedures and method-validation documentation
- Lecture slides and lab-onboarding material for new students
- Environmental, forensic, metabolomics, and food-safety workflows built on GC/MS
- Theses and dissertations where the instrument chapter needs its own figure
Everything you need in a publication-ready GC/MS schematic
Trace the sample path from injector to detector
A schematic only earns its place in a methods section if a reader can follow the sample. Describe the run in plain language — split or splitless injection, carrier gas, oven ramp, transfer line temperature — and SciFig lays out the flow as labeled blocks with directional arrows, so reviewers can see exactly where the analyte goes and what happens to it at each stage.
Show the column and oven conditions that matter
Separation happens in the column, so that is where most questions land. Call out the stationary phase, column length and internal diameter, and the temperature program, and they appear as annotated callouts rather than buried in prose. Reviewers checking reproducibility can read your conditions off the figure instead of hunting through the text.
Break the mass spectrometer into its three stages
The MS half is where most drafts get vague. SciFig renders the ion source, mass analyzer, and detector as distinct labeled stages — electron ionization or chemical ionization, quadrupole or time-of-flight, electron multiplier — so the ionization and mass-selection steps are explicit instead of collapsed into a single gray box marked "MS".
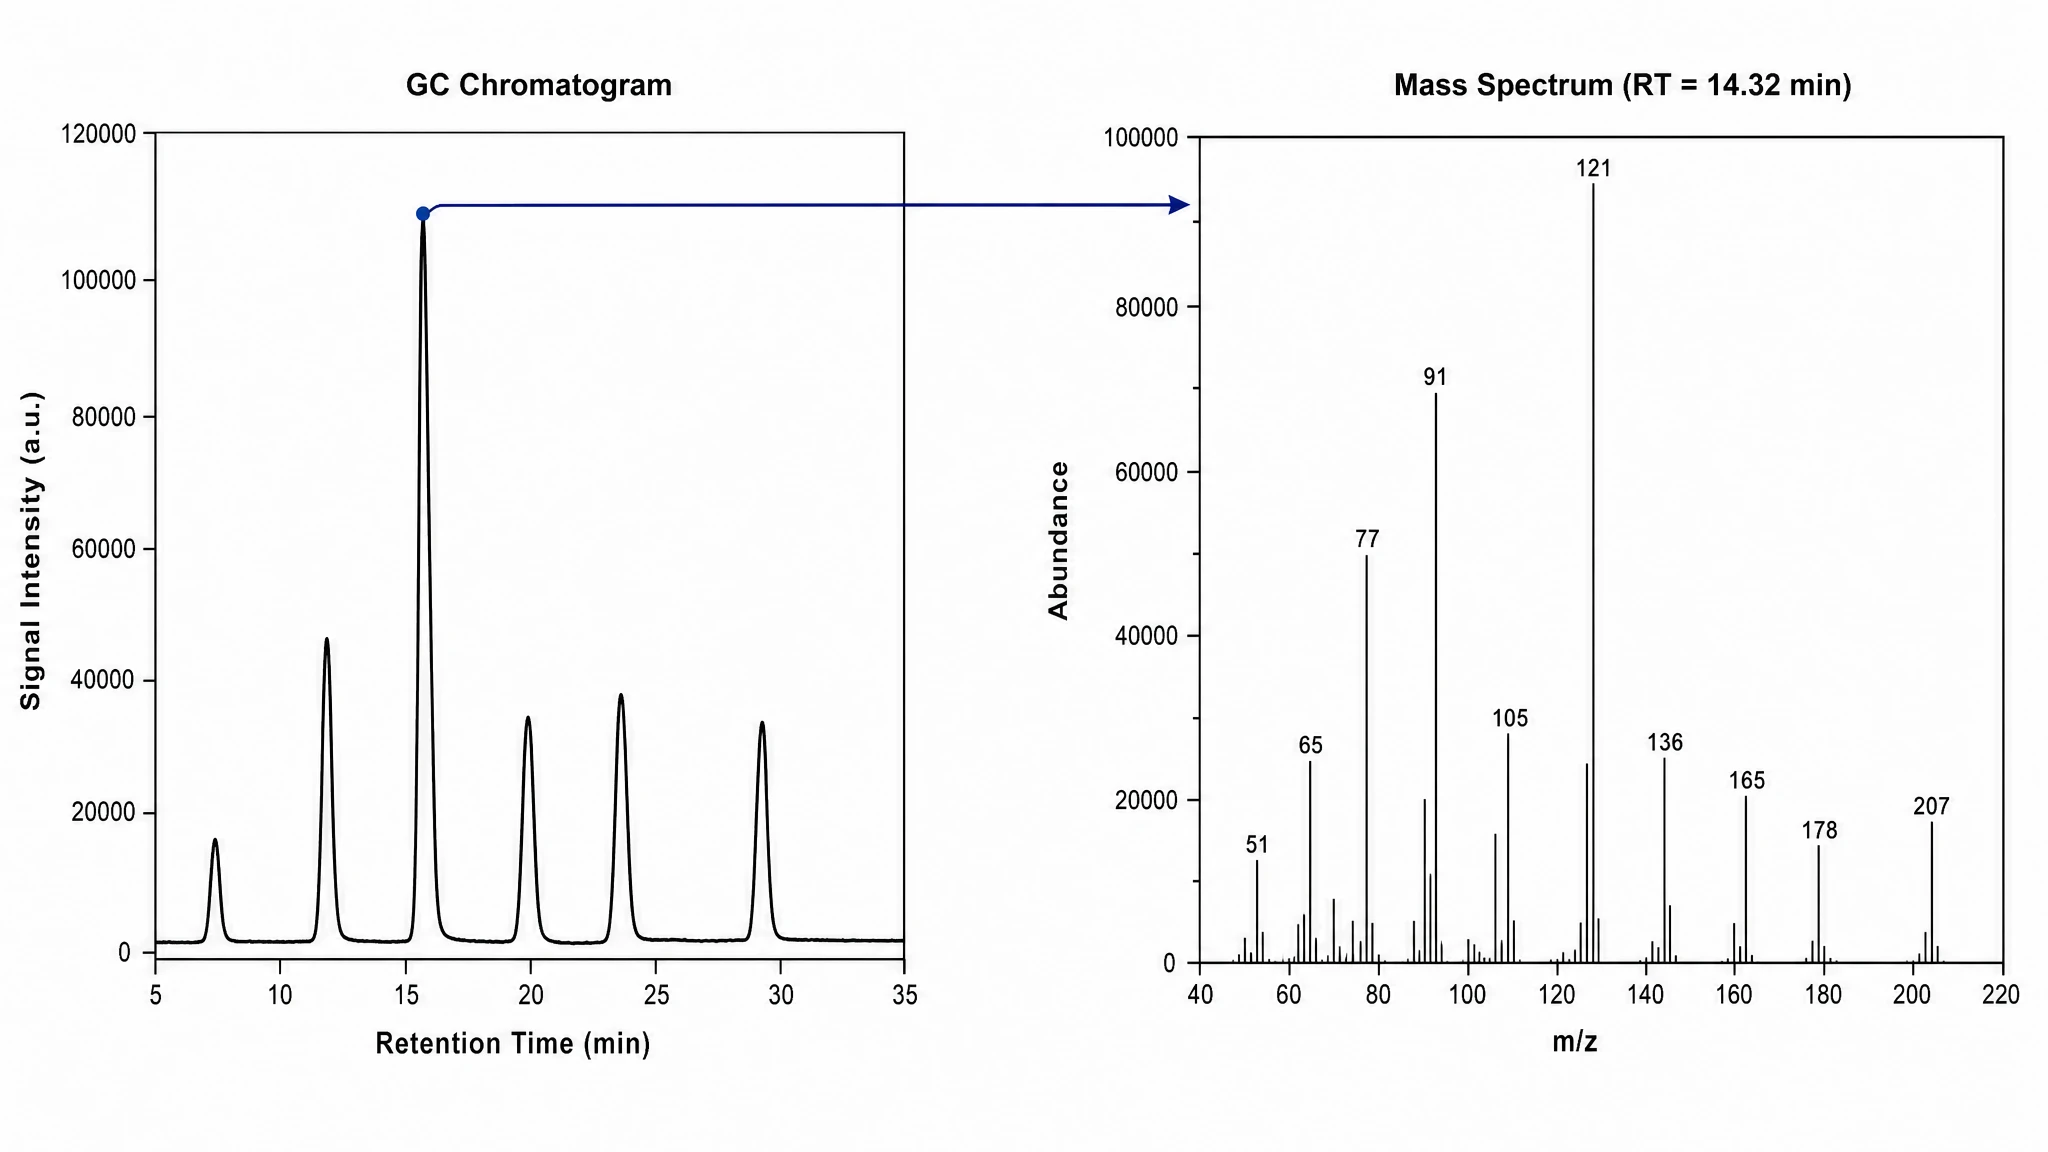
Pair the instrument with the data it produces
Instrument diagrams land harder when they connect to output. Place the total ion chromatogram and a representative mass spectrum alongside the hardware, and the figure explains not just what the instrument is, but what it gives you — retention time on one axis, mass-to-charge on the other, and the identification logic that links them.
GC-MS System Schematic Diagram— templates & examples
How to make GC-MS System Schematic Diagram
Describe your figure
Tell SciFig what to draw in plain language — no design tools required.
Generate with SciFig
Get a clean, publication-ready figure that matches your description in seconds.
Edit & export
Vectorize it into editable SVG, relabel everything, and export for your paper, poster, or slides.
Related searches
- gc/ms system illustration
- gc ms block diagram
- gas chromatography schematic image
- gc diagram
- gas chromatography chart
- gas chromatography image
- gcms photo
- mass spectrometry schematic
- gc-ms instrument diagram
- gas chromatography mass spectrometry diagram
Make figures for
Related pages
Analytical Chemistry Templates
Browse more Analytical Chemistry templates in SciFig's library.
All Templates
Browse every template page in SciFig's library.
Graphical Abstract Maker
Summarize your study in one panel
Scientific Poster Generator
Design a conference research poster
AI Scientific Image Generator
Generate research figures from text
Conceptual Framework Generator
Map variables and their relationships
Frequently Asked Questions
Common questions about GC-MS System Schematic Diagram.

Ready to publish?
Make your own GC-MS System Schematic Diagram in minutes.
Start for freeFree to start · No credit card required · Built for researchers