Papers with graphical abstracts get more views and citations. Design principles, common mistakes, and AI-powered workflow for compelling visuals.
SciFig Team
Scientific Illustration Experts
Papers with graphical abstracts get up to 3x more views on social media than those without. Journals like Cell, Nature Methods, and ACS Nano have made them mandatory. Yet most researchers treat graphical abstracts as a last-minute checkbox — a rushed illustration assembled the night before submission. The result is a visual that fails its only job: making a stranger want to read your paper.
This guide covers what actually makes a graphical abstract effective, the mistakes that undermine otherwise strong work, what leading journals expect, and a practical workflow for creating one that earns its place on the page.
The Data — Why Graphical Abstracts Matter
The case for investing time in your graphical abstract is not anecdotal. Studies on article-level metrics consistently show that visual summaries drive measurable engagement differences.
Elsevier analyzed download and view data across thousands of articles and found that papers with graphical abstracts recorded significantly higher abstract views than those without. Higher abstract views correlate directly with more full-text downloads — and downloads, in turn, are a leading indicator of eventual citations. The mechanism is straightforward: a compelling graphical abstract stops a researcher mid-scroll, earns thirty seconds of attention, and either earns a click or does not. A text-only abstract rarely stops anyone scrolling through a journal table of contents.
The social media dimension amplifies this effect. When researchers share papers on Twitter/X, LinkedIn, or ResearchGate, they attach the graphical abstract — not the methods section. A strong graphical abstract becomes the paper's ambassador to audiences who will never see the full text. Those audiences include potential collaborators, press contacts, funding program officers, and researchers in adjacent fields who might cite your work if they understood its relevance to their own.
Journal editors have noticed. Mandatory graphical abstract policies have spread from Cell and its family journals to Nature sub-journals, ACS publications, PLOS, and a growing list of specialty journals across disciplines. Treating graphical abstracts as optional is increasingly not an option.
Anatomy of a High-Impact Graphical Abstract
A graphical abstract is not a paper diagram transplanted into a new box. It is a standalone visual argument that communicates the core finding to someone who has not read a single word of the paper. Five design principles separate high-impact graphical abstracts from forgettable ones.
1. One clear message. The most common failure mode is trying to show too much. A graphical abstract should communicate exactly one thing: what you discovered, what it means, or how it works. If you cannot state that message in a single sentence, the visual will not convey it either. The discipline of choosing one message forces the clarity that makes graphical abstracts work.
2. Visual hierarchy. The reader's eye needs guidance. The main finding — the result that answers the central question — should be the visual anchor: largest, most prominent, positioned at the focal point. Supporting elements (methods, inputs, outputs) should recede. A flat composition where every element competes for attention is functionally identical to no visual hierarchy at all.
3. Minimal text. Graphical abstracts are not illustrated abstracts. Labels should identify elements, not explain them. If a label requires more than three or four words, you are writing a caption, not labeling a figure. The visual itself should carry the meaning; text provides orientation. A graphical abstract with paragraph-length text blocks has not solved the communication problem — it has restated it in a smaller font.
4. Consistent visual style. Every element in the scientific figure — icons, arrows, shapes, fonts — should look like it belongs to the same family. Mixing clip-art cell diagrams with hand-drawn arrows and stock photo laboratory equipment produces a visual that signals carelessness, regardless of how strong the science is. Style consistency communicates that the work is careful and considered, the same qualities reviewers look for in methods sections.
5. Strategic use of whitespace. Empty space is not wasted space. Whitespace separates logical elements, guides the eye between steps in a process, and prevents the visual overwhelm that causes readers to look away. Crowded graphical abstracts feel effortful to parse. Comfortable whitespace feels effortless — which is exactly the reading experience you want to create.
The 5 Most Common Graphical Abstract Mistakes
Understanding the principles is easier than avoiding the pitfalls in practice. These are the five mistakes that appear most frequently in submitted graphical abstracts, and what to do about each. For a broader take on figure-level mistakes across all paper figures, see our 5 common scientific figure mistakes guide.
Mistake 1: Information overload. The paper took three years and covers twelve experiments. The graphical abstract tries to show all of them. The result is a diagram that requires the same reading effort as the paper itself, defeating the purpose. Fix: Identify the single result that would make a colleague in an adjacent field say "interesting" — and show only that.
Mistake 2: Inconsistent visual style. Figure A was assembled from BioRender icons, Figure B uses hand-drawn elements, the arrows were added in PowerPoint, and the molecular structure was exported from ChemDraw at a different scale. The composite looks assembled, not designed. Fix: Commit to one visual language before you start. Everything should look like it was made by the same hand, in the same session.
Mistake 3: Poor color choices. Four shades of blue that are nearly indistinguishable in print. Red-green encoding that is invisible to colorblind readers. Neon colors that look fine on screen but bleed in print. Fix: Limit the palette to two or three colors with clearly distinct values. Test your color encoding without color — if the scientific figure still communicates, the palette is robust.
Mistake 4: Illegible text. Labels sized for a 1200px display that print at 4pt. Font choices that look designed but become unreadable at journal reproduction sizes. Fix: Check all text at the actual publication size, not the screen size. If any label drops below 8pt at final dimensions, it is too small.
Mistake 5: No visual flow. The reader does not know where to start or how to move through the scientific figure. Multiple elements compete equally for attention, and the logical sequence — input, process, output; before, after; cause, effect — is not visually encoded. Fix: Build a path. Use size, position, and arrows to create an unambiguous reading direction. The eye should arrive at the main finding last, not stumble across it.
See AI Scientific Figure Generation in Action
Watch how researchers create publication-ready scientific figures from text descriptions.
Journals do not just want a graphical abstract — they want a specific kind of graphical abstract. Understanding house style and technical requirements before you design saves significant rework.
Cell and Cell family journals have established one of the most recognizable graphical abstract aesthetics in publishing: flat vector illustration with a clean, geometric style, limited palette, and clear visual hierarchy. Cell's guidelines specify a 1:1 aspect ratio (square), maximum dimensions of 400 × 400 pixels at 72 dpi for online display, and RGB color mode. The Cell aesthetic rewards simplicity — if it cannot be expressed as clean flat vectors, it probably does not belong.
Nature family journals tend toward a more sophisticated, sometimes illustrative visual vocabulary. The expectation is scientific accuracy combined with visual craft — figures that look like they were made by someone who understands both the biology and the design. Nature journals typically require a landscape orientation and vector-compatible file formats (PDF, EPS, or high-resolution TIFF). The house style varies somewhat across sub-journals (Nature Methods has different conventions than Nature Cell Biology), so checking the specific journal's author guidelines is non-negotiable. (If your graphical abstract was AI-generated, see our 2026 journal AI-figure policy guide for disclosure requirements across Nature, Science, and Cell.)
Science occupies a distinctive position: the journal is known for figures where scientific rigor meets visual artistry. Graphical abstracts in Science often feel more compositionally ambitious than peer journals. The technical requirements (minimum 300 dpi, TIFF or EPS preferred) are standard, but the aesthetic bar is higher.
Practical format checklist for most journals:
Dimensions: check the journal's specific size requirements; common formats are 1:1 or 16:9 aspect ratios
Resolution: minimum 300 dpi for print; 72–150 dpi for online-only (verify per journal)
Color mode: RGB for online; CMYK for print — many journals require both
File types: TIFF, PDF, or EPS preferred; JPEG is generally not accepted due to compression artifacts
Font embedding: embed all fonts or convert to outlines before submission
Always download the journal's author guidelines for figures before beginning — a graphical abstract built to the wrong dimensions is rework that could have been avoided in twenty minutes of reading.
Creating a Graphical Abstract with SciFig
The traditional workflow for a graphical abstract involves several hours of tool-switching: sourcing icons from one platform, assembling in another, exporting to a third. The SciFig AI-assisted workflow compresses this significantly — in our own lab testing, end-to-end time from first prompt to journal-ready export dropped from 3–5 hours to under 30 minutes.
Step 1: Define the one message. Before opening any tool, write one sentence: "This graphical abstract shows [X]." If you cannot write that sentence, you are not ready to design. Go back to the paper, identify the central finding, and state it plainly.
Step 2: Draft the visual structure in words. Describe the scientific figure the way you would explain it to a colleague verbally. "On the left, a cell under stress. Arrow pointing right to a nucleus with a highlighted gene. Arrow pointing down to a simplified protein being expressed. Arrow pointing to a downstream phenotype." This verbal description becomes the input for AI generation.
Step 3: Generate with a text-to-figure tool. Using a platform like SciFig's text-to-figure generator, enter your verbal description as a prompt. Be specific about style: "flat vector illustration, limited color palette, white background, no text labels." Our S.S.V.D. prompt framework covers the pattern in depth. The AI will generate a complete figure. Expect to iterate — the first output is a starting point, not a final product.
Step 4: Refine the output. Review the generated figure against the five design principles: single message, visual hierarchy, minimal text, consistent style, whitespace. Adjust the prompt to address specific issues, or open the result in SciFig's vector canvas to refine element placement, colors, and proportions without leaving the workflow.
Step 5: Add labels and finalize. Add minimal text labels (element names, directional labels, a short title if required by the journal). Export in the journal's required format and at the correct resolution.
Step 6: Check at final size. Resize the scientific figure to its actual publication dimensions and review. Text legibility, color contrast, and visual hierarchy should all hold at the smaller size. This is the test that catches problems before submission — not after.
Create Scientific Figures Now
Describe your scientific figure in natural language — get publication-ready illustrations in minutes.
The one-message rule is the most important constraint in graphical abstract design. If you are struggling to simplify your figure, try this: show it to a colleague in a different field for ten seconds, then ask them to describe what the paper is about. If their answer matches your central finding, the scientific figure works. If they describe the method, or list three separate results, the scientific figure is still doing too much. Keep simplifying until the ten-second impression matches the message.
Before-and-After — A Practical Example
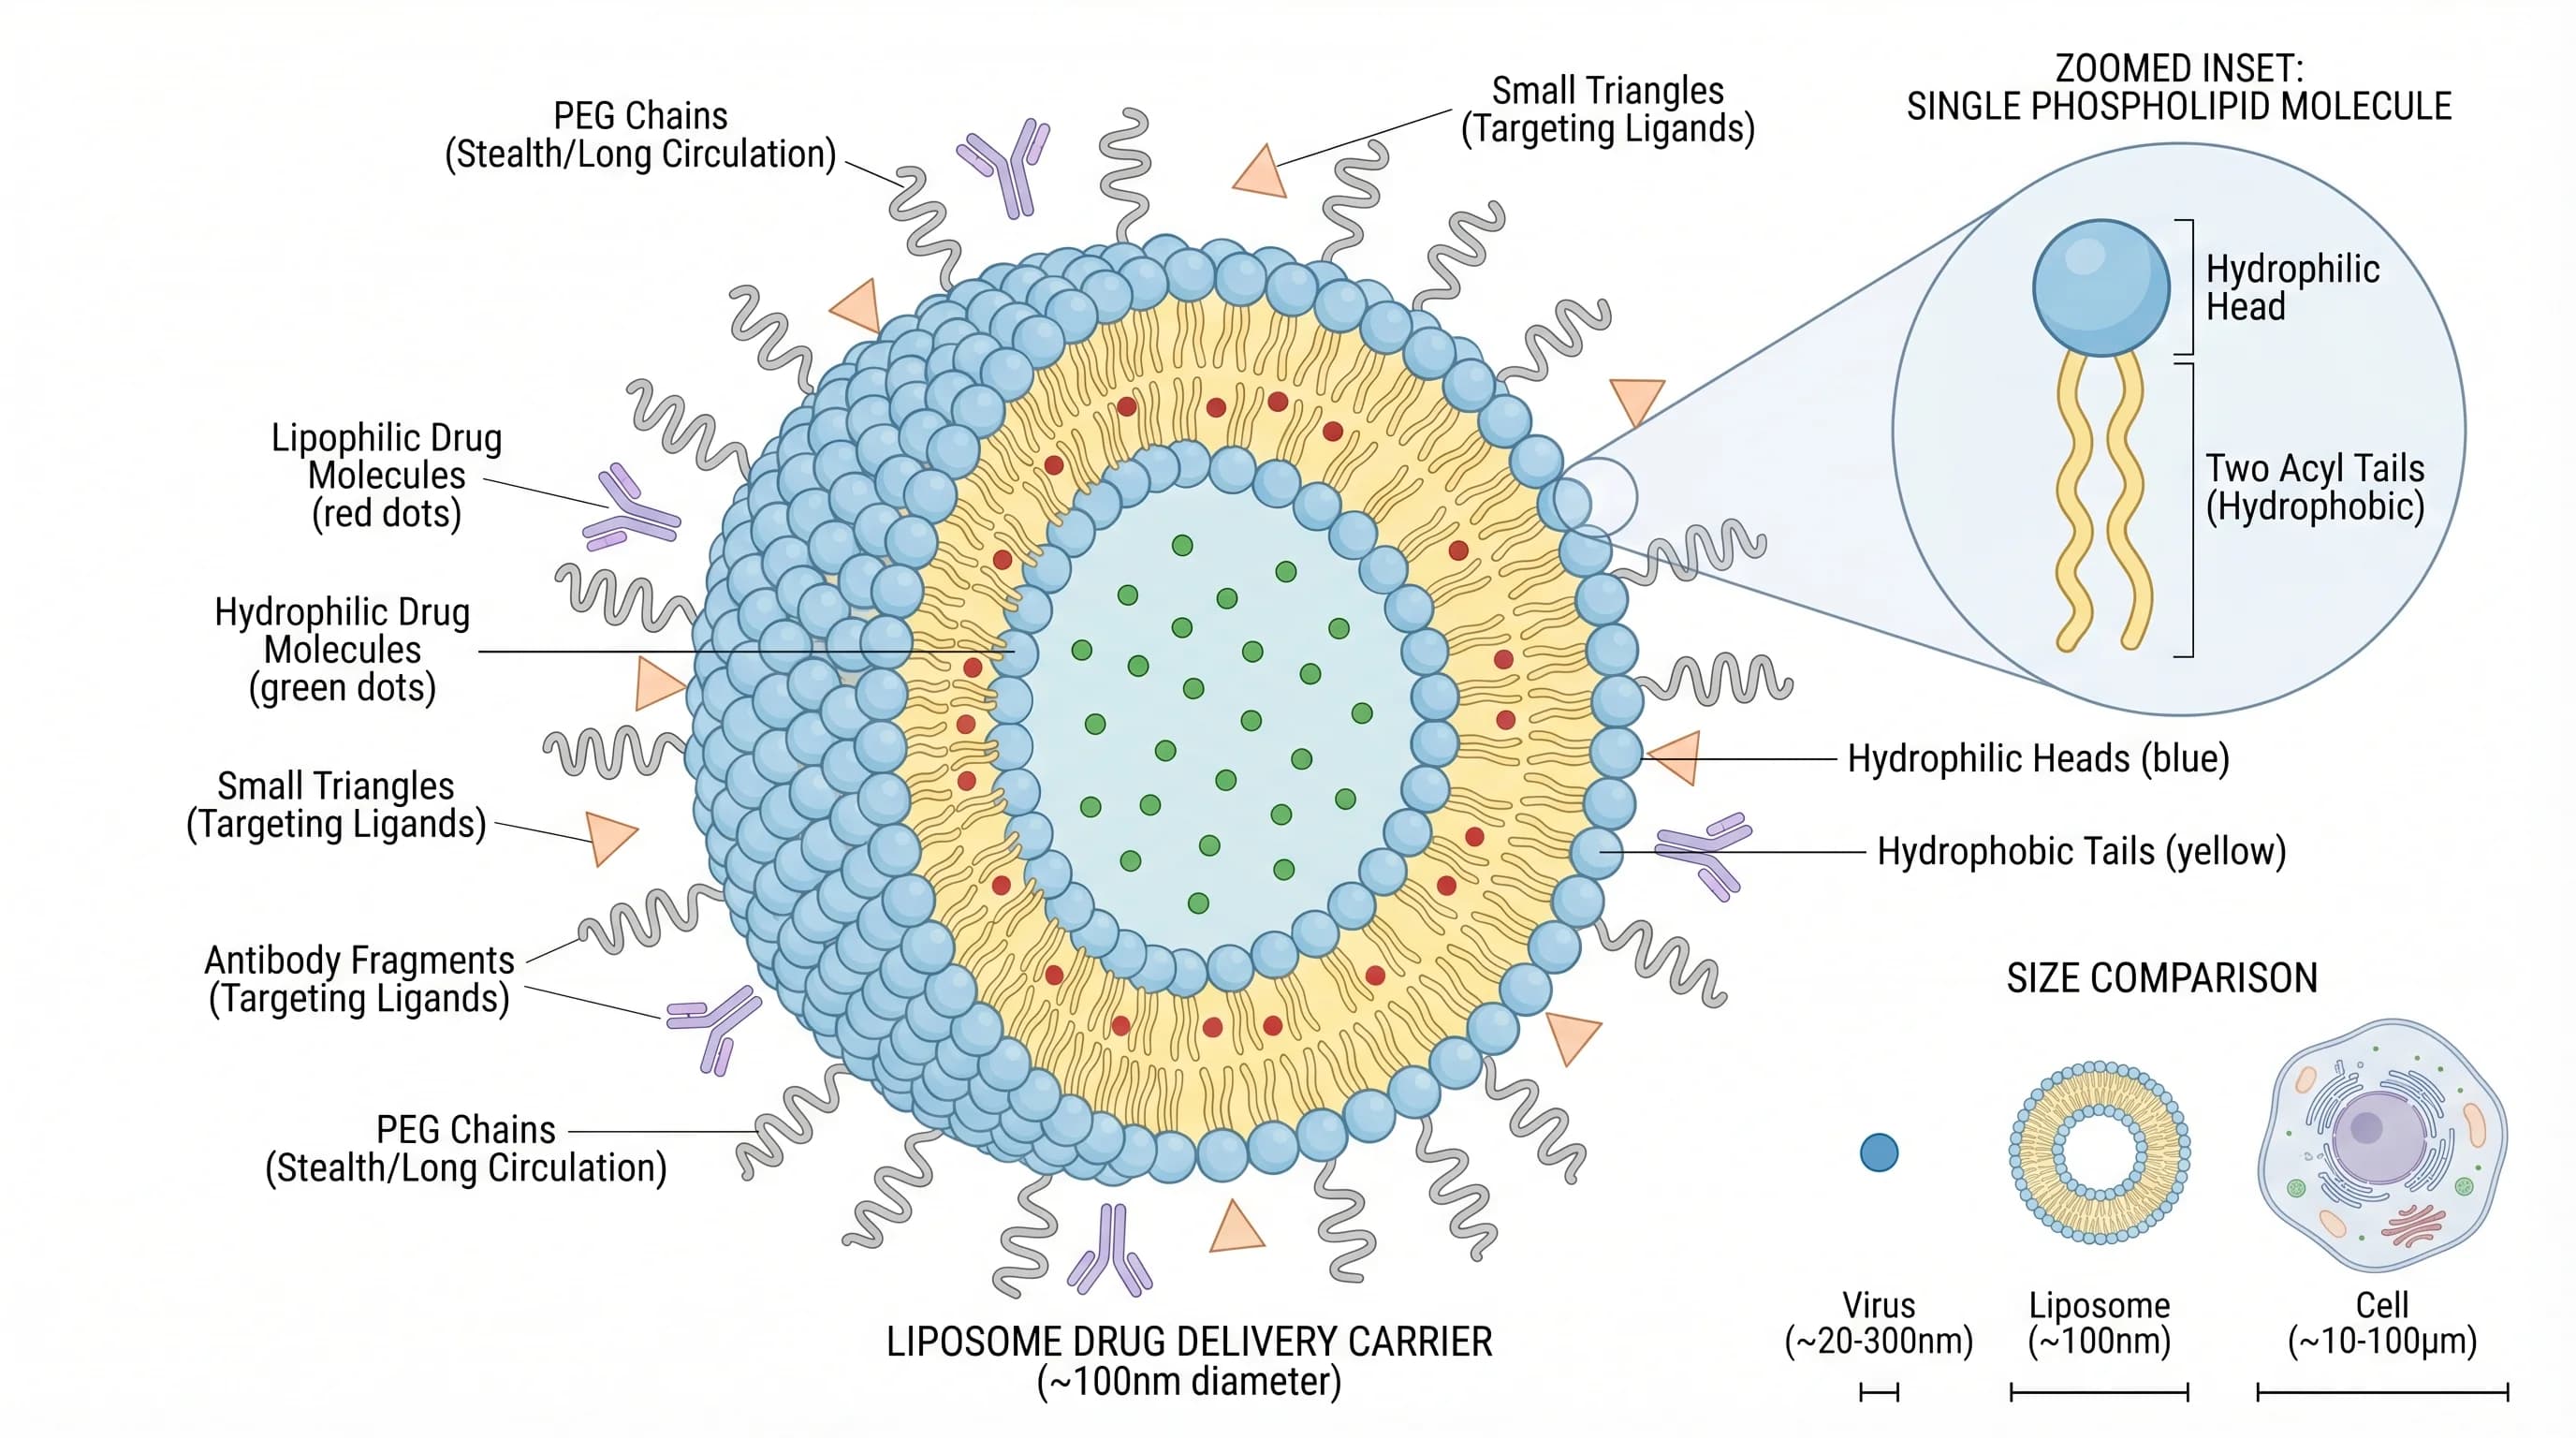
Consider a graphical abstract for a paper about a novel nanoparticle drug delivery system that improves tumor targeting. The first draft shows: the nanoparticle synthesis route (four chemical structures with reaction arrows), a cross-section diagram of the nanoparticle layers, a cell uptake mechanism with six labeled steps, a comparison bar chart of tumor uptake percentages, and a mouse model schematic with tumor location marked.
The result is a figure with five separate visual arguments competing for attention. A reader has no idea where to look, what the main finding is, or why they should care. The synthesis chemistry is important to chemists; the uptake mechanism is important to cell biologists; the bar chart is the actual finding. For everyone reading a table of contents, none of it registers.
The revised version shows: a simplified nanoparticle (one clean icon, not a cross-section diagram) approaching a tumor cell, with a single bold arrow and a minimal label indicating "4.2× greater uptake." The background is white. There are no reaction schemes, no bar charts, no mouse diagram. The entire figure communicates one thing: this nanoparticle gets into tumor cells more effectively than the alternative.
The second version does less — and communicates more. A reader in any field understands in three seconds that the paper is about better drug delivery. Researchers working on tumor targeting click through. That is the only outcome the graphical abstract needs to achieve.
Quick Checklist Before Submitting
Use this checklist as the final gate before attaching the graphical abstract to a submission:
One message: Can you state the central finding in a single sentence? Does the scientific figure show that sentence and only that sentence?
Visual hierarchy: Is the main result the visual anchor — largest, most prominent, positioned centrally?
Text minimal: Are all labels three words or fewer? Does removing any label make the scientific figure unclear?
Style consistent: Do all elements (icons, arrows, shapes, fonts) look like they belong to the same visual family?
Whitespace present: Is there breathing room between elements, or does the scientific figure feel crowded?
Color robust: Does the scientific figure communicate if printed in grayscale? Have you tested for colorblind accessibility?
Text legible at size: Does all text remain readable at the journal's specified final dimensions?
Format correct: Dimensions, DPI, color mode, and file type match the journal's author guidelines?
Fonts embedded: Are all fonts embedded or converted to outlines?
Journal house style: Does the figure match the visual aesthetic expected by the specific journal?
A graphical abstract that passes every item on this checklist has done the work. One that fails three or four items will underperform relative to the paper it represents — a preventable outcome for work that took years to produce.